
Understanding Cardinality: Challenges and Solutions for Data-Heavy Workflows

Discover what cardinality means and how it impacts data processing, analysis, and machine learning. Learn about practical strategies and techniques for managing high cardinality, from data preprocessing to advanced optimization tools.
Jan 13, 2025  · 8 min read

I first encountered the concept of cardinality in a Quantum Mechanics class, during my Physics degree. In that class, cardinality referred to the size of a set, whether finite or infinite, and was linked to abstract concepts like countability and infinities. As I transitioned to software engineering, I realized that, to a data engineer or scientist, cardinality takes on a much more practical meaning: the distinctiveness of values in a dataset.

In one of my first projects analyzing real-world data, I learned just how challenging high cardinality could be. It slowed my database queries to a crawl and turned what should have been clear insights into a confusing mess. Since then, I have had some hands-on practice, and I have compiled this guide hoping it might help others in the same situation. You are in the right place if you want to learn what high cardinality is, what challenges it presents, and how to tame those in practical and effective ways!

What is Cardinality, and What is High Cardinality?

The concepts of cardinality and high cardinality can sound a little abstract, so let’s break them down.

Definition and examples

Cardinality refers to the number of unique values in a dataset column. A column with high cardinality contains a vast number of unique values, while columns with low cardinality contain fewer unique entries.

High cardinality is especially common in datasets involving unique identifiers, such as:

  • Timestamps: Nearly every value is unique when data is logged at the millisecond or nanosecond level.
  • Customer IDs: Each customer has a distinct identifier to track their activity.
  • Transaction IDs: Financial datasets often include unique codes for every transaction.

These unique values are important for tracking, aggregating, or personalizing data. However, their huge number can pose significant challenges in storage, performance, and visualization, which we’ll look at shortly.

Common real-life cases

High cardinality can manifest itself in every domain and industry. I have outlined a few examples below, to help you understand what high cardinality means in more practical terms.

E-commerce and customer data

E-commerce platforms generate enormous amounts of high-cardinality data on a daily basis:

  • Customer IDs: Each user is assigned a unique identifier to track behavior, purchases, and preferences.
  • Session IDs: Every browsing session is logged uniquely, leading to a large number of distinct values in session-tracking datasets.
  • Product SKUs: Stock Keeping Units are unique to each product variation, creating a high-cardinality column in inventory and sales data.

These datasets are essential for understanding user behavior, tracking inventory, and optimizing sales strategies, but the sheer number of unique entries often makes analysis complex.

Healthcare and patient records

In healthcare, the need for precise tracking and identification naturally results in high-cardinality data. For instance, we can find:

  • Patient IDs: Each patient has a unique identifier, to ensure accurate and secure record-keeping.
  • Appointment timestamps: Unique timestamps can be created for every patient interaction, from doctor visits to lab tests.
  • Insurance claim numbers: Every claim processed by insurance providers is assigned a distinct code for record-keeping and audit purposes.

This data is needed to maintain patient histories and ensure compliance with privacy regulations.

IoT sensors and streaming data

The proliferation of IoT devices has created a surge in high-cardinality datasets:

  • Sensor IDs: Each IoT device has a unique identifier to track its activity and location.
  • Timestamp data: Continuous data streams often log events at millisecond or nanosecond intervals, resulting in almost entirely unique values.
  • Event IDs: Every recorded event in a system, from temperature readings to motion detections, is assigned a unique identifier.

In IoT, high cardinality arises due to the need to process fine-grained, real-time data from numerous devices. This is vital for analytics and monitoring but challenging to store and query efficiently – more on this later!

Challenges of High Cardinality

High cardinality presents several challenges across data processing, engineering, analysis, and machine learning. Datasets with high cardinality provide a wealth of useful information, but they can often become a bottleneck and hinder performance, interpretability, and scalability.

Data storage and performance issues

One of the biggest challenges of high cardinality is its impact on data storage and system performance.

  • Storage overhead: High cardinality columns, such as unique identifiers or timestamps, result in larger datasets. For instance, logging millions of user interactions on an e-commerce platform creates immense storage overhead due to the uniqueness of session IDs or transaction timestamps.
  • Decreased query performance: When querying high-cardinality columns, databases struggle with the increased complexity of indexing and scanning. Queries that involve filtering or joining on high-cardinality columns tend to take longer, as the database has to sift through a massive number of distinct values.
  • Indexing challenges: Indexes, which are essential for speeding up database queries, become bloated and less efficient with high-cardinality columns. This can lead to slower lookups and degraded performance.

Let’s take a database storing IoT sensor data with unique sensor IDs and precise timestamps as an example. Queries that filter by a specific sensor and time range may require the database to process millions of unique entries, leading to super slow response times and resource-intensive operations.

Data visualization difficulties

The challenge here lies in presenting a large number of distinct values in a way that is both understandable and meaningful. Without careful thinking, high-cardinality data can actually hide insights instead of revealing them.

A good example of this is the pie chart below. The legend and values are unreadable because there are too many unique entries (states) for the type of chart used. Sometimes, changing the type of graph we use helps, but not always. 

Unreadable pie chart with a slice and value for each US state.

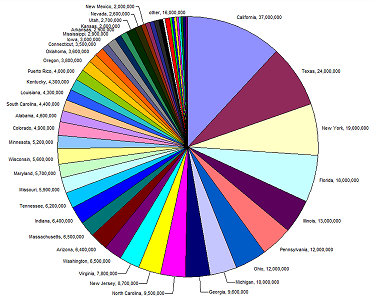
Source: European Environment Agency

Imagine a bar chart representing an ecommerce platform’s customer activity by session ID. With thousands or millions of unique IDs, the chart becomes a mess of unreadable bars, and changing the type of chart we use to plot this data is unlikely to make a difference. 

Okay, so why don’t we simply aggregate the data to derive patterns and relationships from our charts? We can, but it has to be done carefully. Aggregating high-cardinality data can lead us to lose the granularity we need to derive insights. For example, grouping IoT data by location might obscure subtle but critical variations at the individual sensor level. The techniques to fix this issue can be subtle. I recommend our Intermediate Data Modeling in Power BI course to get hands-on experience with one-to-one and one-to-many relationships. 

Relevance to machine learning

High cardinality can pose significant challenges in machine learning, particularly when it comes to feature engineering, model complexity, and interpretability. Machine learning models thrive on structured and meaningful inputs, but high-cardinality features often disrupt this balance, leading to complications:

  • Increased sparsity: High-cardinality features often result in sparse datasets. For example, one-hot encoding a high-cardinality categorical feature like ZIP codes creates a matrix with a vast number of dimensions, most of which are empty. This sparsity makes it harder for models, especially distance-based ones like k-nearest neighbors or clustering algorithms, to find meaningful relationships in the data.
  • Overfitting risks: High-cardinality features can lead to overfitting in models that split data into fine-grained categories, such as decision trees or random forests. When each category is represented by only a few samples, the model may learn noise instead of genuine patterns, resulting in poor generalization to unseen data.

For instance, in e-commerce, a machine learning model predicting customer churn might include a high-cardinality feature like "user ID" or "product ID." If not properly managed, the model could overfit to specific customers or products in the training data. This would make it less effective when applied to predict churn for new users, as it learns patterns unique to the training dataset rather than generalizable trends.

Strategies to Manage High Cardinality

Effectively managing high cardinality requires a mix of domain-specific strategies and general data optimization techniques. These approaches not only improve system performance but also make data more interpretable and actionable.

Leveraging technology and tools

Thankfully, the challenges posed by high-cardinality datasets are widespread enough that various techniques and tools have been created and fine-tuned specifically to deal with them.

Database optimization

Managing high cardinality in databases often begins with optimizing how data is stored and queried, beyond simply removing duplicates. The most common techniques used are:

  • Bucketing (or binning): Grouping high-cardinality data into broader categories to reduce the number of unique values. For example, grouping zip codes by region rather than storing each one individually.
  • Partitioning: Structuring tables by partitions based on frequently queried fields. For instance, partitioning customer data by country can improve query performance in geographically distributed systems.
  • Indexing: Using indexes specifically designed for high-cardinality fields, like bitmap or composite indexes, can improve query speed while balancing storage efficiency.

Specialized software

If you are dealing with extremely high cardinality, there are specialized tools and platforms that can help you:

  • Columnar databases: These databases, like Apache Parquet or Amazon Redshift, are designed for analytical queries and can efficiently store and process high-cardinality columns.
  • NoSQL databases: In some cases, NoSQL databases like MongoDB or Elasticsearch can better handle the variability and size of high-cardinality datasets, especially when paired with schema-less designs.
  • Time series databases: For datasets dominated by timestamps and events, such as IoT sensor data or stock market transactions, time series databases like InfluxDB or TimescaleDB are super helpful. They are specifically optimized to efficiently store high-cardinality dimensions and use advanced compression techniques to minimize storage costs while still being highly performant. I have worked on a few projects involving huge amounts of IoT data, and time series databases made a big difference when it came to deriving trends and predictions. I wrote this guide to time series databases, if you are interested in learning more! 
  • Data profiling tools: Tools such as Talend, OpenRefine, or even custom Python scripts can quickly identify high-cardinality fields and assist in determining the best pre-processing or storage strategy.

Data preprocessing techniques

Preprocessing in data science and machine learning refers to the steps taken to clean, transform, and organize raw data into a suitable format for analysis or modeling.

It is quite a meaty topic, and if you have little-to-no data engineering or data science knowledge, the information in this section might be a little difficult to follow. That said, I have included relevant links and examples to help you follow along!

Data preprocessing is an essential step for managing high cardinality, as it reduces complexity, enhances performance, and ensures the data quality is sufficient for analysis or machine learning tasks. By transforming raw data into more manageable forms, we can address challenges like sparsity, storage inefficiencies, and computational bottlenecks.

Dimensionality reduction

Dimensionality reduction techniques are particularly valuable when high cardinality results in datasets with numerous features or sparse matrices. These methods compress data into fewer dimensions while still retaining critical information.

Principal Component Analysis (PCA)

Imagine you have a dataset of e-commerce customer behaviors, with a lot of features like the number of times a customer has viewed a product, their interaction with different product categories, time spent on the website, and so on. Each of these features may be highly cardinal, especially if you're tracking a large number of products. PCA can be used to combine these features into fewer components that still capture the most significant patterns in the data, such as overall customer engagement or interest in particular product types. Think of it as the Marie Kondo of data: It keeps the features that spark joy and gently discards the rest!

t-SNE and UMAP

t-SNE and UMAP are techniques that are especially useful for visualizing high-dimensional data by mapping it into two or three dimensions while preserving its structure. For instance, in healthcare records datasets, UMAP might help by grouping patients with similar medical conditions or treatment regimens together. This will help spot trends such as common co-occurring diseases or treatment outcomes.

Feature selection

If you're building a machine learning model to predict sales performance for an e-commerce platform, and your dataset includes features like the number of times a customer has clicked on an ad, the number of products they've viewed, and the number of days since their last purchase, you will find that many of these features may be correlated with one another, which creates high cardinality and redundancy. 

Using feature selection techniques like mutual information or recursive feature elimination, you could identify which features have the most significant predictive power (e.g., "time since last purchase" might be more important than "clicks on ad") and exclude the irrelevant ones, ultimately improving your model performance.

If you are interested in learning more on this topic, try this Preprocessing for Machine Learning course. You will use Python to clean and prepare your data before feeding it to your models.

Encoding methods

Encoding is a critical preprocessing step for handling categorical data, particularly when dealing with high-cardinality features. The choice of encoding method depends on the specific use case and the level of cardinality in the dataset.

  • One-Hot encoding: One-hot encoding creates a binary column for each unique category in a dataset. While simple and effective for low-cardinality data, it can lead to extremely sparse matrices when applied to high-cardinality features. For example, encoding 1,000 unique zip codes would produce 1,000 binary columns, which can overwhelm memory and computational resources. Trust me, I learned that the hard way…
  • Target encoding (mean encoding): In this method, categorical values are replaced with the mean of the target variable for each category. For instance, if you're predicting customer churn, target encoding could replace each zip code with the average churn rate of customers in that area. This approach reduces dimensionality but can introduce bias and requires careful validation to avoid data leakage.
  • Frequency encoding: Frequency encoding assigns a category’s frequency as its value, reducing the number of unique values. For example, in an e-commerce dataset, product IDs could be replaced with their purchase frequency. This technique is resource efficient and often correlates with the importance of the feature.
  • Hashing encoding: Hashing encoding maps categories to integers using a hash function, which groups some categories together. This method is memory-efficient and works well for streaming data or extremely high cardinality, but it introduces the risk of hash collisions. Ever wondered why your online shopping website is recommending baby formula when you searched for car oil? Well, that is hash collisions for you.
  • Embedding layers: For machine learning models like neural networks, embedding layers can transform high-cardinality categorical features into dense, low-dimensional representations. This approach is widely used in recommendation systems, such as encoding millions of product IDs or user IDs in e-commerce platforms.

Conclusion

High-cardinality datasets might feel overwhelming at times, and extracting valuable insights from these datasets can definitely prove challenging. The next time you encounter a high-cardinality dataset, remember that it’s not the data's fault – it’s simply full of potential waiting to be unlocked. Whether it’s through dimensionality reduction, smart encoding techniques, or tools like time series databases, you can manage your datasets effectively and turn them into super powerful assets.

And now that you know how to work with high-cardinality data in theory, it is time to put it into practice:

  • Get hands-on with dimensionality reduction and encoding techniques – start small and work your way up. Our Dimensionality Reduction in Python is a great pick.
  • Test out some of the tools mentioned here (yes, time series databases are as cool as they sound!).

And most importantly, embrace the challenge. High cardinality might be tricky, but it’s also a chance to learn a lot about data engineering and analysis!


Marie Fayard's photo
Author
Marie Fayard

Senior Software Engineer, Technical Writer and Advisor with a background in physics. Committed to helping early-stage startups reach their potential and making complex concepts accessible to everyone.

FAQs

How can I identify high cardinality in my own datasets?

High cardinality can be identified by checking for columns with a large number of unique values relative to the number of rows. For example, in a customer dataset, a column like "customer ID" would likely have high cardinality because each entry is unique. Tools like pandas in Python can easily help you check the number of unique values in a column with commands like df['column_name'].nunique().

What are some real-world consequences if high cardinality is ignored in data analysis?

Ignoring high cardinality can lead to several problems, including performance issues (slower query times), challenges in making sense of the data (overly complex visualizations), and difficulties in machine learning models (overfitting or inefficient training). Without addressing high cardinality, your data analysis might become cluttered, inaccurate, or simply unmanageable.

Can high cardinality ever be beneficial in data analysis, or is it something to avoid?

While high cardinality is often seen as a challenge, it can provide valuable information in certain contexts. For example, in recommendation systems, high cardinality features (like user ID or product ID) help the system personalize recommendations. However, it's important to carefully manage how these features are used in models to prevent overfitting and performance degradation.

Is high cardinality more of an issue in structured or unstructured data?

High cardinality can be an issue in both structured and unstructured data, but it’s typically more challenging in structured datasets (e.g., relational databases) where cardinality is often linked to specific columns like identifiers or timestamps. In unstructured data, such as text or image data, cardinality issues can arise in more subtle ways, like too many unique words or pixels, which makes processing more complex.

Topics

Learn with DataCamp

course

Intermediate Data Modeling in Power BI

3 hr
28.4K
Master data modeling in Power BI.
See DetailsRight Arrow
Start Course
See MoreRight Arrow
Related

blog

The Curse of Dimensionality in Machine Learning: Challenges, Impacts, and Solutions

Explore The Curse of Dimensionality in data analysis and machine learning, including its challenges, effects on algorithms, and techniques like PCA, LDA, and t-SNE to combat it.
Abid Ali Awan's photo

Abid Ali Awan

7 min

blog

5 Common Data Science Challenges and Effective Solutions

Emerging technologies are changing the data science world, bringing new data science challenges to businesses. Here are 5 data science challenges and solutions.
DataCamp Team's photo

DataCamp Team

8 min

blog

Batch vs Stream Processing: When to Use Each and Why It Matters

An in-depth look at the differences between batch and stream processing for data pipelines. Learn each approach's unique advantages and disadvantages to apply the appropriate techniques for your data pipeline.
Tim Lu's photo

Tim Lu

21 min

tutorial

Normalization vs. Standardization: How to Know the Difference

Discover the key differences, applications, and implementation of normalization and standardization in data preprocessing for machine learning.
Samuel Shaibu's photo

Samuel Shaibu

9 min

tutorial

Preprocessing in Data Science (Part 1): Centering, Scaling, and KNN

This article will explain the importance of preprocessing in the machine learning pipeline by examining how centering and scaling can improve model performance.
Hugo Bowne-Anderson's photo

Hugo Bowne-Anderson

21 min

tutorial

Multicollinearity in Regression: A Guide for Data Scientists

Uncover the impact of multicollinearity on regression models. Discover techniques to detect multicollinearity and maintain model reliability. Learn how to address multicollinearity with practical solutions.
Vikash Singh's photo

Vikash Singh

9 min

See MoreSee More