
Course
Introduction to Data Engineering
4 hr
127.6K
If you often find yourself manually managing recurring tasks, you know it's not only tedious - it's a recipe for missed deadlines and inconsistent data pipelines.
Cron jobs are a go-to solution for automating repetitive tasks on Unix-based systems. They allow you to schedule commands or scripts to run at specific intervals. By leveraging cron's simple and flexible scheduling system, you can automate everything from basic data collection to complex ETL workflows that would otherwise require constant manual intervention. Setting up these automated processes eliminates human error and makes sure your data pipelines run consistently and reliably.
Mastering cron jobs is essential for any data engineering professional working in Unix environments. The sheer ability to schedule and manage automated tasks will improve your workflow tenfold and reduce maintenance overhead.
In this complete guide, I'll walk you through everything you need to know about cron jobs for data engineering - from basic setup to advanced use cases and best practices.
>Completely new to Data Engineering? Our course demystifies the buzzwords and explains the concepts.
A cron job is a time-based scheduler in Unix operating systems that lets you run commands automatically at fixed times, dates, or intervals.
Think of cron as your personal assistant that executes tasks exactly when you want them to run without manual intervention. For data engineers, this means you can automate database backups, data transfers, report generation, and more.
Cron jobs live in a simple text file called the "crontab" (cron table). Each line in this file represents a scheduled task and follows a specific format with six components:
* * * * * command-to-execute
│ │ │ │ │
│ │ │ │ └─── Day of week (0-6, where 0 is Sunday)
│ │ │ └───── Month (1-12)
│ │ └─────── Day of month (1-31)
│ └───────── Hour (0-23)
└─────────── Minute (0-59)
The first five fields tell cron exactly when to run your command. You can use specific values, ranges (like 1-5), lists (like 1, 3, 5), or asterisks (*) which means "every" unit of time. The sixth component is the actual command you want to execute.
For example, if you want to run a Python script to extract data from an API every day at midnight, your cron job would look like this:
0 0 * * * /usr/bin/python3 /home/username/scripts/extract_data.pyThis tells cron to run your script at 0 minutes, 0 hours (midnight), every day of the month, every month, and every day of the week. The absolute path to both the Python interpreter and your script makes sure the job runs correctly regardless of the environment.
You can create more complex schedules, too. Let's say you want to run a database cleanup every Monday, Wednesday, and Friday at 3:30 PM, this is what your cron expression will be:
30 15 * * 1,3,5 /path/to/cleanup_script.shEach asterisk acts as a wildcard and lets you create flexible schedules that match your exact needs. You can even use special shortcuts like @daily, @weekly, or @monthly to make common scheduling patterns more readable.
That's it regarding the basics. Up next, I'll show you hands-on how to work with cron jobs for data engineering tasks.
Now that you understand what cron jobs are, let's set up your first automated task. The process is straightforward and requires just a few commands to get started.
To create or modify cron jobs, you need to access your crontab file. You can do this with the crontab -e command:
crontab -e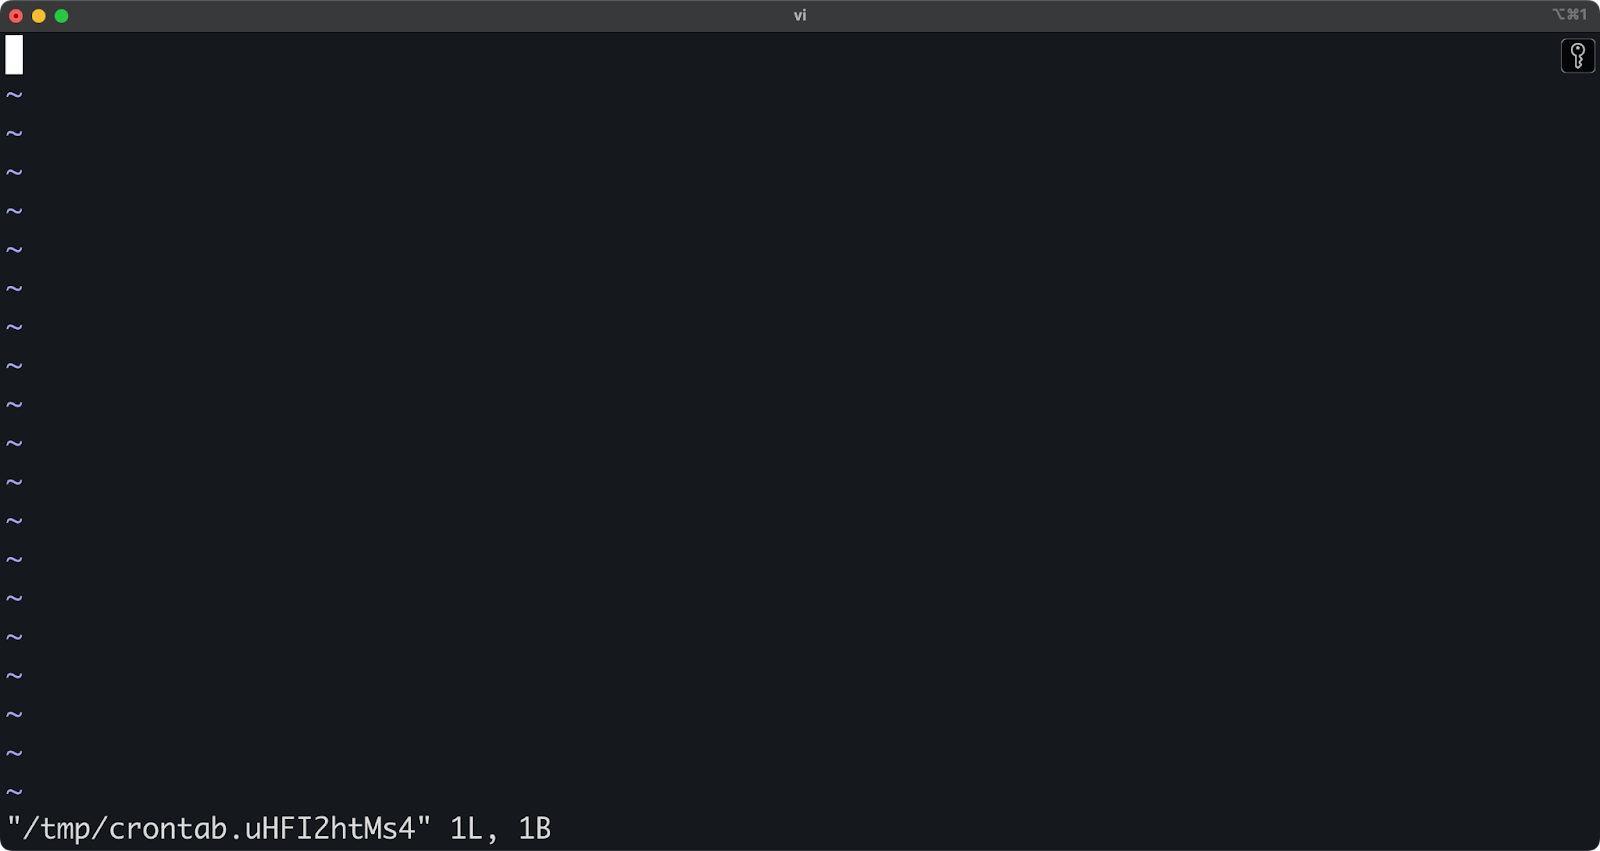
Image 1 - Editing a crontab file
The above commands open a vi text editor in which you can add, edit, or remove scheduled tasks.
Your crontab file might be empty if you've never used it before. To add a new cron job, simply add a new line following the cron syntax I explained earlier. Each line must include both the timing schedule and the command to run.
For example, to run a script every day at 3 AM, add this line:
0 3 * * * /path/to/your/commandSave the file and exit the editor. Cron will automatically install your new crontab and start running your jobs at the specified times.
Let's start with a practical example: scheduling a Python script to fetch data from an API every minute. Here's a complete Python script that connects to the REST API endpoint, fetches object data, and saves it to a CSV file - just make sure your Python interpreter has the requests and pandas packages installed:
# fetch_api_data.py

import requests
import pandas as pd
import os
from datetime import datetime

# Create a timestamp for the filename
timestamp = datetime.now().strftime("%Y%m%d_%H%M%S")

# Set file paths - CHANGE THIS
data_dir = "/Users/dradecic/Desktop/cron/data"
output_file = f"{data_dir}/objects_{timestamp}.csv"

# Make sure the data directory exists
os.makedirs(data_dir, exist_ok=True)

# Fetch data from the API
try:
    response = requests.get("https://jsonplaceholder.typicode.com/posts")
    if response.status_code == 200:
        data = response.json()

        # Check if we have data
        if data:
            df = pd.DataFrame([
                {
                    "id": row.get("id", ""),
                    "user_id": row.get("userId", ""),
                    "title": row.get("title", ""),
                    "body": row.get("body", "")
                } for row in data
            ])

            df.to_csv(output_file, index=False)

            print(f"Data successfully saved to {output_file}")
        else:
            print("API returned empty data")
    else:
        print(f"API request failed with status code: {response.status_code}")
except Exception as e:
    print(f"Error occurred: {str(e)}")
Now, to schedule this script with cron to run every day at 2 AM:
* * * * * /Users/dradecic/miniforge3/bin/python /Users/dradecic/Desktop/cron/fetch_api_data.py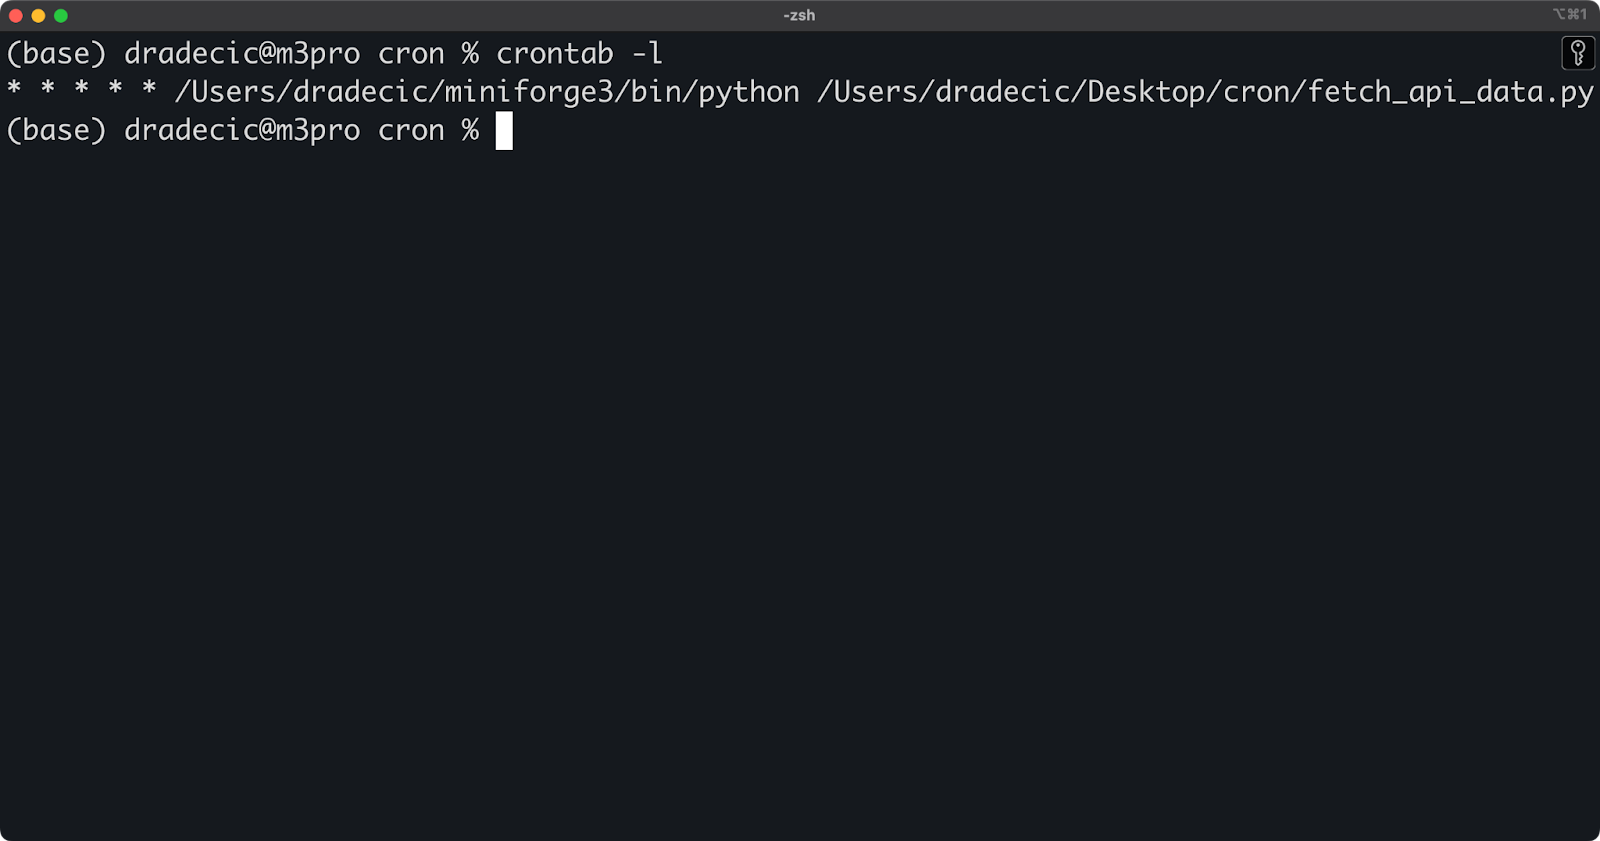
Image 2 - Listing active crontabs
This line tells cron to run your Python script every minute of every day. Make sure to use absolute paths for both the Python interpreter (/Users/dradecic/miniforge3/bin/python in my case) and your script (/Users/dradecic/Desktop/cron/fetch_api_data.py in my case).
Why absolute paths? Cron runs with a limited environment, so it doesn't know about your shell's PATH variable or your current directory. Your job might fail without absolute paths because cron cannot find the commands or files you want to use.
While you were reading this, a couple of CSV files were saved to my data folder, which indicates this cron job works as advertised:
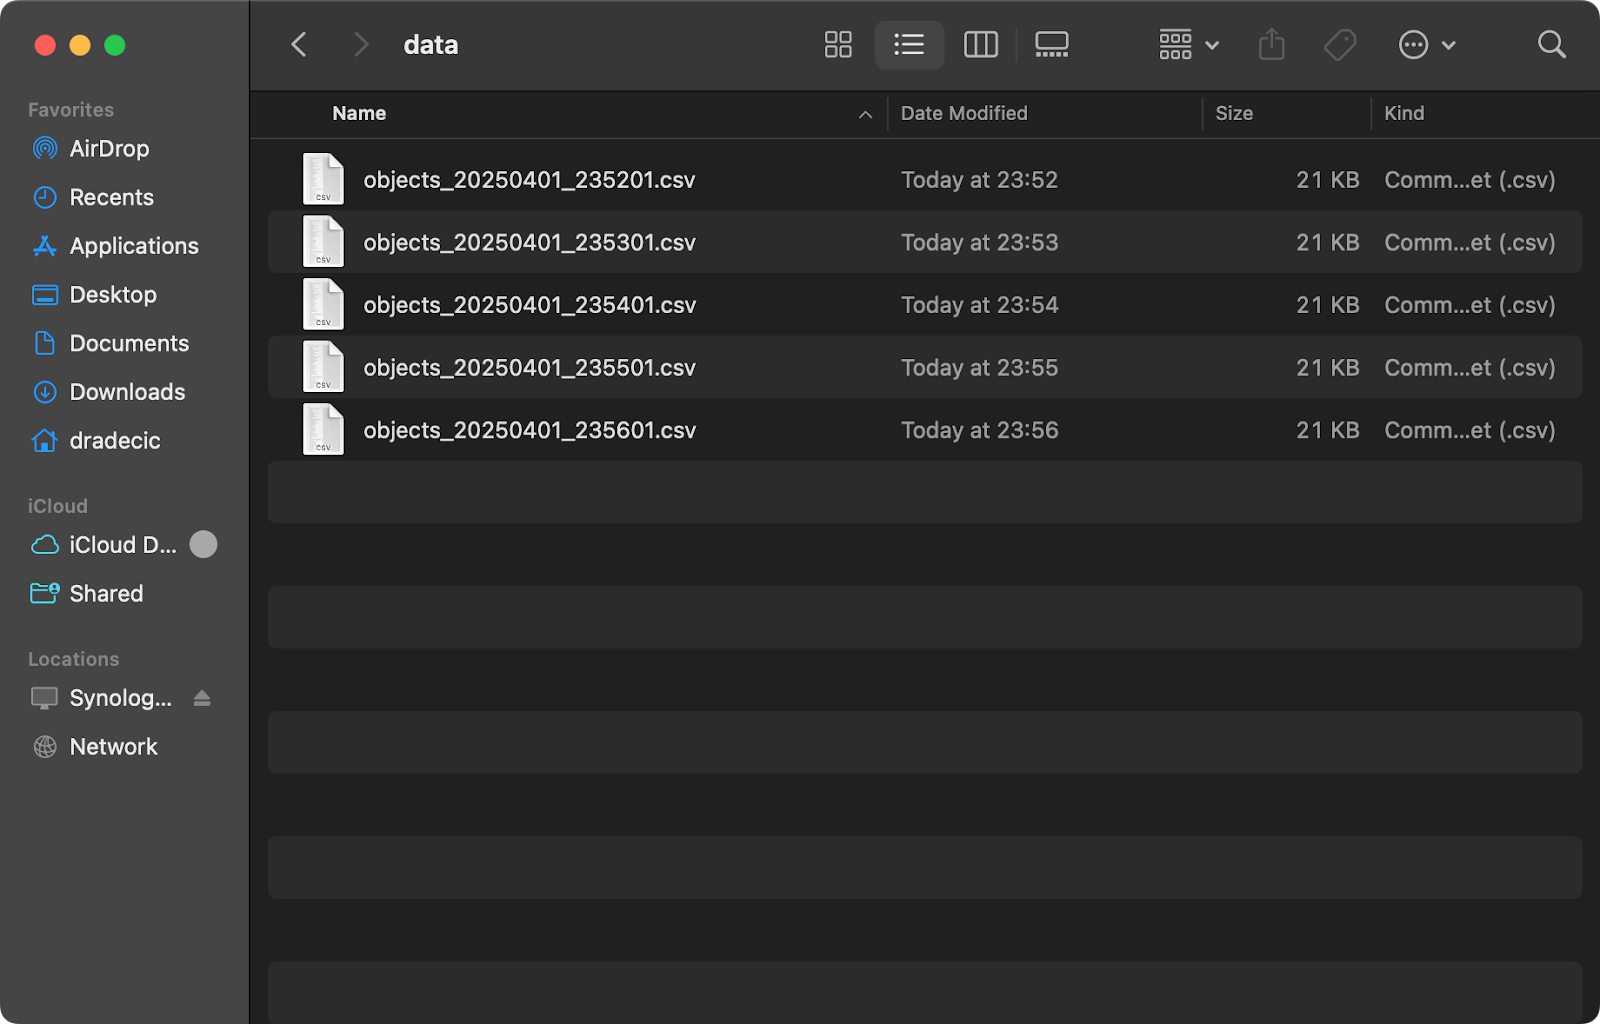
Image 3 - Saved CSV files
For more complex data engineering workflows like ETL (Extract, Transform, Load) jobs, you can use cron to schedule multi-step processes. A common approach is to create a shell script that contains all your ETL steps, then schedule that script with cron.
For the sake of simplicity, the code you'll see in the below .sh script is only theoretical and doesn't connect to any data sources:
#!/bin/bash
# etl_pipeline.sh

# Extract data from source
/usr/bin/psql -U username -d source_db -c "COPY (SELECT * FROM source_table) TO '/tmp/extracted_data.csv' WITH CSV HEADER;"

# Transform data
/usr/bin/python3 /home/username/scripts/transform_data.py

# Load data into target
/usr/bin/psql -U username -d target_db -c "\COPY target_table FROM '/tmp/transformed_data.csv' WITH CSV HEADER;"

# Log completion
echo "ETL job completed at $(date)" >> /home/username/logs/etl_job.log
Once that's out of the way, you'll want to make your shell script executable:
chmod +x /home/username/scripts/etl_pipeline.shFinally, schedule it with cron to run, let's say, every weekday at 1 AM:
0 1 * * 1-5 /home/username/scripts/etl_pipeline.shIf you're a data engineer, scheduling ETL tasks with cron offers these advantages:
For larger ETL processes, you might want to add error handling to your scripts:
#!/bin/bash
# etl_pipeline.sh

# Set error handling
set -e  # Exit immediately if any command fails

# Execute ETL steps
# ...

# If we get here, all steps succeeded
echo "ETL job completed successfully at $(date)" >> /home/username/logs/etl_job.log
And that's it! Your ETL pipeline will run automatically at the scheduled times, process your data, and log its status for monitoring purposes.
Once you set up your cron jobs, you need to manage and monitor them to make sure they run as expected.
By this, I mean checking what jobs are currently scheduled, removing outdated jobs, and monitoring their execution. This section will show you essential commands and techniques for maintaining your cron jobs hassle-free.
To see all your currently scheduled cron jobs, use the crontab -l command:
crontab -lThe above command displays your current crontab file content, showing all scheduled jobs, including their timing and commands. It's a quick way to verify what jobs are active without entering edit mode.
This is what your output will look like if you've followed the previous article section:
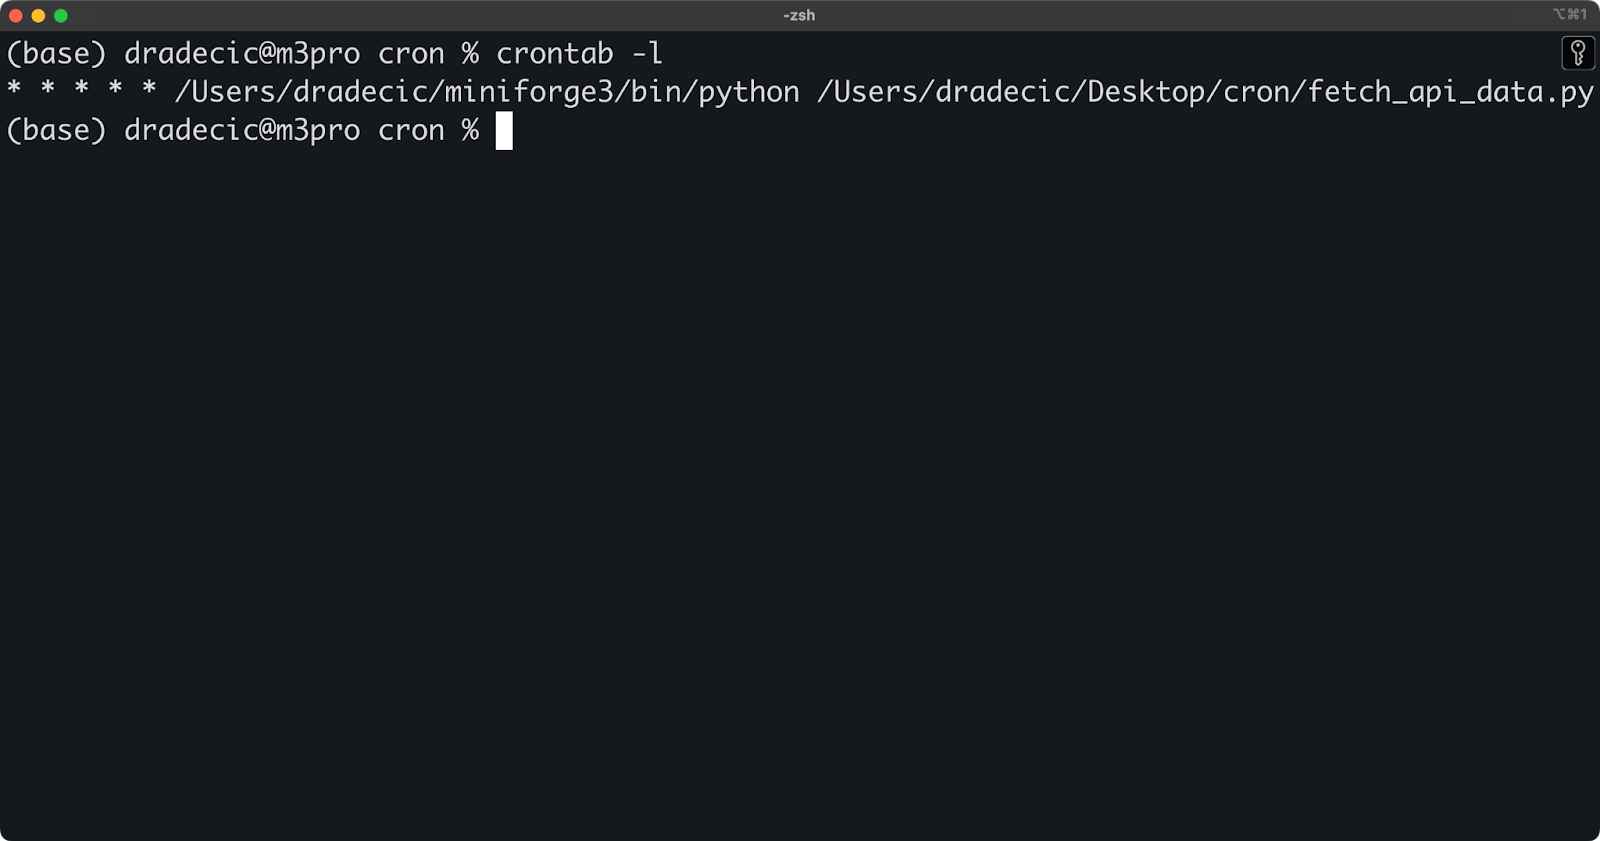
Image 4 - Active cron jobs
If you need to check cron jobs for another user (requires root access), run this command instead:
sudo crontab -u username -lThere are multiple ways to remove or disable cron jobs when no longer needed. To remove a specific job, open your crontab in edit mode and delete the corresponding line:
crontab -eTo disable a job temporarily without deleting it, comment out the line by adding a # at the beginning:
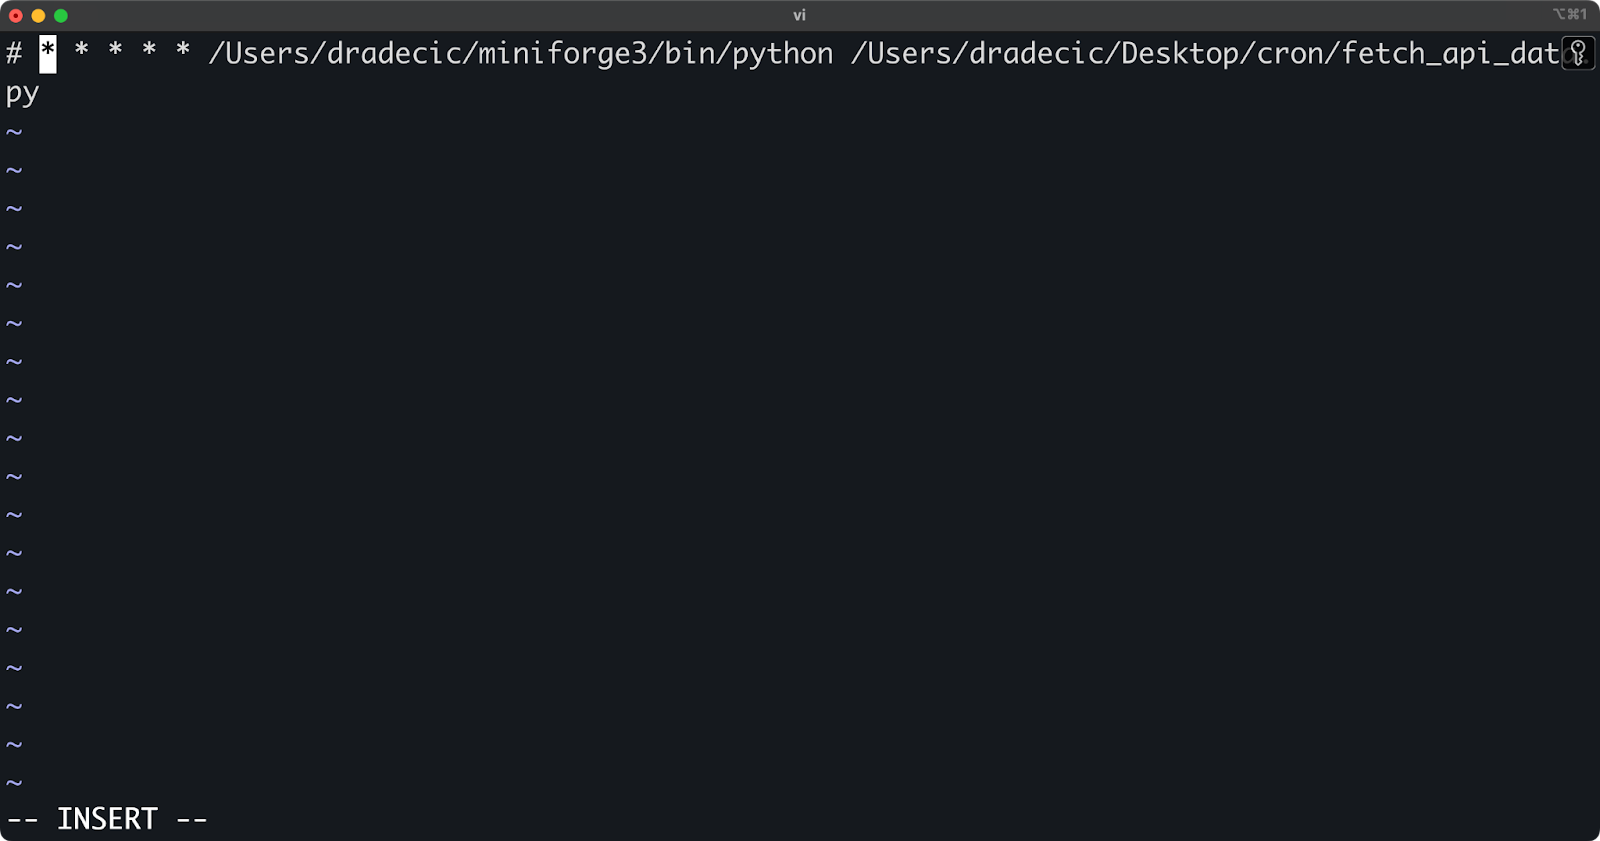
Image 5 - Temporarily disabling a cron job
The commented job remains in your crontab for future reference but won't be executed on the defined schedule.
If you want to remove your entire crontab (all jobs), use the -r option:
crontab -r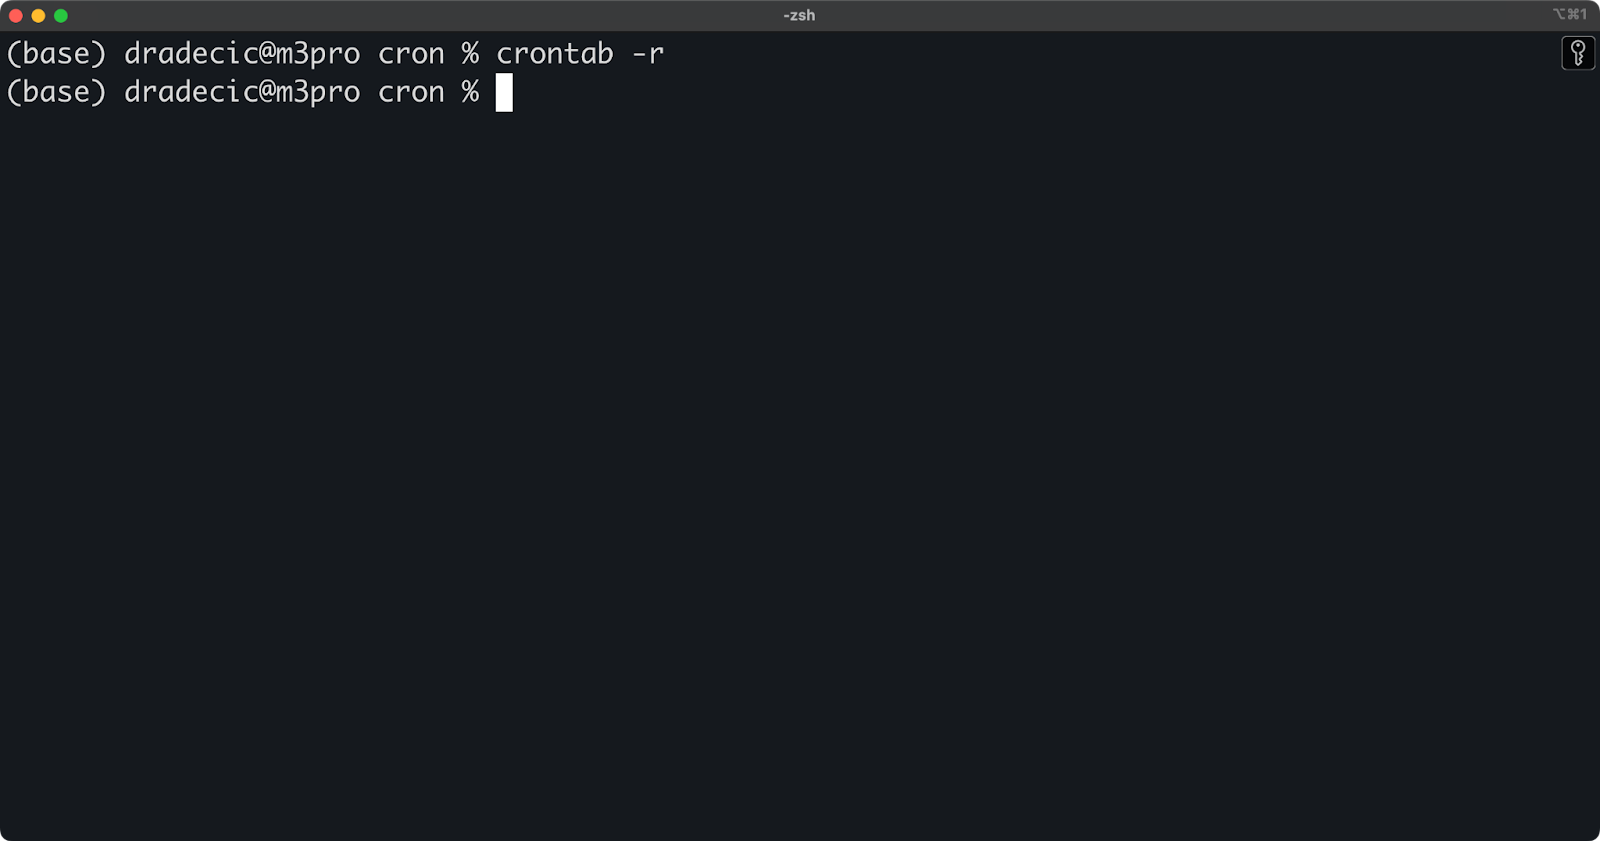
Image 6 - Deleting the entire crontab
Be careful with this command - it removes all your scheduled jobs without confirmation. To avoid accidental deletion, you can back up your crontab first:
crontab -l > my_crontab_backupThis saves your current crontab to a file that you can use to restore your jobs if needed:
crontab my_crontab_backup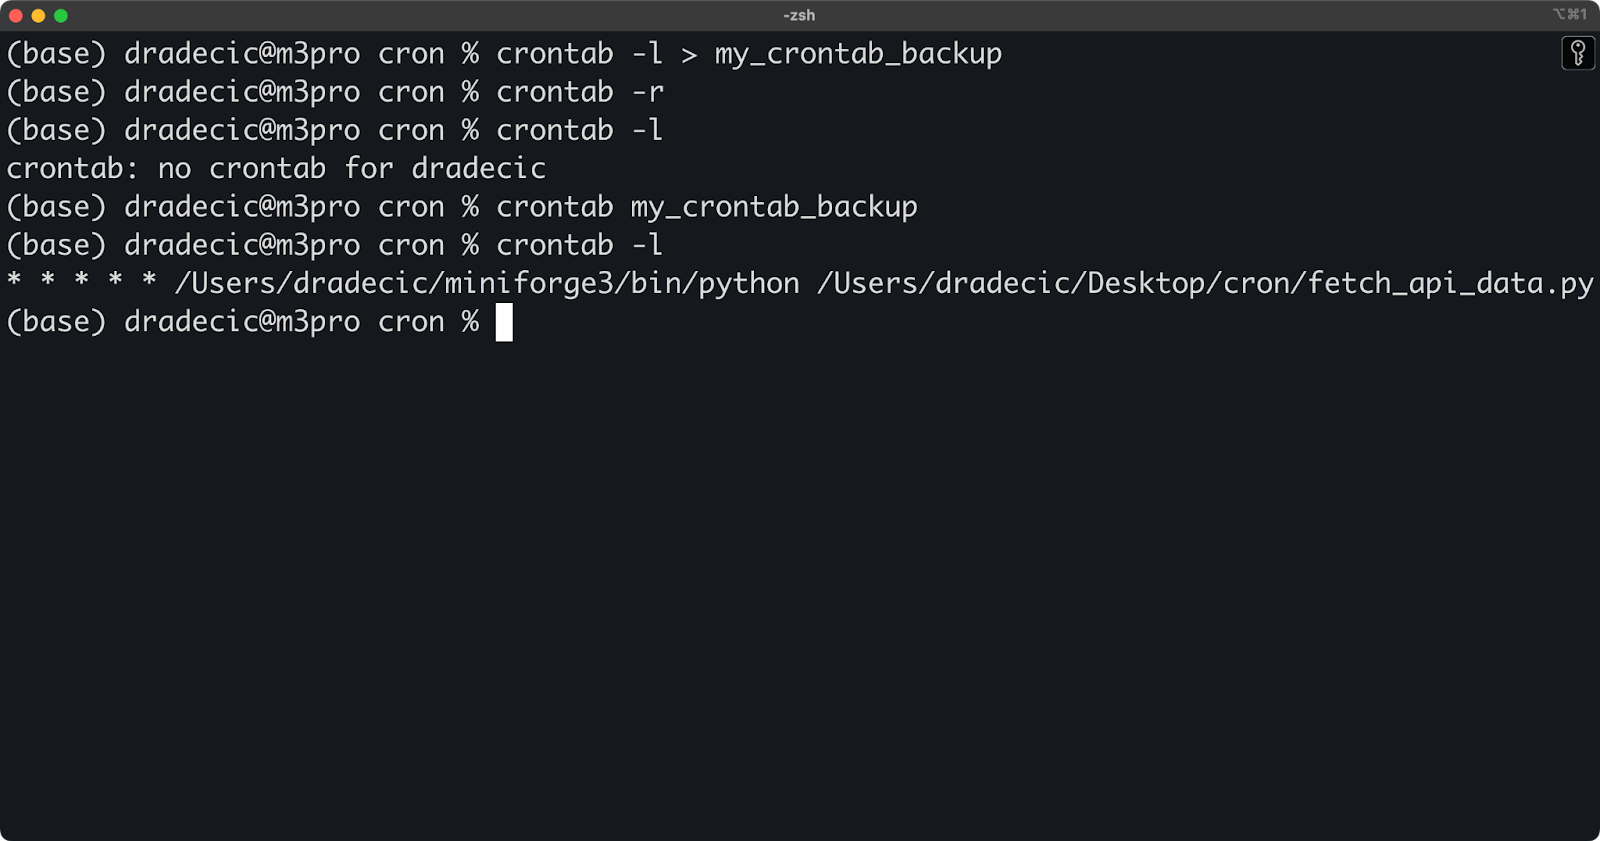
Image 7 - Restoring a crontab from a backup
By default, cron attempts to email the output of jobs to the user who owns the crontab. However, this requires a properly configured mail system, which isn't always available. Instead, you can redirect output to log files for easier tracking and troubleshooting.
To capture both standard output and error messages, use this redirection syntax:
* * * * * /Users/dradecic/miniforge3/bin/python /Users/dradecic/Desktop/cron/fetch_api_data.py >> /Users/dradecic/Desktop/cron/logs/api_fetch.log 2>&1This redirection might look intimidating at first, so let me break it down:
>> appends output to the specified file.2>&1 redirects stderr (error messages) to the same location as stdout (standard output).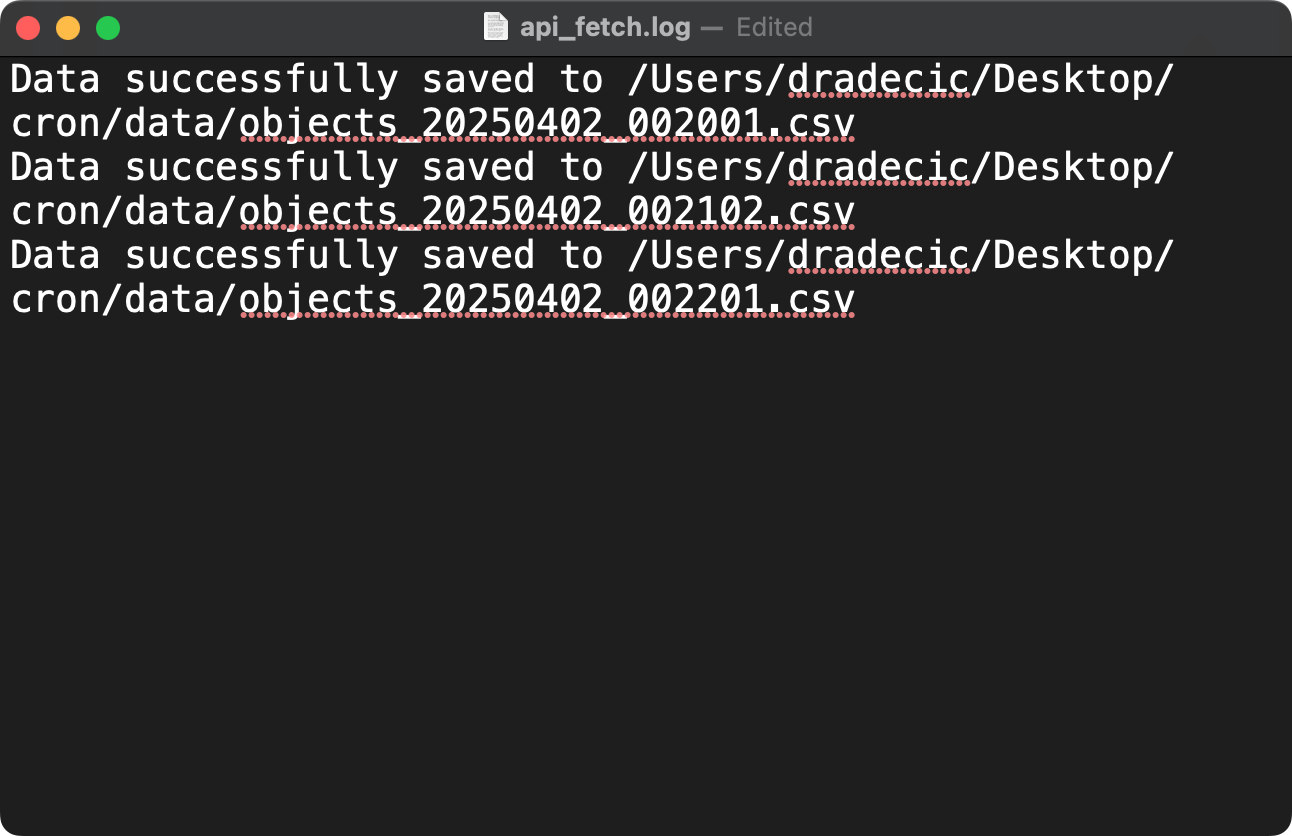
Image 8 - Capturing cron job logs
For better log management, you can add timestamps to your log entries:
* * * * * /Users/dradecic/miniforge3/bin/python /Users/dradecic/Desktop/cron/fetch_api_data.py >> /Users/dradecic/Desktop/cron/logs/api_fetch.log 2>&1 && echo "Job completed at $(date)" >> /Users/dradecic/Desktop/cron/logs/api_fetch.log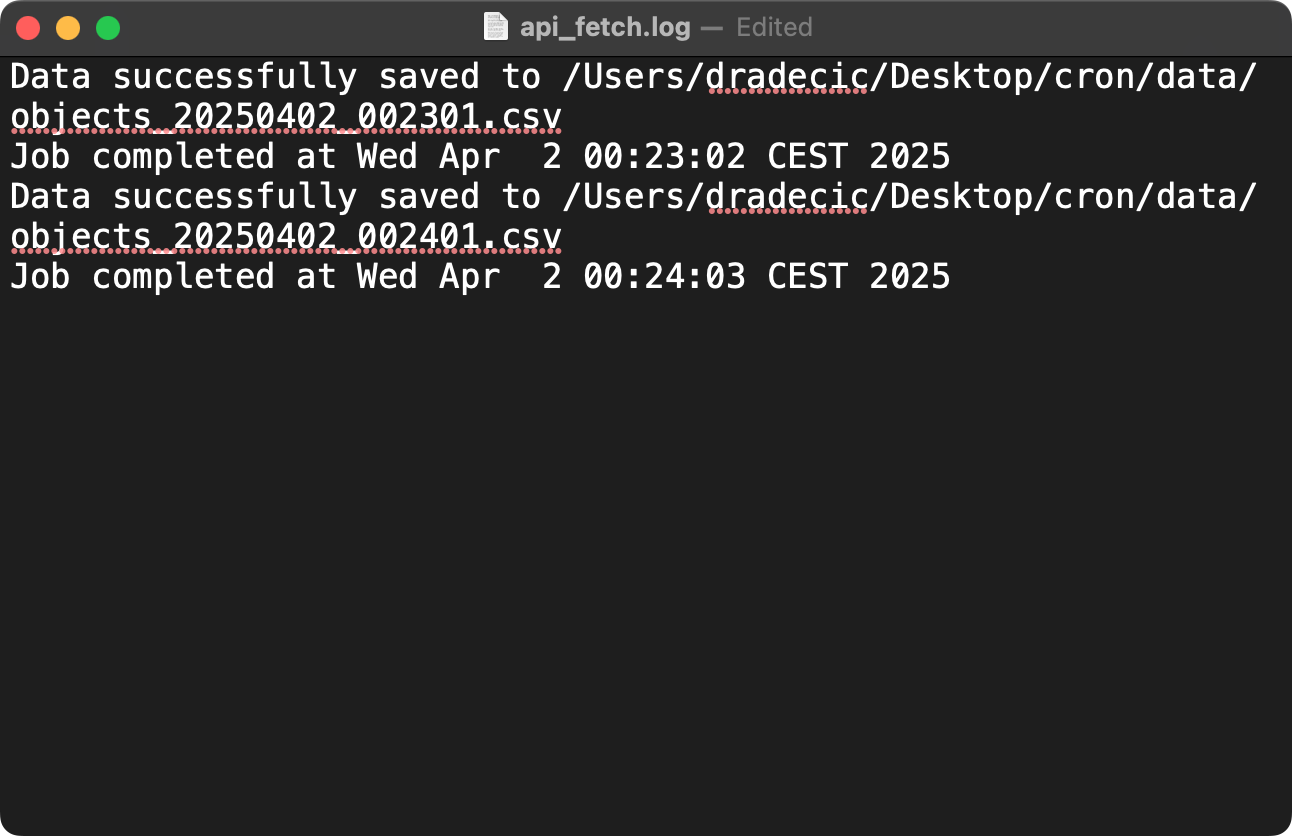
Image 9 - Capturing cron job logs with timestamps
If you want separate log files for normal output and errors, use:
* * * * * /Users/dradecic/miniforge3/bin/python /Users/dradecic/Desktop/cron/fetch_api_data.py >> /Users/dradecic/Desktop/cron/logs/api_fetch.log 2>> /Users/dradecic/Desktop/cron/logs/api_fetch_errors.log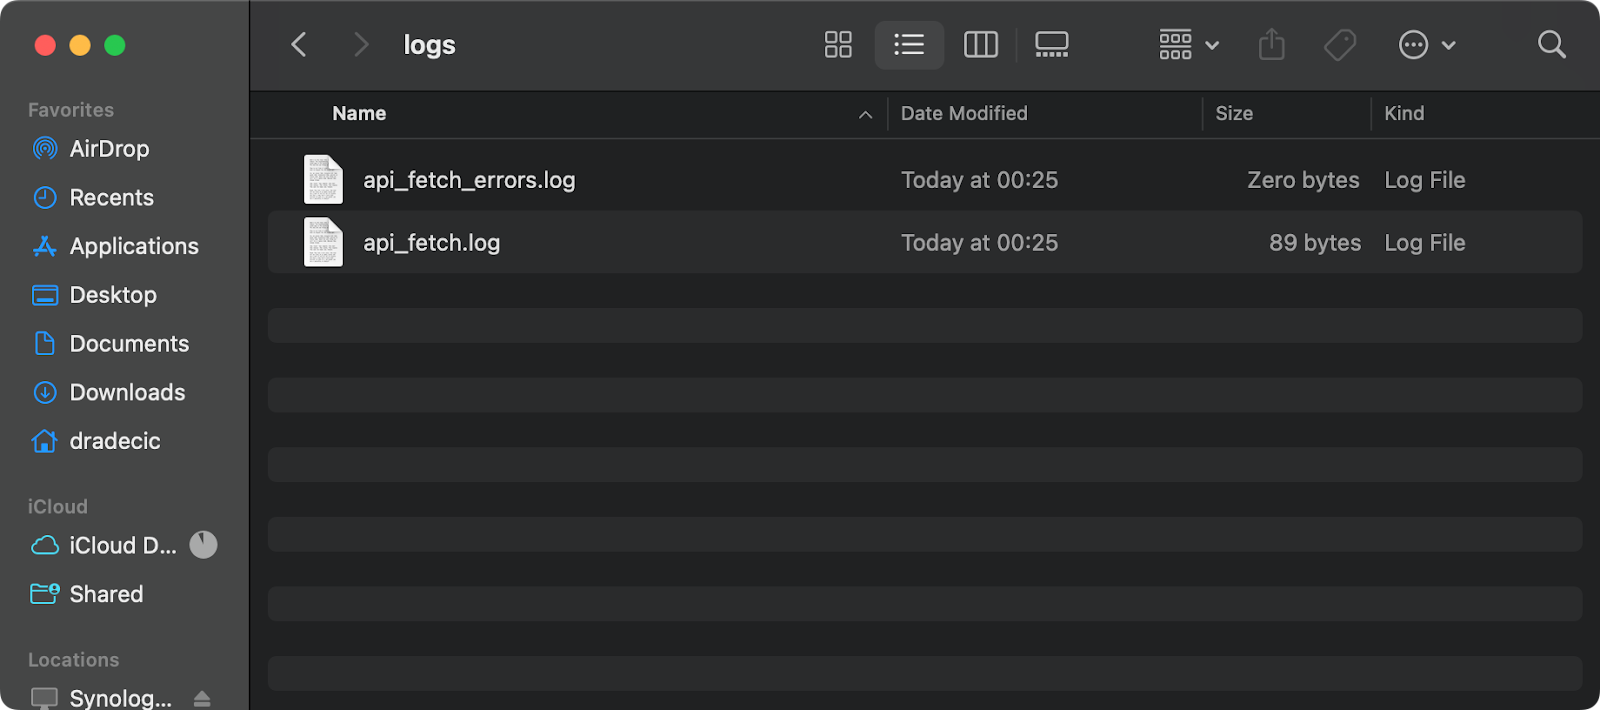
Image 10 - Cron job log and error files
For critical jobs that require notification of failure, you can set up email alerts. Assuming your system has a mail transfer agent installed (like postfix or sendmail), you can modify your cron job to send an email only if the job fails:
* * * * * /Users/dradecic/miniforge3/bin/python /Users/dradecic/Desktop/cron/fetch_api_data.py >> /Users/dradecic/Desktop/cron/logs/api_fetch.log 2>&1 || echo "API fetch failed on $(date)" | mail -s "Cron Job Failed" your-email@example.comThis uses the || operator, which means "run the mail command only if the previous command fails."
For “success” email notifications, use:
* * * * * /Users/dradecic/miniforge3/bin/python /Users/dradecic/Desktop/cron/fetch_api_data.py >> /Users/dradecic/Desktop/cron/logs/api_fetch.log 2>&1 && echo "API fetch completed successfully on $(date)" | mail -s "Cron Job Succeeded" your-email@example.comYou can also use more advanced monitoring tools like Prometheus with Node Exporter or dedicated cron monitoring services, but these simple logging and email techniques provide effective monitoring for most data engineering needs.
So far, you've learned the basic cron commands and patterns for capturing logs and errors. They're a good way to start, but for production use cases, you'll want to explore more advanced commands and integration with container technologies.
In this section, you'll see how to level up your cron job implementation for more sophisticated data engineering workflows.
You can chain multiple commands in a single cron job to create complex workflows without needing separate shell scripts.
There are several ways to combine commands.
You can use semicolons to run commands sequentially regardless of whether previous commands succeed:
* * * * * cd /path/to/data && python3 extract.py; python3 transform.py; python3 load.pyOr you can use && to run commands only if the previous command succeeds (stops at first failure):
* * * * * cd /path/to/data && python3 extract.py && python3 transform.py && python3 load.py >> /path/to/logs/etl.log 2>&1Alternatively, opt for || to run a command only if the previous command fails (error handling):
* * * * * python3 /path/to/critical_job.py || python3 /path/to/send_alert.py "Critical job failed"For more complex command chaining, you can use parentheses to group commands:
* * * * * (cd /path/to/data && python3 extract.py && echo "Extraction complete") && (python3 transform.py && echo "Transform complete") >> /path/to/logs/etl.log 2>&1This approach works well for simpler multi-step workflows. However, a dedicated shell script is still the better option for very complex pipelines with many steps, conditional logic, or error handling.
Docker containers have become essential in modern data engineering stacks. You can integrate cron with Docker in several powerful ways to ensure your scheduled tasks run in consistent, isolated environments.
To demonstrate, I'll slightly change the fetch_api_data.py script to have dedicated directories for fetching data and logs and change the paths so the script can work in a container environment:
# fetch_api_data.py

import requests
import pandas as pd
import os
import uuid
from datetime import datetime

# Set file paths
data_dir = "/app/data"
log_dir = "/app/logs"
output_file = f"{data_dir}/objects_{str(uuid.uuid4())}.csv"

# Make sure the data directory exists
os.makedirs(data_dir, exist_ok=True)
os.makedirs(log_dir, exist_ok=True)


def log_message(message):
    print(f"{datetime.now().isoformat()}: {message}")


# Fetch data from the API
try:
    log_message("Starting API data fetch")
    response = requests.get("https://jsonplaceholder.typicode.com/posts")
    if response.status_code == 200:
        data = response.json()

        # Check if we have data
        if data:
            df = pd.DataFrame(
                [
                    {
                        "id": row.get("id", ""),
                        "user_id": row.get("userId", ""),
                        "title": row.get("title", ""),
                        "body": row.get("body", ""),
                    }
                    for row in data
                ]
            )

            df.to_csv(output_file, index=False)

            log_message(f"Data successfully saved to {output_file}")
        else:
            log_message("API returned empty data")
    else:
        log_message(f"API request failed with status code: {response.status_code}")
except Exception as e:
    log_message(f"Error occurred: {str(e)}")
So, both the fetch data and logs will be saved to /app/runs folder.
The next step is to create a Dockerfile - a single file that instructs Docker how to build and run the container:
FROM python:3.12-slim

# Install cron and required packages
RUN apt-get update && apt-get -y install cron \
    && pip install requests pandas \
    && rm -rf /var/lib/apt/lists/*

# Set up directories
WORKDIR /app
RUN mkdir -p /app/runs/data /app/runs/logs

# Copy our script
COPY fetch_api_data.py /app/

# Make the script executable
RUN chmod +x /app/fetch_api_data.py

# Create the crontab file
RUN echo "* * * * * root /usr/local/bin/python /app/fetch_api_data.py >> /app/runs/logs/api_fetch.log 2>&1" | tee /etc/cron.d/api-cron
RUN chmod 0644 /etc/cron.d/api-cron

# Create a startup script
RUN echo '#!/bin/sh' > /app/start.sh && \
    echo 'mkdir -p /app/runs/logs' >> /app/start.sh && \
    echo 'touch /app/runs/logs/api_fetch.log' >> /app/start.sh && \
    echo 'tail -f /app/runs/logs/api_fetch.log &' >> /app/start.sh && \
    echo 'cron -f' >> /app/start.sh
RUN chmod +x /app/start.sh

# Set entry point
CMD ["/app/start.sh"]
Almost there. You can now run the following command to build the image and run the Docker container
docker build --no-cache -t api-cron-job . && \
docker run --rm --name api-fetcher api-cron-job
If you connect to the container, you'll see that the Python script is being executed every minute:
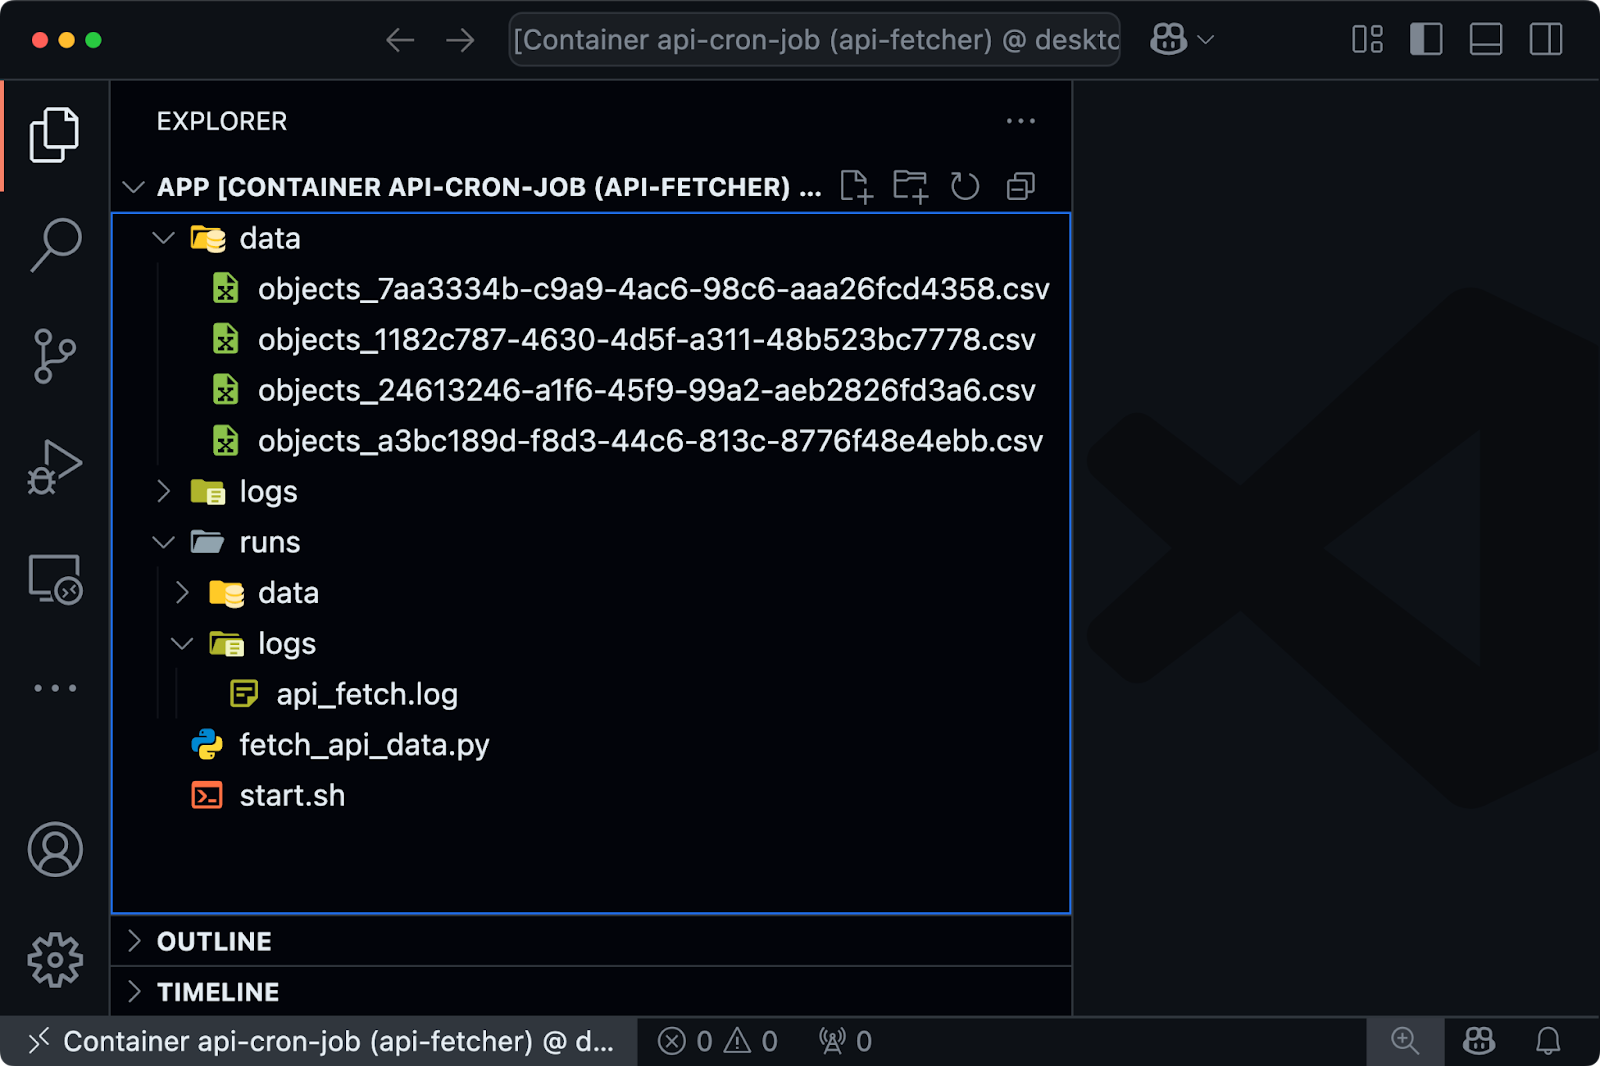
Image 11 - Cron job running in Docker container
On the other hand, if you're looking for a way to run a data engineering pipeline in a Docker container on a cron schedule, keep the fetch_api_data.py script unchanged, but modify the Dockerfile:
# Use Python 3.12 slim as base image
FROM python:3.12-slim

# Install required Python packages
RUN pip install --no-cache-dir requests pandas

# Set working directory
WORKDIR /app

# Copy the script into the container
COPY fetch_api_data.py /app/

# Set execution permissions
RUN chmod +x /app/fetch_api_data.py

# Run the script
CMD ["/usr/local/bin/python", "/app/fetch_api_data.py"]
Then add the following to the crontab file on your system:
*/2 * * * * cd /path/to/root/project/folder && docker build --no-cache -t api-cron-job . && docker run --rm --name api-fetcher api-cron-jobThis will trigger the build and run the container every 2 minutes.
For distributed data engineering workflows, you often need to execute processes on remote servers. Cron jobs can trigger these remote operations using SSH.
For example, you can run a command like this one to run a cron job on a remote server:
0 5 * * * ssh username@remote-server 'python3 /path/to/remote_job.py' >> /path/to/logs/remote_job.log 2>&1For this to work without password prompts, you need to set up SSH key-based authentication between servers.
To transfer data between servers on a schedule, use the following cron job:
0 6 * * * scp /path/to/local/data.csv username@remote-server:/path/to/destination/ >> /path/to/logs/data_transfer.log 2>&1For more complex remote operations, you can combine SSH with shell scripts:
#!/bin/bash
# remote_etl.sh

# Run extraction on the data source server
ssh username@source-server 'python3 /path/to/extract.py'

# Transfer the extracted data to the processing server
scp username@source-server:/path/to/extracted_data.csv /local/temp/

# Run transformation locally
python3 /path/to/transform.py

# Transfer the transformed data to the warehouse server
scp /local/temp/transformed_data.csv username@warehouse-server:/path/to/data/

# Trigger the load process on the warehouse server
ssh username@warehouse-server 'python3 /path/to/load.py'
And then simply schedule it with cron:
0 7 * * * /path/to/remote_etl.sh >> /path/to/logs/remote_etl.log 2>&1This approach lets you orchestrate multi-server data pipelines directly from your cron jobs. It works, but you might want to consider specialized orchestration tools like Apache Airflow or Prefect for very complex distributed workflows.
Even the most well-designed cron jobs can fail or cause issues if not implemented with proper operational practices.
As a data engineer, you need to make sure your scheduled tasks run reliably, fail gracefully, and provide enough visibility for troubleshooting. I'll show you how to go about it in this section.
Logging is crucial for automated processes that run without direct supervision. Without them, diagnosing issues with cron jobs becomes nearly impossible.
To set up basic logging, you can redirect both standard output and error messages to log files:
* * * * * /Users/dradecic/miniforge3/bin/python /Users/dradecic/Desktop/cron/fetch_api_data.py >> /Users/dradecic/Desktop/cron/logs/script.log 2>&1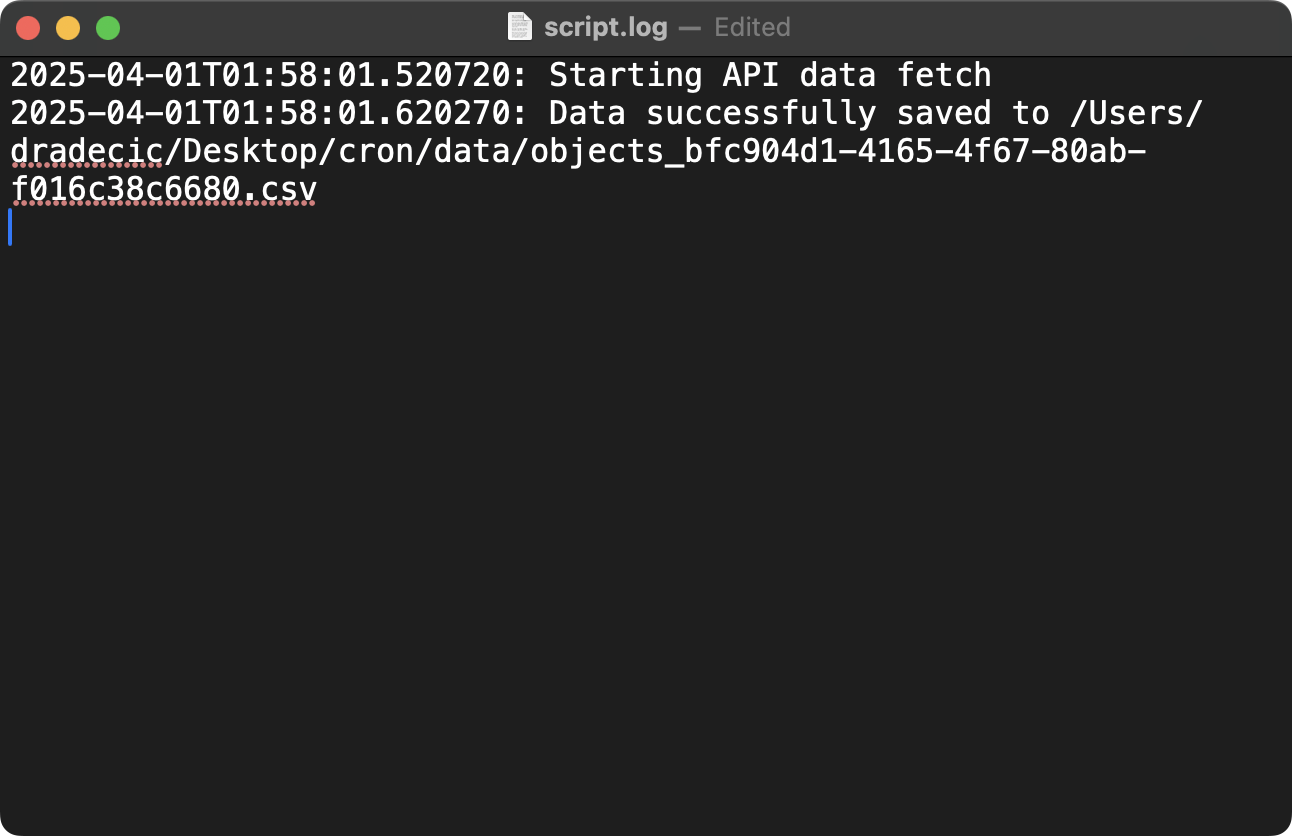
Image 12 - Cron job logging configuration (1)
This command runs your script every minute and appends all output to a log file. The >> operator appends output instead of overwriting it, while 2>&1 redirects both standard error (file descriptor 2) and standard output (file descriptor 1) to the same log file.
For more structured logging, you can add timestamps and job identifiers:
* * * * * (echo "=== Job started at $(date) ==="; /Users/dradecic/miniforge3/bin/python /Users/dradecic/Desktop/cron/fetch_api_data.py; echo "=== Job finished at $(date) with exit code $? ===") >> /Users/dradecic/Desktop/cron/logs/script.log 2>&1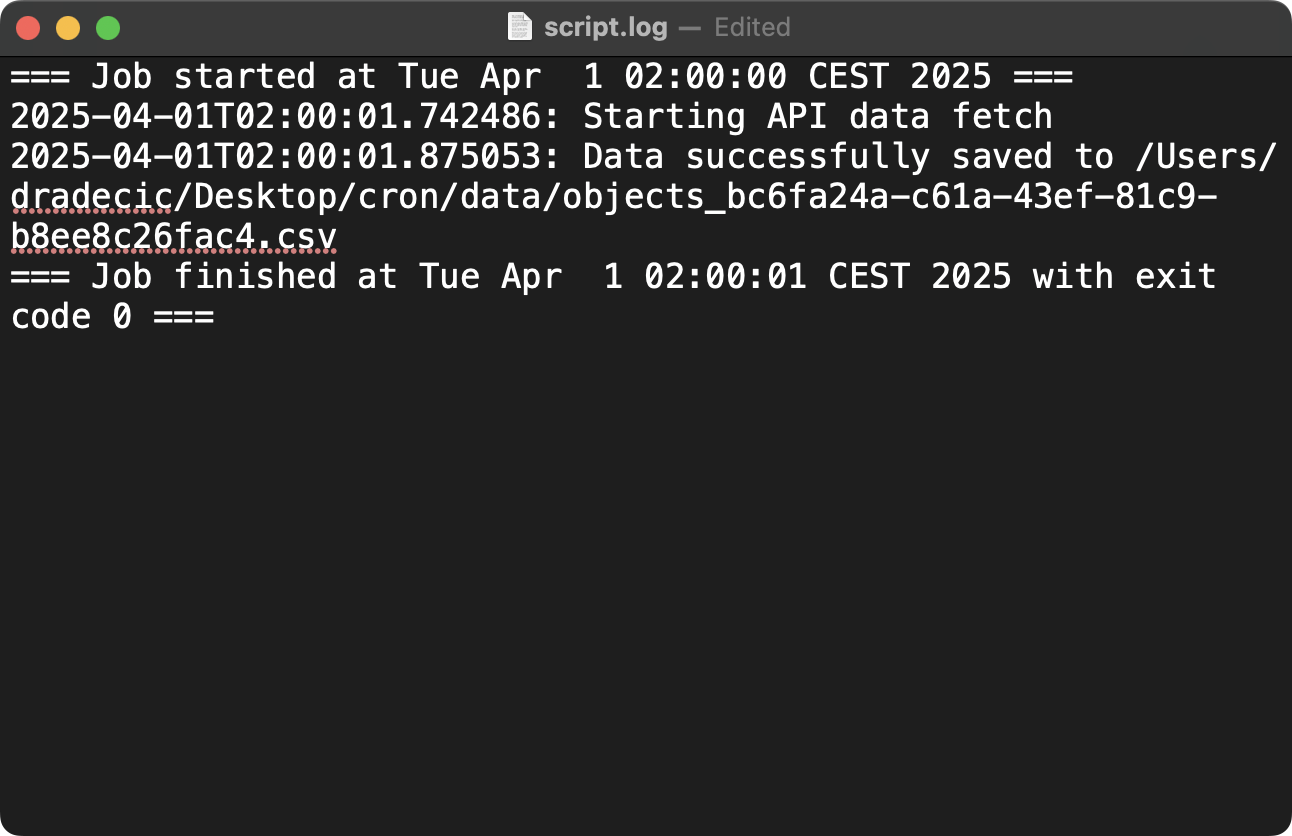
Image 13 - Cron job logging configuration (2)
This enhanced command adds a clear start marker with a timestamp before running your script and an end marker with both timestamp and exit code after completion. The parentheses group these commands together so all their output gets redirected to the log file. The $? variable contains the exit code of the most recently executed command, which helps you determine if the script succeeded (exit code 0) or failed (non-zero exit code).
To prevent logs from consuming excessive disk space, you can implement log rotation. Use the logrotate utility, which is available on most Linux distributions:
Create a configuration file at /etc/logrotate.d/cron-jobs:
/path/to/logs/*.log {
    daily
    missingok
    rotate 14
    compress
    delaycompress
    notifempty
    create 0640 username groupname
}
This configuration tells the system to:
daily)missingok)rotate 14)compress)delaycompress)notifempty)create 0640 username groupname)The system's logrotate service automatically applies these settings, typically running once per day. When it runs, it renames your current log file (adding a date suffix), compresses older logs, deletes logs older than 14 days, and creates a fresh log file for new entries.
Robust data engineering workflows need strategies for handling failures. You can integrate retry logic to your scripts or cron jobs, or connect your cron jobs to monitoring systems.
I'll show you how to implement all of these options in this section.
Built-in retry logic can be implemented directly in your Python scripts, such as this one:
import time
import random

def fetch_data_with_retry(max_attempts=3, backoff_factor=1.5):
    attempt = 1
    while attempt <= max_attempts:
        try:
            # Try to fetch data
            return fetch_data()
        except Exception as e:
            print(f"Attempt {attempt} failed: {str(e)}")
            # Calculate backoff time with jitter
            backoff_time = backoff_factor ** (attempt - 1) * (random.uniform(0.8, 1.2))
            if attempt < max_attempts:
                print(f"Retrying in {backoff_time:.2f} seconds...")
                time.sleep(backoff_time)
            else:
                print("Max retry attempts reached. Giving up.")
                raise
        attempt += 1
This Python function implements an exponential backoff strategy with jitter. Here's how it works:
max_attempts times (default 3).This pattern is ideal for handling transient failures like network issues or API rate limits. The exponential increase in wait time gives the external system time to recover, while the jitter prevents "thundering herd" problems.
Cron-based retries are also a viable option. You can retry failed jobs by scheduling them more frequently than needed.
Here's an example in which I set up two cron jobs:
success_flag file is created which prevents the script from running again in 10 minutes.*/10 * * * * [ ! -f /path/to/success_flag ] && python /path/to/script.py && touch /path/to/success_flag
0 0 * * * rm -f /path/to/success_flag The above setup might be difficult to understand, so let me walk you through the steps once again:
[ ! -f /path/to/success_flag ])/path/to/script.py)touch /path/to/success_flag)0 0 * * *) and removes the success flag, allowing the process to run again the next day.This technique is useful for tasks that must be completed once per day but might fail temporarily. The job keeps trying throughout the day until it succeeds once.
Monitoring integration allows you to connect your cron jobs to monitoring systems, such as Prometheus. This is a topic for itself, so I'll only provide a high-level overview here.
The script you'll see below is a wrapper around your actual job that collects and reports metrics to Prometheus. Here are the steps the script makes:
#!/bin/bash
# monitored_job.sh

# Define pushgateway URL
PUSHGATEWAY="http://prometheus-pushgateway:9091"

# Start time in seconds
START_TIME=$(date +%s)

# Run the actual job
/path/to/actual_job.sh
EXIT_CODE=$?

# End time in seconds
END_TIME=$(date +%s)
DURATION=$((END_TIME - START_TIME))

# Push metrics to Prometheus
cat <<EOF | curl --data-binary @- ${PUSHGATEWAY}/metrics/job/cron_job/instance/$(hostname)
# HELP cron_job_duration_seconds How long the cron job took to execute
# TYPE cron_job_duration_seconds gauge
cron_job_duration_seconds{name="data_extraction"} ${DURATION}

# HELP cron_job_exit_code Exit code of the cron job
# TYPE cron_job_exit_code gauge
cron_job_exit_code{name="data_extraction"} ${EXIT_CODE}

# HELP cron_job_last_run_timestamp Timestamp of last job run
# TYPE cron_job_last_run_timestamp gauge
cron_job_last_run_timestamp{name="data_extraction"} ${END_TIME}
EOF

exit ${EXIT_CODE}
These metrics enable you to:
The Pushgateway acts as a middleman, allowing the short-lived cron job to push its metrics to Prometheus, which then stores them for alerting and visualization.
Time zone issues are common challenges in data engineering, especially when dealing with global data sources or distributed systems.
As you would expect, cron jobs are sensitive to time zone settings.
By default, cron uses the system's local time zone. You can check your system's time zone with this Linux command:
timedatectlThe above command shows your system's current time and time zone configuration. If your server is configured to use a local time zone like America/New_York, all cron schedules will be interpreted in that time zone.
To ensure consistent scheduling regardless of server location or daylight saving time changes, use UTC for your cron jobs:
# Set the CRON_TZ environment variable at the top of your crontab
CRON_TZ=UTC

# Now all job schedules will use UTC
0 0 * * * /path/to/daily_job.sh
By adding the CRON_TZ=UTC line at the top of your crontab file, you tell cron to interpret all time specifications in UTC rather than local time.
This means the job will run at midnight UTC every day, regardless of the server's local time zone or daylight saving time changes. UTC (Coordinated Universal Time) never changes for daylight saving, providing a consistent reference point across all locations.
If you're a data engineer, cron jobs are an invaluable tool.
They can help you automate repetitive tasks and build reliable data pipelines. They provide a consistent and powerful way to schedule scripts and perform complex orchestration of multi-step ETL processes. The syntax takes some getting used to, but it'll become second nature after a couple of days.
As you implement cron jobs in your data engineering work, remember to follow best practices around logging, error handling, and time zone management. Proper logging gives you visibility into job execution and simplifies troubleshooting. Good error handling techniques with retry mechanisms ensure your pipelines can recover from transient failures. Careful time zone management keeps your schedules consistent, especially when working with global data sources or distributed teams.
>Looking to get hired as a Data Engineer in 2025? These are 5 essential skills you must have.
Sure, specialized workflow orchestration tools like Apache Airflow or Prefect offer more advanced features for complex data pipelines, but cron still remains relevant for many data engineering tasks. It's simple to use, reliable, and low overhead—all of which make it perfect for automation needs.
To learn more about data engineering, enroll in these courses by DataCamp:
Our certification programs help you stand out and prove your skills are job-ready to potential employers.
Learn more about data engineering with these courses!
Course
Course
Course
blog
Jake Roach
12 min
blog
Alena Guzharina
3 min
Tutorial
Amberle McKee
Tutorial
Jake Roach
Tutorial
Allan Ouko
code-along
Jake Roach