Course
Mastering the tools of data analytics without understanding the concepts behind it is like having a toolbox of screwdrivers but not knowing when and how to use each screwdriver. Statistics is important to learn because the rise of AI-generated and AI-assisted analysis tools will make technical skills less of a competitive edge in favor of knowledge comprehension and critical understanding.
I invite you not to be intimidated by the complexity of statistics. This article aims to present a comprehensive guide for the most relevant statistical concepts for data analysts and data scientists through 35 statistics interview questions and answers. Whether you are preparing for an interview or not, I’m sure you will find these questions informative.
Finally, before we get started, consider taking our Introduction to Statistics in R course to learn the fundamentals, including how to perform statistical analyses and interpret results. Also, if you are actively preparing for an interview that requires statistical understanding, the following two DataCamp courses cover all the most frequently covered statistical topics: Practicing Statistics Interview Questions in Python and Practicing Statistics Interview Questions in R.
Basic Statistics Interview Questions
Most, if not all, data analytics jobs require a basic understanding of statistics, including descriptive statistics, inferential statistics, and probability. If you are brushing up on your descriptive statistics before an interview, download our Descriptive Statistics Cheat Sheet for easy reference. Also, if you want to work through some calculations and methods, check out the following DataCamp tutorials to go through relevant concepts in more detail:
- A Comprehensive Guide to Calculating Frequency Distributions in Excel
- A Comprehensive Guide to Calculating Skewness in Excel
- How to Create and Customize a Box and Whisker Plot in Excel
1. What are standard deviation and variance?
Variance and standard deviation both measure the dispersion or spread of a dataset. Variance is the average of the squared differences from the mean. It gives a sense of how much the values in a dataset differ from the mean. However, because it uses squared differences, the units are squared as well, which can be less intuitive than the standard deviation. Standard deviation is the square root of the variance, bringing the units back to the same as the original data. It provides a more interpretable measure of spread. For example, if the variance of a dataset is 25, the standard deviation is √25 = 5.
2. What is skewness?
Skewness measures the asymmetry of a dataset around its mean, which can be positive, negative, or zero. Data with positive skewness, or right-skewed data, has a longer right tail, meaning the mean is greater than the median. Data with negative skewness, or left-skewed data, has a longer left tail, meaning the mean is less than the median. Zero skewness indicates a symmetric distribution, like a normal distribution, where the mean, median, and mode are equal.
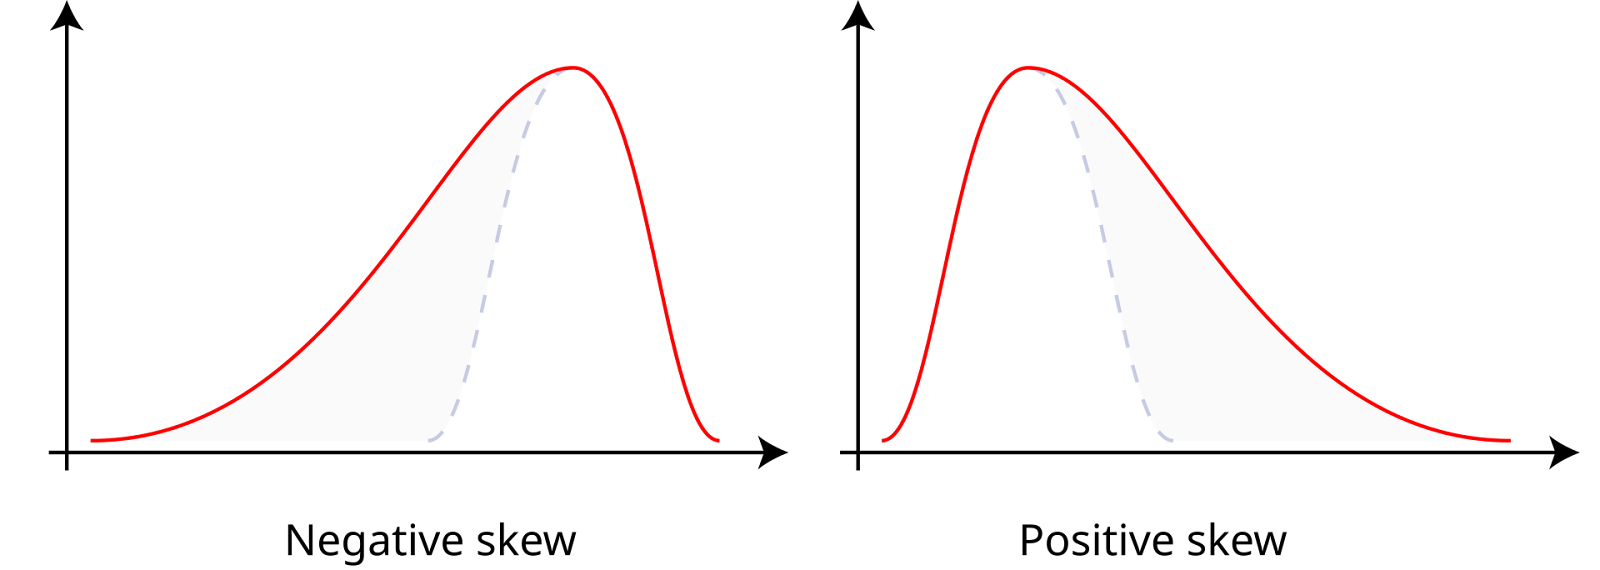
Positive and negative skewness. Source: Wikiversity.
3. What is a histogram?
A histogram is a graphical representation of the distribution of a dataset. It divides the data into bins (intervals) and shows the frequency (or count) of data points within each bin. Histograms are used to understand the underlying frequency distribution (shape) of a set of continuous data. They help identify patterns such as skewness, modality (number of peaks), and the presence of outliers.
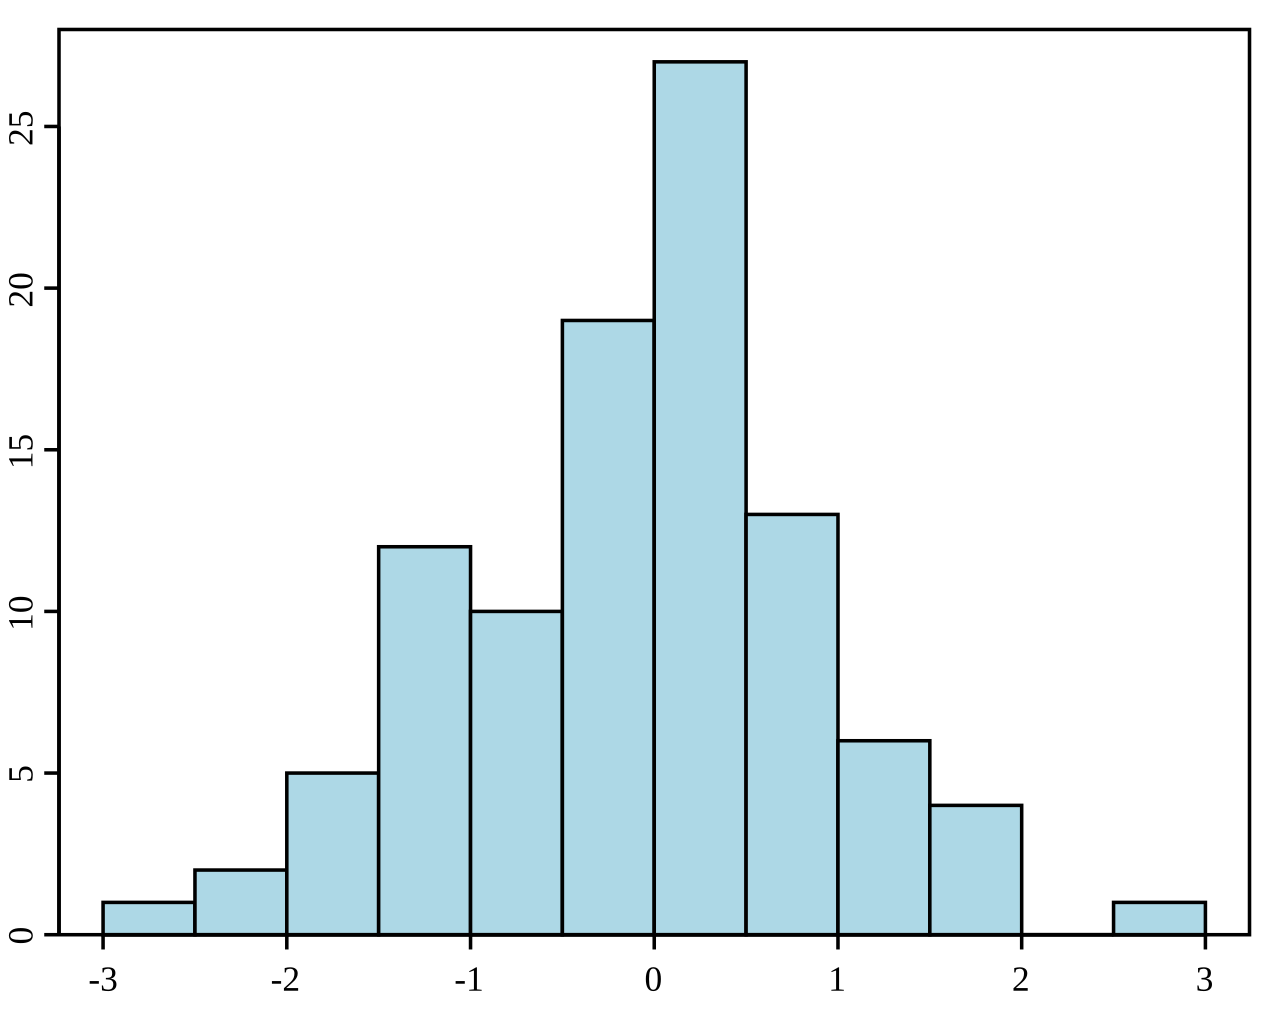
Example of a histogram. Source: Wikipedia.
4. What is the difference between descriptive and inferential statistics?
Inferential statistics involves making predictions or inferences about a population based on a random sample of data taken from that population. It uses various methods to estimate population parameters, test hypotheses, and make predictions. While descriptive statistics summarize and describe the features of a dataset, inferential statistics use the data to make generalizations and draw conclusions about a larger population.
5. What are the different types of sampling methods?
Different sampling methods are used to ensure samples are representative and random. Simple random sampling gives every member of the population an equal chance of being selected. Systematic sampling involves selecting every k-th member of the population, starting from a randomly chosen point. Stratified sampling divides the population into strata or subgroups, with random samples taken from each stratum. Cluster sampling divides the population into clusters, randomly selecting some clusters and sampling all members within them.
6. What is the central limit theorem?
The central limit theorem states that the sampling distribution of the sample mean will approach a normal distribution as the sample size increases, regardless of the population's distribution, provided the samples are independent and identically distributed.
7. What are joint, marginal, and conditional probabilities?
Marginal probability refers to the probability of a single event occurring, regardless of other events, denoted as P(A) for event A. Joint probability is the probability of two events occurring together, represented as P(A∩B) for events A and B. Conditional probability is the probability of an event occurring given that another event has occurred, expressed as P(A|B) for events A and B.
8. What is a probability distribution?
A probability distribution describes how the values of a random variable are distributed. It provides a function that maps the outcomes of a random variable to their corresponding probabilities. There are two main types of probability distributions. One is the discrete probability distribution for discrete random variables, such as the binomial distribution or the Poisson distribution. The other is the continuous probability distribution for continuous random variables, such as the normal distribution or the exponential distribution.
9. What is the normal distribution?
The normal distribution, also known as the Gaussian distribution, is a continuous probability distribution characterized by its bell-shaped curve, which is symmetric about the mean. With normal distributions, the mean is, therefore, equal to the median. Also, it’s known that about 68% of the data falls within one standard deviation of the mean, 95% within two standard deviations, and 99.7% within three standard deviations. This is known as the 68-95-99.7 Rule.
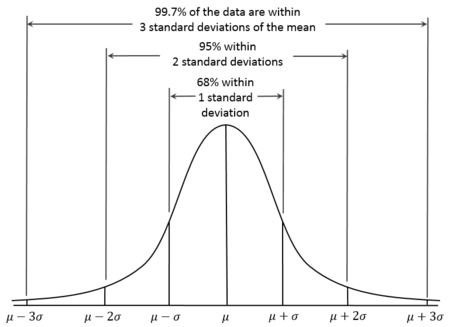
Normal distribution curve. Source: Wikiversity.
10. What is a binomial distribution?
The binomial distribution is a discrete probability distribution that models the number of successes in a fixed number of independent Bernoulli trials, each with the same probability of success. It is used when there are exactly two possible outcomes (success and failure) for each trial. For example, it can be used to model the number of heads in a series of coin flips.
11. What is a Poisson distribution?
The Poisson distribution is a discrete probability distribution that models the number of events occurring within a fixed interval of time or space, where the events occur independently and at a constant average rate. It is appropriate to use when you want to model the count of rare events, such as the number of emails received in an hour or the number of earthquakes in a year.
Intermediate Statistics Interview Questions
For intermediate statistics roles, focus on hypothesis testing, intervals estimation, and regression modeling. If, as you read through these questions, you feel unconfident with some of the concepts, you can turn to DataCamp resources. You can learn hypothesis testing through the Hypothesis Testing in Python and Hypothesis Testing in R courses. You can also master regression techniques with the following courses and tutorials:
- Introduction to Regression in R course
- Essentials of Linear Regression in Python tutorial
- Introduction to Regression with statsmodels in Python course
12. What is a p-value?
A p-value is the probability of obtaining a test statistic at least as extreme as the one observed, assuming the null hypothesis is true. It is used in hypothesis testing to determine the significance of the test result. If the p-value is less than or equal to the chosen significance level (α), we reject the null hypothesis. If the p-value is greater than α, we fail to reject the null hypothesis.
13. What are Type I and Type II errors?
Type I errors in hypothesis testing occur when the null hypothesis is true, but we incorrectly reject it, resulting in a false positive. The probability of making a Type I error is the same as the significance level. Type II errors occur when the null hypothesis is false, but we fail to reject it, leading to a false negative.
14. What is the difference between parametric and non-parametric tests?
Parametric tests assume data follows a specific distribution, like normal, and require certain population parameters, making them ideal when these assumptions are met. Some examples of parametric tests that I commonly use are the t-test, Z-test, and ANOVA. Non-parametric tests do not assume a specific distribution and are used when data does not meet parametric assumptions, especially with small samples. Many people are familiar with these tests, but they don't necessarily identify them as non-parametric. I've used the Chi-Square test, Mann-Whitney U test, Wilcoxon Signed-Rank Test, and the Kruskal-Wallis test, to name a few.
15. What is regression?
Regression analysis is a statistical method used to examine the relationship between one dependent variable and one or more independent variables. It helps in understanding how the dependent variable changes when any one of the independent variables is varied, while the other independent variables are held constant.
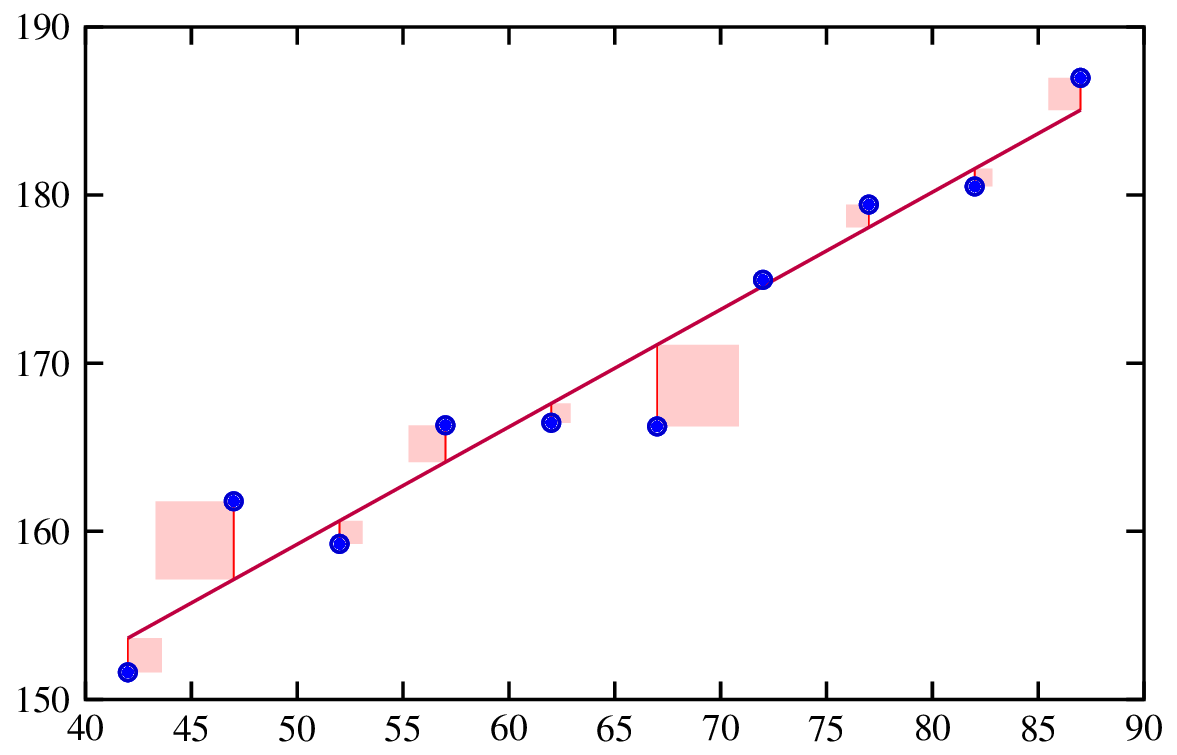
Fitting a regression line. Source: Risk Engineering.
16. What are residuals?
Residuals are the differences between the observed values and the predicted values from a regression model. They are important because analyzing residuals helps in checking the assumptions of our model, as well as to check the overall fit of the model.
17. How do you interpret the coefficients in a linear regression model?
In a linear regression model, each coefficient represents the expected change in the dependent variable for a one-unit change in the corresponding independent variable, holding all other variables constant. For example, if the coefficient of an independent variable 𝑥𝑖 is 2, it means that for each one-unit increase in 𝑥𝑖 the dependent variable y is expected to increase by 2 units, assuming other variables remain unchanged.
18. What is a confidence interval?
A 95% confidence interval means that if we were to take many samples and calculate a confidence interval for each sample, about 95% of these intervals would contain the true population parameter. We could also say that we are 95% confident that the parameter value lies in the estimated interval.
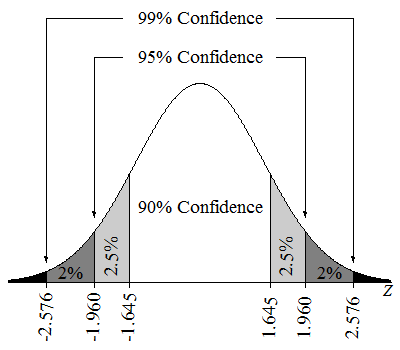
Confidence intervals on a Z-distribution. Source: Lumen Learning.
19. What is multicollinearity?
Multicollinearity occurs when two or more independent variables in a multiple regression model are highly correlated. It is a problem because it can make the coefficient estimates unstable and difficult to interpret. High multicollinearity can also inflate the standard errors of the coefficients, leading to less reliable statistical tests.
20. What is regularization?
Regularization techniques are a powerful technique for treating multicollinearity in regression models. They are also used to prevent overfitting by adding a penalty to the model for having large coefficients. This helps in creating a more generalizable model. Common regularization techniques include Lasso and Ridge Regression.
Advanced Statistics Interview Questions
If I were preparing for an interview that required an advanced understanding of statistics, I would make sure to study Bayesian statistics and machine learning.
For Bayesian statistics, explore our courses: Bayesian Data Analysis in Python and Fundamentals of Bayesian Data Analysis in R. For machine learning, check out DataCamp career tracks or courses on machine learning, including our Machine Learning Scientist with Python career track and our Understanding Machine Learning course.
21. What is Bayesian statistics?
Bayesian statistics involves the use of Bayes' theorem to update the probability of a hypothesis as more evidence or information becomes available. It combines prior beliefs with new data to form a posterior probability.
22. What is Markov Chain Monte Carlo?
Markov Chain Monte Carlo is a class of algorithms used to sample from a probability distribution when direct sampling is difficult. It is important in Bayesian statistics because it allows for the estimation of posterior distributions, especially in complex models where analytical solutions are not feasible.
23. What is the bias-variance tradeoff?
The bias-variance tradeoff in machine learning involves balancing two error sources. Bias is the error from overly simplistic model assumptions, causing underfitting and missing data patterns. Variance is the error from excessive sensitivity to training data fluctuations, causing overfitting and capturing noise instead of true patterns.
24. What is causal inference?
Causal inference is an important idea that has been getting a lot of attention. Causal inference is the process of determining whether and how one variable (the cause) directly affects another variable (the effect), which is a distinguishing characteristic between causal inference and mere correlation. Causal inference is really a group of methods that aims to establish a cause-and-effect relationship in order to understand if something is working, like an intervention or treatment of some kind. If a researcher needs to understand if a drug is working, for example, causal inference can help answer the question.
25. What is structural equation modeling?
Structural Equation Modeling is a technique for analyzing relationships among what are called observed and latent variables. It is kind of like a mix between multiple regression and factor analysis. Structural equation modeling requires multiple steps, like model specification, estimation, and then evaluation. SEM is known to be flexible but it requires large sample sizes and, in order to use it, you will. need a strong theoretical foundation.
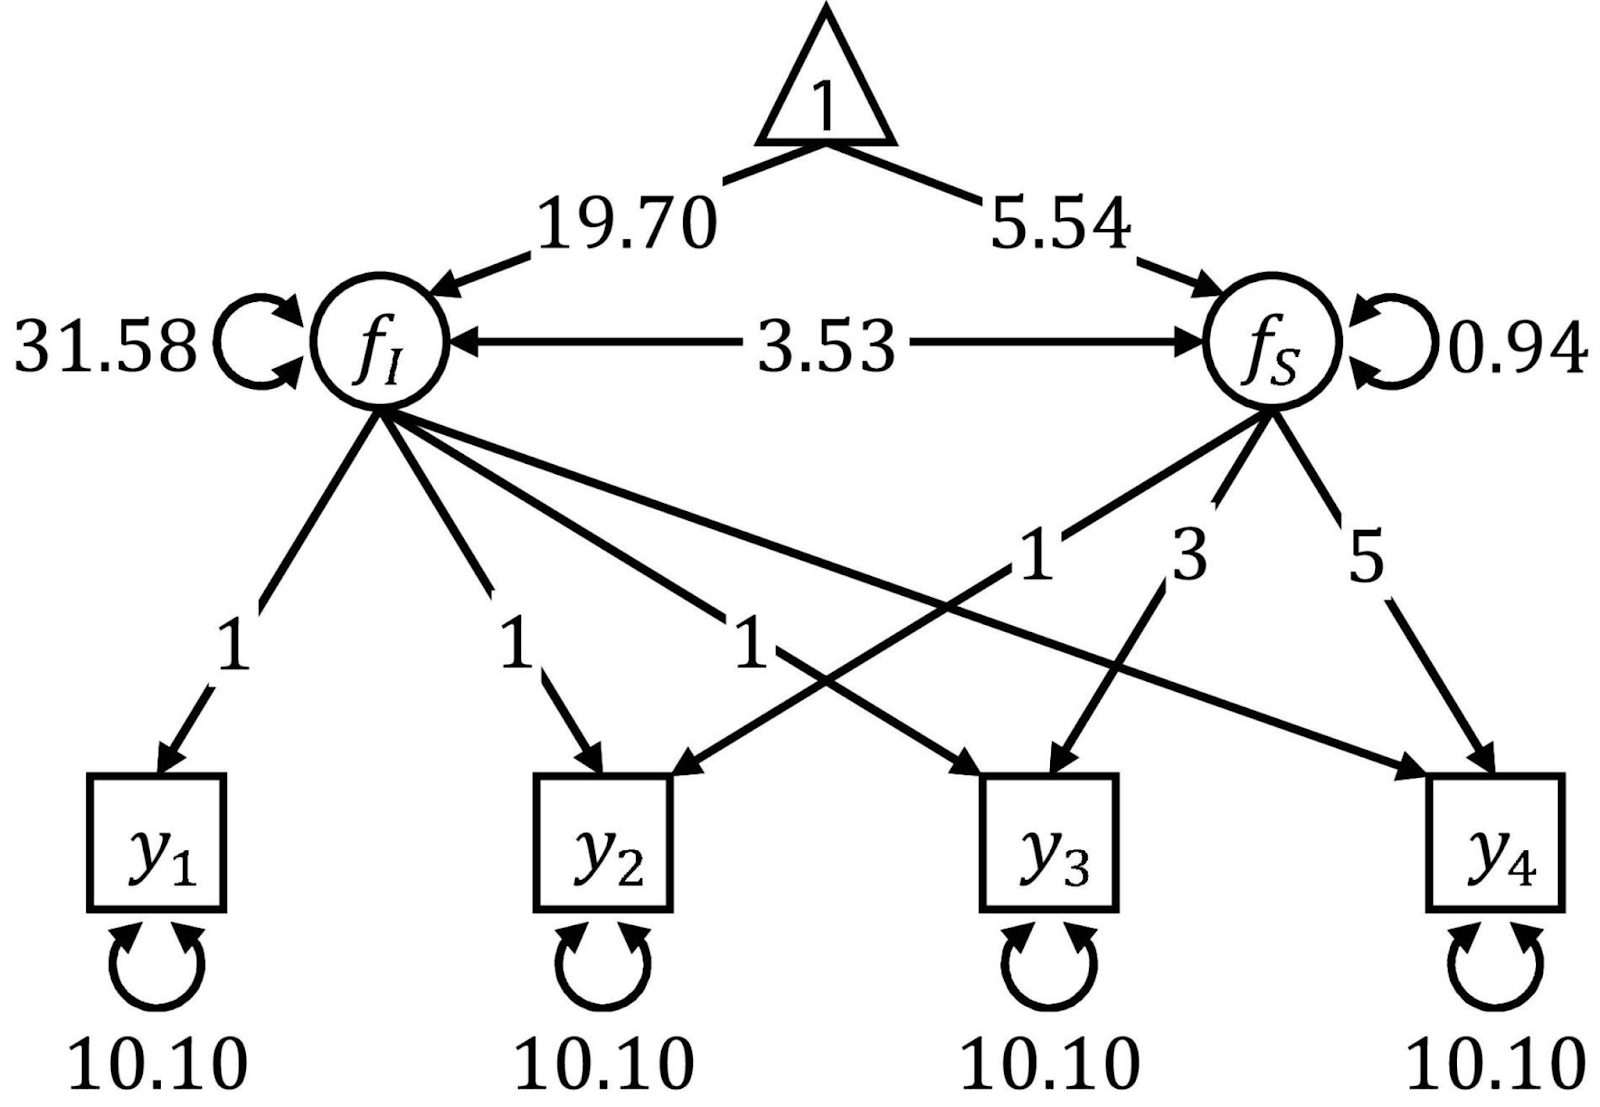
Path diagrams are often used to visualize SEM. Source: Frontiers.
Data Science Statistics Interview Questions
You will find the following questions helpful if you are going for a role that is more focused on the intersection of data science and statistics. Topics here include data preprocessing and cleaning, A/B testing and experimental design, time series forecasting, and advanced statistical techniques.
If you find yourself shaky on these concepts and you are serious about improving your interview process, take these DataCamp resources on A/B testing: A/B Testing in Python course or A/B Testing in R course. Then, to master time series analysis, choose between the Time Series with R or Time Series with Python skill tracks to get experience.
26. Why do we do a train/test split?
Splitting data into training and test sets helps us evaluate the model's performance on unseen data. The training set is used to train the model, while the test set is used to assess how well the model generalizes to new data. This practice helps in detecting overfitting and ensures that the model can perform well on real-world data.
27. Can you explain overfitting and underfitting?
Overfitting occurs when a model learns both the underlying patterns and the noise in the training data, leading to excellent performance on training data but poor performance on new, unseen data. Underfitting happens when a model is too simple to capture the underlying patterns in the data, resulting in poor performance on both the training data and new data.

Overfitting and underfitting. Source: Wikipedia.
28. What are the different types of missingness in data?
Understanding the mechanism of missingness (MCAR, MAR, MNAR) is crucial because it guides the choice of appropriate methods for handling missing data. Using improper techniques can introduce bias, reduce the validity of the results, and lead to incorrect conclusions. For example, simple imputation methods may be suitable for MCAR data, while more sophisticated techniques like multiple imputation or model-based methods may be necessary for MAR or MNAR data to produce unbiased estimates.
29. When is it best to remove missing values?
Removing missing values can be appropriate when the proportion of missing data is very small, typically less than 5%. Also, it’s a good idea when the missing data are MCAR (Missing Completely at Random), meaning the missingness does not introduce bias. Finally, I would consider removing missing values if the dataset is large enough that deleting a small number of rows does not significantly impact the analysis.
30. What are the advantages of different imputation methods?
Each imputation method has its pros and cons. For example, mean/median/mode imputation is easy to implement but can introduce bias and distort relationships between variables. K-nearest neighbors (KNN) imputation considers relationships between variables and can lead to more accurate results, but it can be computationally expensive.
31. What is A/B testing?
A/B testing is a method used in experimental design to compare two versions of a variable, such as a webpage, app feature, or marketing campaign, to determine which one performs better. It is a highly relevant topic and it appears in the ‘required’ section of many job descriptions.
32. How can you detect seasonality in a time series?
Seasonality is one of the time series components, besides trend and residuals (noise). To detect seasonality, we can first visually inspect the time series through a line plot. If the presence of seasonality is suspected, we can proceed to implement a decomposition of the time series to find the size of the seasonal effect.
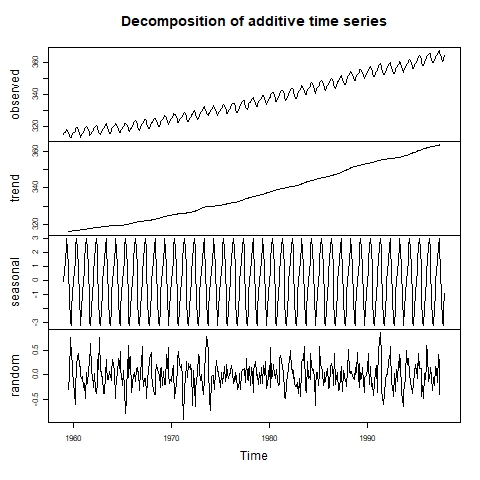
Time series visually decomposed. Source: Lab of Environmental Informatics.
33. What is the difference between exponential smoothing and ARIMA models?
Exponential Smoothing models use weighted averages of past observations for simple, short-term forecasting. ARIMA models combine autoregression, differencing, and moving average components, making them more complex but suitable for both short-term and long-term forecasting, especially with complex patterns and significant autocorrelations.
34. What is cross-validation?
Cross-validation is a technique for assessing how a machine learning model will generalize to an independent dataset. It involves dividing the data into several folds and performing multiple rounds of training and validation.
Behavioral and Soft Skills Interview Questions
Since perfecting the statistics and the analysis results is not complete without communicating the outcome to business stakeholders, assisting soft skills is vital for employers hiring for data roles, especially since communicating insights from statistics is never easy.
35. How do you communicate statistical insights to non-technical stakeholders?
To effectively communicate with different stakeholders, I adjust my style based on their backgrounds and interests. For example, for executives, I prioritize business impact, using business language and visuals to facilitate quick decision-making. On the other hand, for developers, I provide technical details. In both cases, I make sure that the concepts involved are relevantly clear and accessible, and I encourage questions and feedback. This approach ensures that each stakeholder group receives the information they need in a format that resonates with them.
Final Thoughts
Learning statistics for data analytics roles can be challenging. Many people come into the field from various backgrounds that do not necessarily involve much or any statistical knowledge. Most of the resources available online encourage learners to focus only on the tools, overlooking the vital importance of statistics.
To further enhance your knowledge and career opportunities, consider exploring additional resources and courses. For a detailed guide on how to become a statistician, check out our blog post, How to Become a Statistician, which offers valuable insights. You can complement this with our Statistician with R career track. Take time to test your intuition with the Probability Puzzles in R course. If you prefer Python, our Statistics Fundamentals with Python skill track is a great option.
Best of luck in your upcoming interviews!

Islam is a data consultant at The KPI Institute. With a journalism background, Islam has diverse interests, including writing, philosophy, media, technology, and culture.
Statistics Interview FAQs
Do you have to know a programming language to do statistics?
Knowing a programming language is not required to do statistics, but it can greatly enhance your efficiency and ability to handle large datasets. Certain advanced techniques, like machine learning and data visualization, are only available in programming environments like R and Python, making these skills highly valuable.
What are the types of statistics?
Statistics has several main branches: Descriptive statistics summarize data, inferential statistics make predictions from samples (using both frequentist and Bayesian approaches), and Bayesian statistics update probabilities with new evidence.
Are some statistical methods more popular now than they used to be?
Yes, certain statistical methods have gained popularity in recent years due to advancements in technology, such as machine learning and Bayesian statistics. There have also been many advances in time series analysis and non-parametric methods.
How can I prepare for a statistics interview for a data science role?
Preparing for a statistics interview involves reviewing common interview questions, understanding key statistical concepts, and practicing with real-world data problems. DataCamp courses and tutorials will be very helpful.


