
Track
Data Analyst in R
36 hr
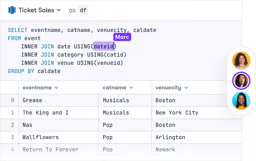
Skip the installation process and experiment with data science code in your browser with DataLab, DataCamp's AI-powered notebook.
With the above factors in mind, here is the list of the top 9 data analytics tools for data analysts.
Ranked first in popularity indices for several programming languages, Python is a must-have tool for data analysts. Python is an open-source and extremely versatile programming language with broad applicability in the data science industry and other disciplines, like web development and video game development. You can read more about what Python is used for in a separate post.
Python can perform any data science task. This is mainly thanks to its rich ecosystem of libraries. With thousands of powerful packages backed by its huge community of users, Python can perform all kinds of operations, from data preprocessing, visualization, and statistical analysis to deploying machine learning and deep learning models.
Due to its simple and readable syntax, Python is often referred to as one of the easiest programming languages to learn for beginners.
However, when it comes to processing massive amounts of data, other programming languages and solutions, such as Julia or Spark, can offer better performance and efficiency than Python.
If you want to be a Python expert, DataCamp is here to help. You will find many Python courses for all levels in our course catalog. Check out our Data Analyst with Python Career Track and prepare for your Python learning journey.

Though not as trending as Python, R is still a top option for data analysts. Frequently portrayed as the main competitor of Python, learning one (or both) of these two languages is a critical step to becoming a data analyst. Check out our Python vs R comparison for more details.
R is an open-source, domain-specific language explicitly designed for data science and advanced computing. Very popular in finance and academia, R is a perfect language for data manipulation, processing, visualization, statistical computing, and machine learning.
R has a large community of users and a vast collection of specialized libraries for data analysis and machine learning. Some of the most notable ones belong to the Tidyverse family, a collection of data science packages. It includes dplyr for data manipulation and the powerful ggplot2, the standard library for data visualization in R.
Compared to Python, beginners may find R more difficult and less versatile. Yet, if you are new to data science or want to add new languages to your arsenal, learning R is a perfect choice. Check out our rich catalog of R courses, including our popular Introduction to R Course, to sharpen your skills today. You can also follow our Data Analyst with R career track.
Much of the world's data is stored in databases. SQL (Structured Query Language) is a domain-specific language that allows programmers to communicate with, edit, and extract data from databases. A solid database and SQL knowledge is a must if you want to become a data analyst.
Knowing SQL will enable you to work with different relational databases, including popular systems like SQLite, MySQL, and PostgreSQL.
Whether you choose Python or R to start your data analyst journey, you should also consider learning SQL. Due to its declarative, simple syntax, SQL is very easy to learn compared to other languages and will help you a lot along the way.
Yet, while SQL syntax seems simple and rudimentary, writing advanced SQL queries can be tricky, especially when dealing with big and complex databases.
Want to get started in SQL? Have a look at our Data Analyst in SQL career track to become a query wizard.
Despite being a relatively young language –it was only released in 2011–Julia has already impressed the world of numerical computing.
Julia is a new and exciting programming language conceived from its foundations to be the ideal language for scientific computing, machine learning, and data mining. Julia achieves this goal by encompassing the speed of C, the general programming ability of Python, and the statistical prowess of R.
In recent years, Julia has steadily gained momentum, with more and more data practitioners opting for Julia instead of Python due to its astonishing performance. You can read more about what Julia is used for in our separate guide.
However, Julia is not yet as widely adopted as languages such as Python and R. It has a smaller community and doesn't have as many libraries as its main competitors.
DataCamp has been working hard to update its catalog with new Julia courses. To get started on this data science rising star, have a look at our Julia Fundamentals skill track.
Microsoft Excel doesn’t need much of an introduction because everyone knows it. A classic tool in data analysis, many gurus have predicted its death in the last decades. However, the predictions couldn’t be more mistaken. Despite the rise of more flexible and powerful tools, Excel is still the go-to tool for many day-to-day data analysis tasks.
Excel combines powerful capabilities with a user-friendly interface, making it perfect for mature data analysts and less technical users. It’s also a great tool thanks to its smooth integration with the Microsoft BI stack, including PowerBI.
Excel is specifically designed to be accessible and easy to use. However, this comes with a price: Excel is not as flexible as other tools like Python or R, and some complex operations may not be as straightforward.
Yet, learning Excel is a smart choice, as it’s very likely that part of your job as a data analyst will involve dealing with Excel spreadsheets. Check out our catalog, where you can find courses on the topic, such as Data Analysis in Excel, Data Preparation in Excel, and Data Visualization in Excel.
Gain the skills to maximize Excel—no experience required.
Conventional data analytics tools, like Python or R, may fall short when dealing with huge datasets. A different set of tools is required to process datasets with millions of rows at high speed, incorporating advanced techniques to provide high performance.
Among these solutions, Apache Spark is probably the most popular. Spark is a platform for cluster computing. Spark lets you spread data and computations over clusters with multiple nodes (think of each node as a separate computer). Splitting up your data makes working with very large datasets easier because each node only works with a small amount of data.
One key aspect of Spark is its integration with other data analytics tools, including Python. PySpark is the Python package that makes the magic happen. These integrations make it easier for data analysts to get started with Spark.
Willing to learn Spark? Our Introduction to PySpark Course is a great place to get started,
Power BI is a cloud-based business analytics solution that allows you to combine different data sources, analyze them, and present data analysis through visualizations, reports, and dashboards.
According to the Gartner Magic Quadrant, Microsoft’s PowerBI is the industry leader in BI solutions. Power BI makes accessing data on almost any device inside and outside the organization easy.
Among its essential features, Power BI includes:
However, as with Excel, Power BI sometimes sacrifices flexibility in the name of accessibility. Some operations may be difficult to perform and functionalities in certain areas can be limited. Equally, despite its intuitive interface, PowerBI can be complex, especially when using it along with other interrelated tools.
Every aspiring data analyst should be fluent with at least one BI tool. Power BI is no doubt one of the best candidates. DataCamp has plenty of materials about the tool that ranges from our Introduction to Power BI Course to more advanced topics, such as our Reports in Power BI Course.
Founded in 2003 at Stanford University, Tableau is a powerful and popular data visualization tool that allows you to analyze data from multiple sources simultaneously.
Tableau is one of the best-in-class BI tools. It is used by top companies to extract insights from massive amounts of raw data. Thanks to its intuitive and powerful platform, both technical and non-technical users can create visual dashboards and worksheets.
In many aspects, Tableau offers the same capabilities as Power BI. However, it’s considered a more complex tool for beginners. Hence, if you are just interested in building simple charts, you should choose less complex options. Also, an important downside of Tableau is that there is no free version of it, so you will have to pay a quite costly subscription to use it.
Still, many organizations are choosing Tableau for its unique and powerful capabilities. Check out our Introduction to Tableau Course and our Creating Dashboard in Tableau Course to discover this wonderful tool.
Accelerate your career with Tableau—no experience required.
The work of a data analyst wouldn’t be possible without IDEs (Integrated Development Environments). These coding tools provide powerful, intuitive interfaces that make writing, debugging, and testing your code easier.
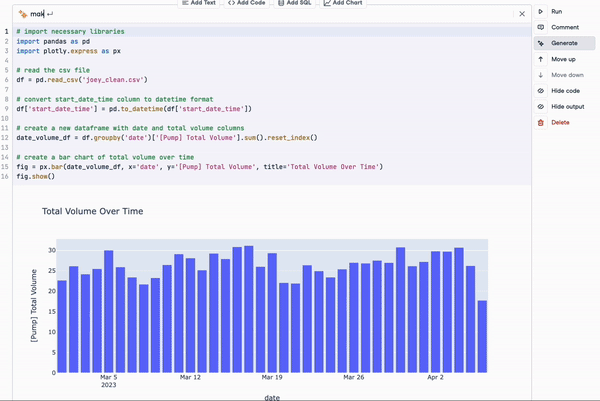
There are many popular IDEs out there, such as JupyterLab or RStudio, but we don’t want to miss this opportunity to tell you about DataCamp's very own DataLab.
Designed with data democratization in mind, DataLab is a valuable tool for team collaboration and organizational learning across various industries.
With the new AI Assistant, DataLab aims to make data science even more accessible and productive for its users. Key features of the AI Assistant include the "Fix Error" button, which not only corrects code errors but also explains them, allowing users to learn and avoid repeating mistakes.
The “Generate Code” feature allows you to generate code based on natural language queries and answer key questions about a dataset. Additionally, the AI Assistant provides intelligent suggestions based on existing code and context, making code writing smarter and more efficient.
Available on both free and paid DataLab plans, the AI Assistant promises a more seamless integration into the tooling stack of modern data scientists, empowering anyone working with data to make informed decisions. You can get started with DataLab for free.
Google BigQuery is a fully managed, serverless data warehouse that enables scalable analysis of large datasets. It is part of the Google Cloud Platform and is designed for high-speed querying of large volumes of data.
BigQuery is particularly useful for organizations that analyze massive datasets quickly and efficiently without managing the underlying infrastructure.
BigQuery is particularly valuable for businesses dealing with large-scale data analysis, especially those already using Google Cloud services. However, costs can accumulate based on the amount of data processed, so managing your queries efficiently is important to optimize costs.
Adding these tools to your toolbox can help you tackle a broader range of data analysis tasks, particularly in specialized fields or when dealing with large-scale data processing.
Check our Introduction to BigQuery course to learn more about this amazing tool.
Everything evolves rapidly in the data science industry. Any little innovation breakthrough can completely change the technology landscape. The tools and solutions that seem mainstream today can turn obsolete tomorrow as emerging technologies with new and powerful capabilities reach the market.
This is clearly illustrated by the AI revolution that has resulted following the launch of ChatGPT. With their impressive capabilities, ChatGPT, and the many other generative AI technologies powered by large language models, AI is rapidly changing the way data science and software development are conceived.
These tools will soon become an essential part of the data analyst toolbox. Hence, learning them is essential. Luckily, we have you covered at DataCamp. We’re working hard to provide you with best-in-class courses and materials to navigate the AI revolution, including our popular Generative AI Concepts Course and our AI Essentials Skill Track.
Becoming a data analyst is one of the best decisions anyone interested in data science can make. Learning the right data analytics tools will be a central part of your journey. We can only wish you safe travels and hope our courses, tutorials, cheat sheets, and other materials can help you.
Here is a list of our learning recommendations to get started:
This track starts with the basics of the Python programming language for data analysis. After covering the basics, you’ll dive deeper into data wrangling and data visualization techniques.
You’ll also learn to source data from different sources such as the web, databases, and JSON files. Finally, this track provides an overview of exploratory data analysis techniques and upskills the learner on relational databases and SQL concepts.
This track focuses on the primary skills required by data analysts working with the R programming language. It offers comprehensive content covering the most commonly used R packages, such as tidyverse, ggplot, and dplyr.
Like the Python track, the course helps build an intermediate understanding of data analyst skills such as data sourcing, manipulation, and visualization.
This career track helps the learner develop an in-depth understanding of SQL Server, the concepts of relational databases, their design, and performance optimization.
Start Your Data Analytics Journey Today!
Track
Track
Track
blog
Abid Ali Awan
9 min
blog
Matt Crabtree
15 min
blog
Elena Kosourova
15 min
blog
Javier Canales Luna
9 min
blog
Joleen Bothma
12 min
blog
Srujana Maddula
14 min