
Our biggest-ever sale. 60% off AI & data skills
Buy Now
This step-by-step guide takes you through the process of how to create an Excel dashboard from scratch. If you'd like to follow along with this tutorial, you can find the dataset on DataLab, DataCamp's AI-enabled data notebook with plenty of sample datasets.
If you're already quite comfortable with Excel, check out this intermediate spreadsheets course on DataCamp. Then come back here to build a more polished dashboard with this data.
In this fictional scenario, imagine you work for a financial services firm. Your task is to help the marketing department better understand how their campaigns are performing, particularly their most recent campaign. They have sent you the data in a CSV file and have asked you to prepare a dashboard for them.
Specifically, they would like to answer these questions with this dashboard:
Go ahead and open a blank Excel workbook and start by creating two sheets named 'Data' and 'Dashboard'.
Since the marketing team sent us a static CSV file, we will import it into our Excel workbook by copying and pasting it into the 'Data' sheet.
I have also selected "Format as Table" so that Excel regards this data set as a table. Other than making the data look nice, it adds some functionality, too, such as referencing column headers by name in formulas (instead of referencing the column letter).
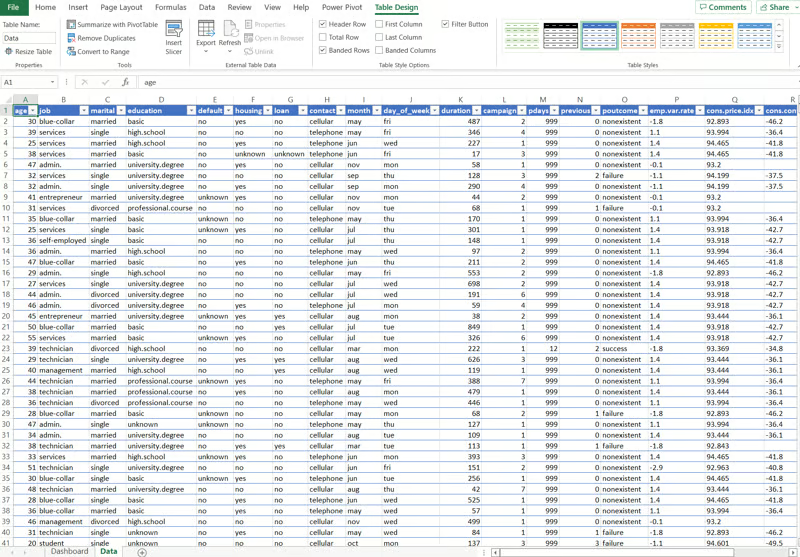
Image by the author - screenshot from Microsoft Excel
Note that you can find all other controls involved in importing data on the 'Data' tab of the ribbon.
During this step, you will transform, prepare, and clean your data, so it's ready to use in the dashboard. You should also spend some time on the calculations you will need for your dashboards. Excel has hundreds of functions and formulas that you can use to build the calculations you need.
Excel offers hundreds of formulas, and picking the right ones takes practice. Check out our tutorial on the basic Excel formulas for everyone.
We have finally reached the dashboard-building stage. You need to choose which visual elements you will use in your dashboard to achieve the goals you set out at the start. We have a course on how to create engaging data visualizations in spreadsheets, which is a great place to start learning.
This dashboard has three major elements based on the goals that the marketing department set out for us. These are:
We won't go over how to create every chart in Excel, as it is quite repetitive. However, this is the process you would usually follow:
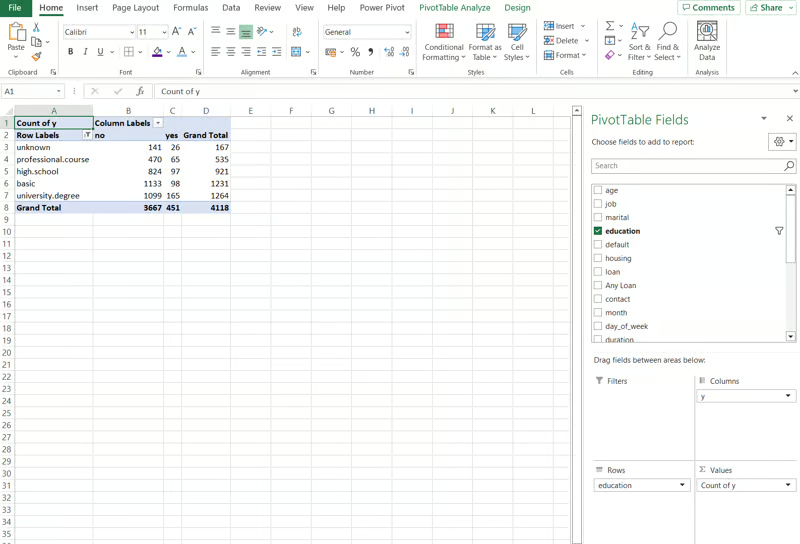
Image by the author - screenshot from Microsoft Excel
Here is the final result of the example Excel dashboard we created. You can use this as inspiration as you create your own dashboards.
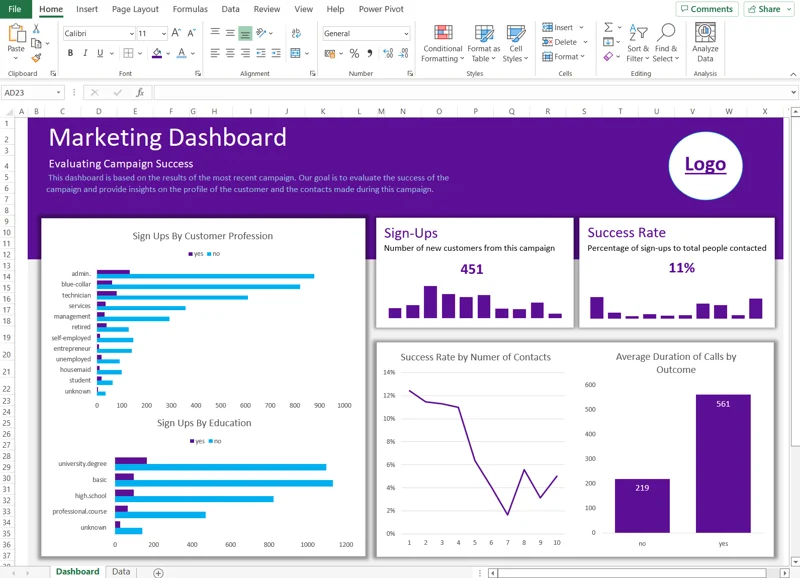
Image by the author - screenshot from Microsoft Excel
A static dashboard shows a fixed view of data. An interactive dashboard lets users filter and explore the data on their own, which is far more useful for ongoing decision-making.
Excel offers several built-in tools to add interactivity:
Slicers — Visual filter buttons that connect to PivotTables. Go to the PivotTable Analyze tab, click Insert Slicer, and select the fields you want users to filter by. Slicers can control multiple charts at once.
Drop-down lists — Use Data Validation to create drop-down menus that feed into formulas like SUMIFS or XLOOKUP, dynamically changing what the dashboard displays.
Conditional formatting — Apply color scales, data bars, or icon sets to highlight values that meet specific thresholds. This draws attention to outliers and trends without adding extra charts. Learn more in our conditional formatting in Excel tutorial.
Timelines — A date-specific slicer that lets users filter PivotTable data by time periods (days, months, quarters, years).
To connect a slicer to multiple PivotTables, right-click the slicer and select Report Connections, then check the PivotTables you want it to control. This gives users a single filter that updates all charts simultaneously.
Excel dashboards work well for small-to-medium datasets and teams already comfortable with spreadsheets. But they have real limitations worth knowing about:
If you hit these limits, consider Power BI, which connects directly to live data sources, supports richer interactivity, and handles larger datasets. Our Power BI dashboard tutorial covers the transition from Excel to BI dashboards.
Building a dashboard in Excel comes down to three things: preparing your data, choosing the right charts, and keeping the design focused on what your audience needs. Whether you’re working with an Excel table or a live database connection, the steps in this tutorial give you a repeatable process.
I find that the planning stage matters more than most people expect. A dashboard built without a clear purpose tends to collect dust, no matter how polished the charts look. Spend the time upfront defining your goals and audience, and the build step gets much faster.
Learn more about Data Analysis in Excel with our course, or explore topics as diverse as financial modeling and marketing analytics using spreadsheets.
Excel has the capability to import and transform data, perform complex calculations, and then display the data in tables or visually in charts. These are the base elements needed to create high-value dashboards.
Yes. Excel supports slicers, timelines, drop-down lists (via Data Validation), and conditional formatting to make dashboards interactive. Slicers connect to PivotTables and let users filter data visually, while drop-down lists can drive formulas like SUMIFS and XLOOKUP to change what the dashboard displays.
There are a few options for sharing Excel files, such as attaching it to an email, saving it to a shared OneDrive folder, or exporting it to a PDF.
Reports are generally long-form static files that contain a mix of visual elements and text-based narratives to tell a particular story about the data. On the other hand, dashboards are generally much more compact and contain more visual elements to convey information in a more concise format.
This is based on the purpose of the chart. However, as a general rule, for comparisons, you may choose a bar chart, line chart, or scatter plot. For categorical data, choose a bar chart. A line chart is one of the best options for showing trends, especially if they involve data over time.
The most useful formulas for Excel dashboards include SUMIFS and COUNTIFS for conditional aggregation, VLOOKUP or XLOOKUP for data lookups, and IF with AND/OR for conditional logic. If you have Excel 365, the FILTER, SORT, and UNIQUE functions let you build responsive data ranges without PivotTables.
Consider Power BI when your dataset exceeds 100,000 rows, when you need real-time data connections to multiple sources, or when multiple team members need to view the same live dashboard at the same time. Excel works well for smaller datasets and ad hoc analysis, but Power BI handles larger data volumes, richer interactivity, and easier sharing through cloud-based workspaces.


Samouczek
 Kafaru Simileoluwa• 14 min

Samouczek
 Laiba Siddiqui• 10 min

Samouczek
 Josep Ferrer• 13 min
Excel & Spreadsheet Courses
Kurs
Naucz się tworzyć różne wizualizacje w Excel dla różnych układów danych, stosując najlepsze praktyki do budowy dashboardów.
Kurs
Poznaj modelowanie finansowe w Excelu: przepływy pieniężne, analiza scenariuszy, wartość pieniądza w czasie i budżetowanie kapitałowe.
Kurs
Opanuj podstawy Excela i naucz się używać tego arkusza kalkulacyjnego do prowadzenia skutecznych analiz.


Excel is one of the most accessible tools for building dashboards, and you don't need any programming experience to get started. If you have data in a spreadsheet and need to present it visually, an Excel dashboard is often the fastest path from raw numbers to a clear story.
In this tutorial, I'll walk through the full process of creating a dashboard in Excel, from planning your strategy and importing data to building charts with PivotTables and adding interactive features like slicers. You can also check out our guides to dashboard design principles and essential Excel formulas.
TL;DR
What is an Excel Dashboard?
A dashboard is a compact visual representation of data. Dashboards are designed to be visually clear, concise, and easy to scan so that users can extract the information they need at a glance.
Dashboards can contain raw numbers, tables, and charts. Dashboards are most effective when they incorporate visual elements to clarify the information they convey, such as through colors, charts, and conditional formatting.
Why are Excel Dashboards Useful?
Dashboards can be used in nearly every industry and business use case. They are a tool for improving the business's decision-making process and can perform complex data analyses. You can learn more about how to do data analysis in Excel or, more generally, in spreadsheets with one of our courses.
Here are a few reasons why dashboards are so useful in organizations. They allow you to:
Before Creating an Excel Dashboard
To build dashboards that people in your organization actually use, start with a strategy. You need to know beforehand why you're building this dashboard, who you're building it for, how it will be built and how you will distribute it to your users.
The dashboard strategy process can be summarized into these five main components:
Image by the author
Knowing all of this before you start building your dashboard will save you more time and headaches later on because you will build what is actually needed and you can avoid entering revision hell or getting negative feedback because you built something that the business didn't actually need.
Clarity is your best friend when building dashboards. Let's review how you can gain clarity with these dashboard strategy components.
Purpose
Be clear on why you need this dashboard - what are the goals? Is this dashboard answering a specific business question or solving a particular problem?
Sometimes, the departments in an organization may already have one or more goals in mind for the dashboard. They may have a task to complete and know that a dashboard would help them do their job better.
However, other times, business users don't know that a data-driven approach is even possible or useful to them. In these cases, you or your manager may need to identify potential areas where a dashboard can add value to the business and propose it as a solution. Here, it is even more important to clearly define the purpose and goals of the dashboard before you start building it.
Audience
In this step, you identify who this dashboard is intended for. Find out who your targeted audience is and what their goals are when they look at the dashboard. Is it for detail-oriented finance managers who want to see a lot of detail or for C-level executives who just want a high-level overview of the business KPIs?
Knowing your audience is an important prerequisite for answering the questions in the next few sections of your dashboard strategy.
Data
What data will you be using? Is the data already available in a database or a flat file that you can simply import into Excel for your dashboard? Or do you need to first extract and prepare the data?
Also, understand how much data is needed. Do you need large amounts of historical data, or are you dealing with more recent events?
Does the data need to be cleaned and transformed before you can build the dashboard? Do you need to check for errors or remove duplicates? This is usually the case for newly extracted data, and data obtained from a database would typically already be transformed and ready to use.
How often do the data and the dashboard need to be updated? Flat files tend to lead to static dashboards, whereas database connections using ODBC can be updated when needed and lead to dynamic dashboards.
Layout
You can identify the best layout for your dashboard at this stage. The previous stages of the dashboard strategy will inform this step. You already know why you're creating the dashboard, who it's for, and the details about the data that will be used.
Also, determine if the dashboard needs interactive elements so users can explore the data and diagnose and investigate possible business problems themselves. Or, if the dashboard will be used to create PowerPoint presentations, it can be more static.
Distribution
How will you be sharing the Excel dashboard with your intended audience? There are a few options for sharing Excel files, such as attaching it to an email, saving it to a shared OneDrive folder, or exporting it to a PDF.
Keep in mind that these methods (except the export to PDF) give users the ability to edit the dashboard and the data. If you don't want anyone to be able to make changes, you can protect the workbook and lock the cells using a password. Or, you force the workbook to open in read-only mode.
Excel Dashboard Design Best Practices
Follow these best practices as you design and create your dashboard: