Course
Statistical Thinking in Python (Part 1)
3 hr
186.5K
Degrees of freedom are one of those statistical terms that often sound abstract or confusing at first. You may already have heard this term in a textbook somewhere.
The short answer is that degrees of freedom measure how much freedom your data has to vary once certain restrictions, like a fixed mean or total, are imposed. If that sounds confusing, don’t worry: In this article, starting with the next section, I will elaborate in detail. I will explain why they exist, and I will provide clear examples so you can study them and build a rigorous intuition.
Degrees of freedom represent the number of values in a dataset or calculation that can vary freely once all constraints have been accounted for.
Imagine you are asked to pick three numbers that add up to exactly 30. You can freely choose the first two numbers, but the third number is automatically fixed to make the total 30. This reduces the number of values that are truly free to vary. Therefore, degrees of freedom tell us how many independent pieces of information are left after applying the restrictions.
In general, degrees of freedom are calculated as the number of observations n minus the number of constraints or parameters estimated from the data.
Different statistical tests apply different constraints, which is the reason why the formulas vary, like in the case of n-1 for a single sample t-test. In practice, you rarely need to calculate degrees of freedom manually, as statistical software does this automatically. However, understanding the general principle will inevitably help you interpret the results correctly.
Degrees of freedom exist because statistical calculations rely very heavily on estimates, like the sample mean or variance, which consume the information from the data. Therefore, without accounting for these constraints, our estimates of variability, confidence intervals, p-values, and others would be inaccurate.
Generally speaking, higher degrees of freedom predominantly lead to more precise estimates and narrower confidence intervals. They also appear in hypothesis testing because they determine which distribution to use and how much information the test has. Thereby, this directly affects the reliability of the statistical inference.
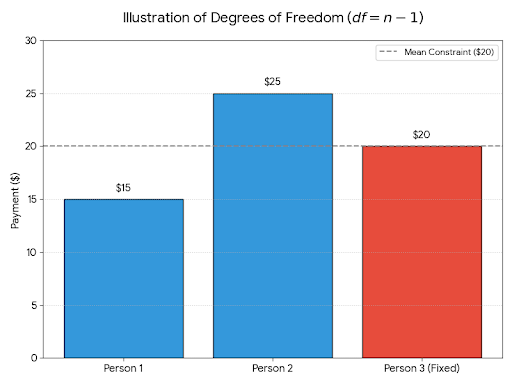
Suppose you have three friends who are splitting a restaurant bill of $60. You want the average payment to be $20 per person, so you follow the next steps:
|
Person |
Participation ($) |
|
First Person |
15 |
|
Second Person |
25 |
|
Third Person |
20 |
|
Mean |
20 |
So even though you have three values, only two were free to vary. We say the last one was determined by the constraint (which is the fixed mean). Therefore, the degrees of freedom here are equal to 3-1=2.
This shows that the number of data points (3) is not the same as the degrees of freedom (2). We say the constraint uses up one degree of freedom.
In this section, I will show some examples of degrees of freedom in common statistical tests and how to use them.
For a one-sample t-test, degrees of freedom = n - 1. In this case, one degree of freedom is used up because we estimate the sample mean from the data. For a larger sample size, we are led to higher df with more reliable t-tests.
In a chi-square goodness-of-fit test, the degrees of freedom = number of categories - 1. Thus, the constraint is that the total observed frequency must equal the total expected frequency.
In one-way ANOVA, the degrees of freedom are split between-groups (k-1, where k is the number of groups) and within-groups (N-k, where N=total sample size). This shows the constraints from both group means and the overall mean of the dataset.
In this section, I will address some of the most misconceived ideas about degrees of freedom. First and foremost, the degrees of freedom are not the sample size because the degrees of freedom are usually smaller due to the constraints that reduce them.
In other words, degrees of freedom are not the same as the number of variables or parameters. They specifically count the independent pieces of information after the constraints.
Additionally, higher degrees of freedom are not always better, and there’s always a tradeoff because very large degrees of freedom can indicate overfitting or unrealistic assumptions in some contexts.
The sample size n is the total number of observations. While the degrees of freedom are not exactly the sample size, they are heavily influenced by it. This originates from the fact that degrees of freedom are typically n minus the number of constraints or estimated parameters. This is the reason why df is almost always smaller than n. The relationship between them exists because estimating the parameters imposes constraints on the data.
The rule of thumb is to focus less on the exact calculation and more on what the constraint actually represents.
Low degrees of freedom mean fewer independent pieces of information, which in turn leads to wider confidence intervals and less statistical power. You should trust your software’s output, but always make sanity checks, like asking the question of whether or not the reported degrees of freedom make sense given your sample size and the test being performed.
The degrees of freedom measure how much truly independent information is available in your data after accounting for all the constraints. The main idea to keep in mind is simple: every time you estimate a parameter or impose a restriction, you lose one degree of freedom. Therefore, understanding this concept strengthens your statistical intuition and helps you interpret test results with greater confidence. With practice, degrees of freedom will feel much less mysterious and far more meaningful.
Learn with DataCamp
Course
Course
Course
blog
Matt Crabtree
15 min
Tutorial
Allan Ouko
Tutorial
Vidhi Chugh
Tutorial
Vinod Chugani
Tutorial
Vinod Chugani
Tutorial
Vinod Chugani