Course
Dumbbell charts are helpful visualizations for comparing two or more data points to demonstrate movement or momentum.
Named after their resemblance to a dumbbell, these charts display two dots connected by a line for each category. The dots represent different data points, such as before-and-after scenarios or two distinct measures. They’re great for highlighting the magnitude and direction of change, making complex comparisons easy to understand.
When you need to create dumbbell charts, Tableau is a go-to data visualization tool for making your data visually digestible. With a strong tool like Tableau, creating this complex visualization is a breeze.
In this guide, we’re going to:
- Dive into dumbbell charts and explore what they are and their use cases.
- Prepare data for creating a dumbbell chart.
- Walk step-by-step through creating a dumbbell chart in Tableau using the prepared data.
- Customize and enhance the dumbbell chart to improve its effectiveness.
Let’s get started!
What is a Dumbbell Chart?
Dumbbell charts are a clever data visualization tool that packs a powerful comparative punch. These charts shine when you need to show the difference between two related data points across several categories. They're perfect for highlighting before-and-after scenarios, comparing actual results to goals, or showcasing changes over time.
The beauty of dumbbell charts lies in their simplicity: the length of each "dumbbell" instantly communicates the magnitude of difference, while the direction shows an increase or decrease. By lining up multiple dumbbells, you create a clear, concise view of how various categories stack up.
Dumbbell charts excel in several scenarios, making them a go-to choice for savvy data storytellers. Here are some ways these charts really flex their muscles:
- Time comparisons: Dumbbell charts are perfect for showing how things have changed from one point in time to another. Consider comparing sales figures from last year to this year across different product lines.
- Actual vs. target: Great for highlighting gaps between goals and reality. Imagine displaying actual revenue against projected revenue for various business units.
- Group comparisons: Excellent for contrasting two distinct groups. You could use this to show differences in survey responses between age groups or gender.
- Geographical contrasts: Handy for comparing metrics across different regions or countries, such as comparing literacy rates between urban and rural areas in various states.
- Ranking changes: Effective at showing how rankings have shifted. Picture displaying how different brands' market positions have changed over a year.
Dumbbell charts are especially powerful when you have multiple categories to compare and want to emphasize the gaps or changes between two data points. By choosing dumbbell charts for these scenarios, you're giving your audience a clear, visually appealing way to grasp complex comparisons quickly and easily.
Master Tableau From Scratch
Accelerate your career with Tableau—no experience required.
Preparing Data for Dumbbell Charts in Tableau
Before you can start creating dumbbell charts in Tableau, you will need some data. Structure the data beforehand to quickly and effectively create a dumbbell chart in Tableau, which will set you up for success.
Structuring data for dumbbell charts
Ideally, your dataset should include a column for categories (like products or regions) and two separate columns for the data points you're comparing (such as sales from two different years). An additional date column can be helpful if you're dealing with time-based comparisons.
For example, your data might have columns for Product, Sales 2022, Sales 2023, and Date. This setup allows Tableau to easily plot the two ends of each dumbbell for every category.
The goal is to have distinct columns for your categories and the two measures you're comparing, setting the stage for clear, insightful dumbbell charts.
Importing data into Tableau
For our purposes, we will use the Superstore Sales sample data provided by Tableau. It is already in the perfect format for this project and is downloaded as a .xlsx file.
When you open Tableau, you can connect to a file on the left sidebar. Select the Microsoft Excel option. Then select your recently downloaded superstore data. Since the Excel spreadsheet contains other sheets inside, double-click on the Orders sheet so that it loads into Tableau.
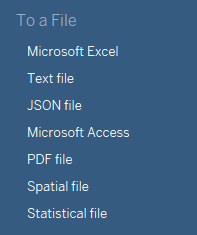
Importing data into Tableau. Image by Author.
Creating a Dumbbell Chart in Tableau
In this section, we’ll cover how to create a dumbbell chart using the sample Superstore Sales data from Tableau. We will set up a worksheet, plot the data points, and add the dumbbell lines.
Setting up the worksheet
The first step is to create a fresh sheet. When you first open Tableau and connect a dataset, there should already be a blank sheet named “Sheet 1” at the bottom, click on it to get started. This will be our canvas for creating the dumbbell chart.
Plotting the data points
A dumbbell chart uses scatter plots, so we’ll start by loading in our measures of interest. I am interested in the “Sales” measure for each “Sub-Category” dimension.
Take the “Sales” measure and put it in the Columns shelf. Then, place the “Sub-Category” dimension in the Rows shelf. This will default to a bar chart view.

Selecting measures as rows and columns. Image by Author.
Go to the Marks menu and change it from “Automatic” to “Circle,” which will convert the bar to a scatter plot design.
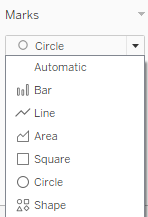
Mark type selection for charts. Image by Author.
Since this visualization focuses on comparing different points in time, let’s add the “Order Date” dimension to the Filters shelf.
When you add the dimension, select the Years option to filter on the year and select two different years. I chose 2016 and 2017 for my data.
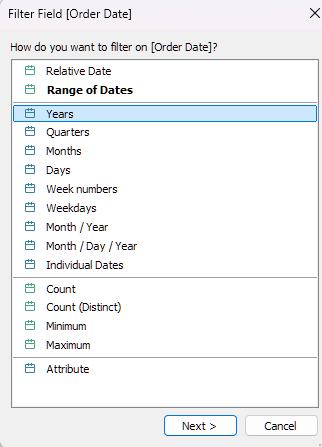
Filter by a year. Image by Author.
Lastly, add the filter to the Color marks. This way, we can see both years simultaneously.
We have now set up the basic layout for our dumbbell chart!
Hint: You can copy things like the filter by pressing CTRL (for Windows)/CMD (for Mac), clicking on the object, and dragging it to the desired location.

The basic layout for a dumbbell chart in Tableau. Image by Author.
Adding dumbbell lines
Finally, we must connect the dots for each year to create the dumbbell effect.
Add a second copy of the “Sales” measure to the Columns shelf. Right-click on the second instance and select Dual Axis. Then, go to the axis in the chart and select Synchronize Axis.
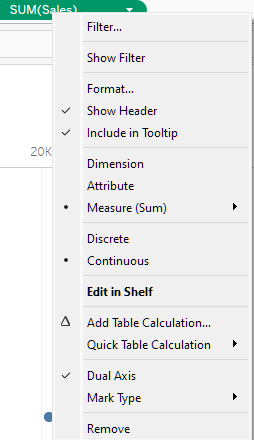
Adding dumbbell lines to a chart. Image by Author.
You should now have 2 versions of the “Sales” measure in the Marks shelf. Click on the second one and do the following:
- Set the mark type to “Line.”
- Copy the Year filter to “Path”.
You should now have a beautiful dumbbell chart that looks something like this:
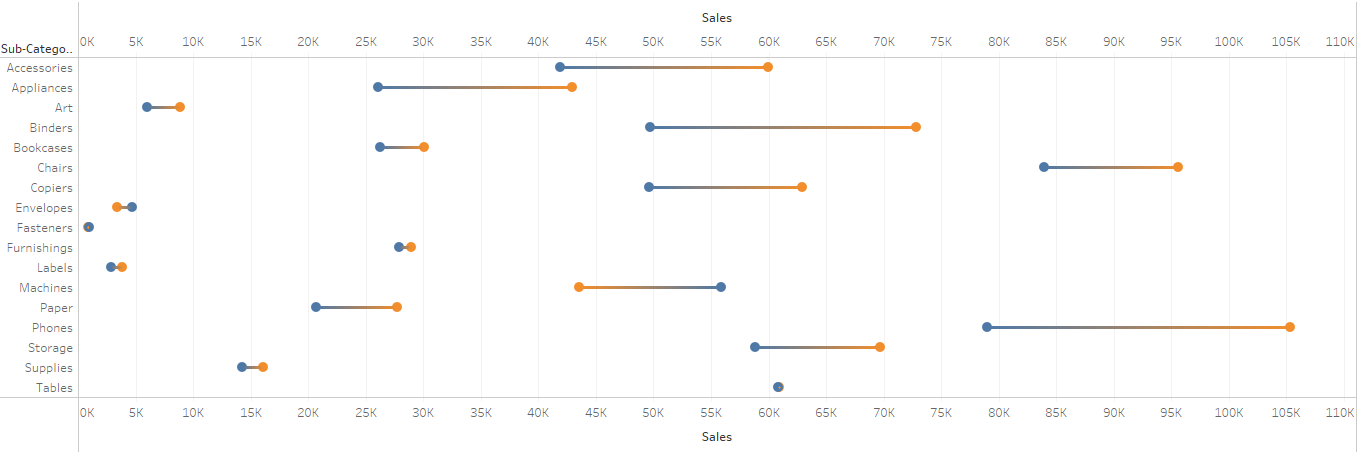
Tableau dumbbell chart. Image by Author.
Customizing a Dumbbell Chart in Tableau
Part of Tableau’s power is the ability to customize your charts. Let’s discuss a few options available for customization, such as formatting, labels, and adjusting the layout.
These options are universal throughout Tableau and can be seen in our stacked bar chart tutorial.
Formatting the chart
When it comes to your dumbbell chart, you have options to adjust the size, color, and style of your data points and lines.
For size, you may choose to show the magnitude of sales. To do so, drag the “Sales” measure to the Size label in the Marks shelf. Since the dumbbell chart shows movement, use the size option carefully to enhance details by improving visibility, not creating more visual clutter.
Color can be a powerful tool in a dumbbell chart, providing excellent contrast. You can change the color of your points by right-clicking on the category of interest in the Filter box and selecting Edit Colors….
Note that since the dumbbell chart showcases movement, avoid using misleading colors. For instance, showing red to green may give a sense of growth where there may be none. Also, be mindful of color blindness and choose appropriate colors.
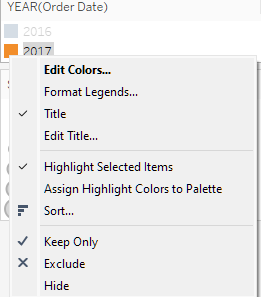
Menu for adjusting chart colors. Image by Author.
Lastly, style. Using a specific shape or design can add uniqueness to your dumbbell. Keep it simple, and make sure it’s intuitive for the viewer!
Adding labels and tooltips
Adding labels and tooltips can enhance your visuals by adding details to the chart and providing greater detail upon interaction.
To add labels, drag the measure of interest to the Label icon on the Marks shelf. Adding tooltips is similarly simple: add the information of interest to the Tooltip icon in the Marks shelf.
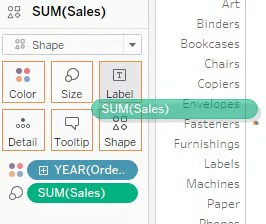
Adding labels and tooltips in Tableau. Image by Author.
Labels can add more context to a particular point in the dataset itself, whereas tooltips add more context to information that isn’t directly shown.
For example, I can showcase the sales directly on the chart by adding “Sales” to the Label so that viewers can easily see the exact sales number. I can also add details such as “Quantity” and “Profit” in the Tooltip so that when the viewer hovers over a point, they can see if other KPIs of interest, like profitability and unit movement, are also growing.
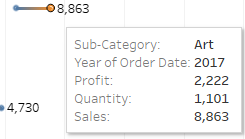
The use of labels and tooltips. Image by author.
Fine-tuning the layout
One last thing to consider is potentially adjusting axes, gridlines, and fonts to make your chart more visually appealing.
To edit the axes' details, such as the range, title, and scale, right-click on the axis of interest and select Edit Axis….
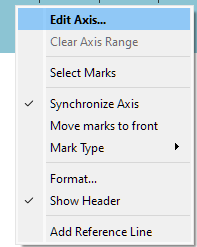
Editing the chart axis. Image by Author.
To edit things like the grid line and font, right-click on the visualization in the middle and select Format….
A detailed pane should appear on the left sidebar, with many options for enhancing your chart. Here, you can do things like increasing the font size and adding bold impacts. You can also add gridlines by changing the level of dividers. Explore this thoroughly and adjust until you get the visualization you want. Stay on the side of simplicity and only use the options you need.

Formatting chart borders. Image by Author.
Enhancing a Dumbbell Chart with Tableau Features
While the dumbbell chart is already very powerful, we can add a few features to make it more interactive and integrated into our Tableau workflow.
Adding filters and parameters
We’ve already added filters to limit our years of interest. Feel free to consider adding other filters, such as the “Sub-Category” dimension to limit the number of visible categories or the “City” dimension for some geography control.
You can also add clever parameters to regroup your “Sub-Category” dimension to new larger categories by using IF and ELSEIF statements to add another aggregation layer.
The goal of Tableau filters and parameters is to increase interactivity and control. Pick parameters that may allow viewers to answer interesting questions like “How were sales in city X between 2016 and 2017 in office categories like Envelopes, Machines, and Paper?” By thinking about what questions may be asked, you can prepare your visualization to answer them.
Using dumbbell charts in dashboards
Lastly, adding dumbbell charts to a dashboard is a great way to integrate them into a larger project. This will briefly introduce dashboards, as they can be complex and multilayered.
First, create a new dashboard by clicking the New Dashboard button at the bottom.
![]()
Creating a new dashboard. Image by Author.
This should open up a blank dashboard. You can then select the sheet on which your dumbbell chart is and add it to the dashboard. It’s that easy!
The power of a dashboard is that it allows you to move things like filters around to create a more user-friendly experience and add other views that can interact with your dumbbell chart. You can explore this feature in more detail in the Creating Dashboards in Tableau course.
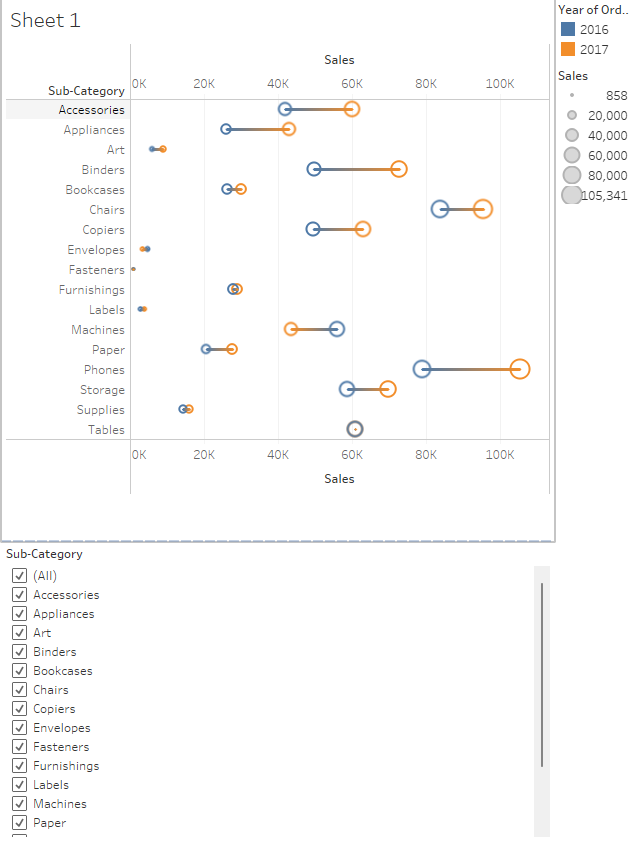
A dumbbell chart in a Tableau dashboard. Image by Author.
Conclusion
Creating a dumbbell chart in Tableau is ideal for providing an intuitive way of showcasing differences over time, location, or events. To do so, load your data and select your measures of interest. Then, choose your two points of difference, such as two years, two locations, or two events. Finally, add a dual-axis of your measure of interest as a line to connect the points.
Get creative with your visualization to tell an interesting data story. Combining your dumbbell chart with other Tableau visualization techniques is a great way to enhance your visualization.
Learn more about different methods to improve your data visualization skills! To get started, try these resources:
Become Certified in Tableau
FAQs
What’s the difference between a dumbbell chart and a connected scatter plot?
Both charts use dots to represent data points, but dumbbell charts are designed specifically to compare two related data points across categories connected by a line. Connected scatter plots, on the other hand, typically show the relationship between two continuous variables over time or across another dimension.
How can I handle missing data when creating a dumbbell chart in Tableau?
If you have missing data points, Tableau will leave gaps in the dumbbell chart. To address this, you can either exclude the incomplete data or use data preparation techniques to fill in missing values (e.g., interpolation or imputation) before importing the dataset into Tableau.
Can I add more than two data points to a dumbbell chart?
A traditional dumbbell chart compares two data points per category, but you can extend it by using additional points (e.g., a triple-axis chart) or by layering multiple dumbbell charts to show more complex comparisons. However, this may complicate the visualization, so it’s important to ensure clarity.
Are there any best practices for choosing colors in dumbbell charts?
When selecting colors, avoid using overly bright or contrasting colors that could distract from the data. Instead, opt for subtle yet distinct colors for each data point, ensuring they are colorblind-friendly. Always test the visualization to ensure it’s easy to interpret for all viewers.
Can I use other data visualization tools to create dumbbell charts, or is Tableau the best option?
Yes, other tools like Excel, Power BI, and Python libraries (such as Matplotlib and Seaborn) can also create dumbbell charts. However, Tableau is known for its ease of use and powerful customization features, making it a great choice for users who want to build interactive, visually appealing charts with minimal coding.
What are some other visualizations that pair well with a dumbbell chart?
A stacked bar chart or time series can go well with a dumbbell chart to add an additional layer to the data.
What are some ways to get started in Tableau?
DataCamp has a great introduction to Tableau. You can also try just playing around with the sample data and creating any visualization you can think of!
Are there detailed projects for getting started in Tableau?
Yes! One of the best ways to get started in Tableau is to find a dataset that interests you. If you need help, DataCamp has great resources on Tableau projects like analyzing churn, marketing data, and more.
I am a data scientist with experience in spatial analysis, machine learning, and data pipelines. I have worked with GCP, Hadoop, Hive, Snowflake, Airflow, and other data science/engineering processes.


