
Course
Understanding Data Visualization
2 hr
254.5K
Data can often be complex and difficult to interpret. Data visualization helps simplify this process by revealing patterns and insights that might go unnoticed.
One popular method is the stacked bar chart, which clearly shows relationships between different categories. Though creating visualizations might seem challenging, tools like Tableau make it easier.
Tableau stands out for its powerful yet user-friendly interface, making it more efficient than other tools like Excel for creating effective visualizations. Whether you're a beginner or honing your skills, Tableau lets you quickly create engaging visualizations, including stacked bar charts, with just a few clicks. As demand for Tableau expertise grows, mastering these skills can be a valuable asset in your data career.
In this tutorial, you'll learn to create and customize stacked bar charts in Tableau. I'll cover an overview of their use cases, a step-by-step guide to building a basic chart, customization of colors, labels, and axes, and advanced features like filters and tooltips. Finally, we'll review best practices for creating clear and compelling charts.
A stacked bar chart is a bar chart in which each bar is divided into segments stacked on top of each other, each segment corresponding to a different category within the data. These stacked segments allow for a clear comparison of each category's total and the contribution of each sub-category to that total.
A stacked bar chart is best used when comparing overall totals and the individual components that make up those totals across different groups. It's particularly effective when you want to show how different sub-categories contribute to a larger category over multiple groups, making it easier to visualize both the part-to-whole relationship and the comparative size of each group.
Stacked bar charts are ideal for displaying categorical data where the focus is on the distribution within categories while still keeping an eye on their overall scale.
If you’re interested in improving your data visualization skills or if you struggle to make your insights “land” with your stakeholders, the Data Visualization in Tableau course is for you.
This section will briefly cover the steps necessary for creating a stacked bar chart, starting with connecting it to your data.
Connecting data is the first step in any Tableau project, as it imports the data into Tableau.
We will utilize public CitiBike Data provided by Lyft, which contains information about the CitiBike Bike Share program in New York City.
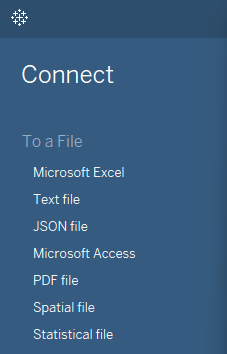
Download one of the datasets—I’m using the 202408-citibike-tripdata.zip—and save it as a CSV file. Then, open Tableau, go to Connect and click on Text File. This should open a pop-up window where you can choose the CSV file.
If you want to learn how to connect different data sources and prepare the data for analysis in Tableau, head to the Connecting Data in Tableau course.
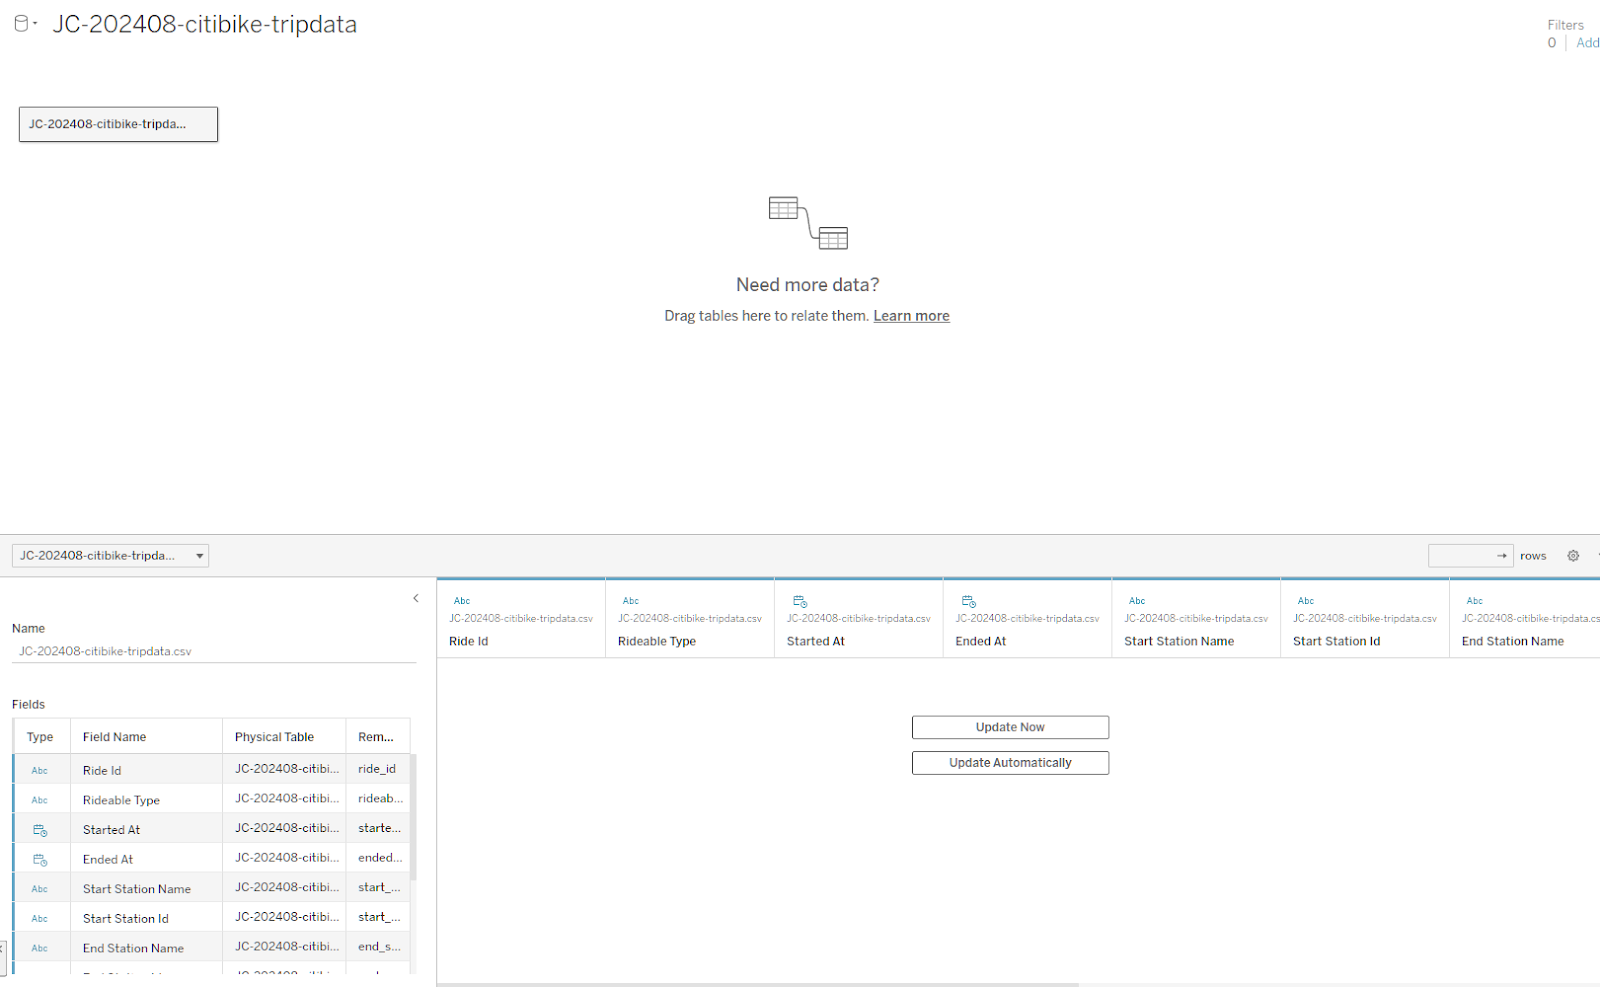
Once the data is connected, your Tableau window should have an overview of the fields available. This is your time to look at how the data is structured, the data types of each column, and whether there are any potential problems with the data.
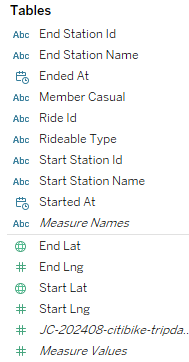
Once you have confirmed the data is loaded, click on Sheet 1 at the bottom to go to your worksheet. This should open the Tableau Worksheet page. On the left you should see your columns. We’re going to start by creating a bar chart with the Rideable Type and Ended At data fields.
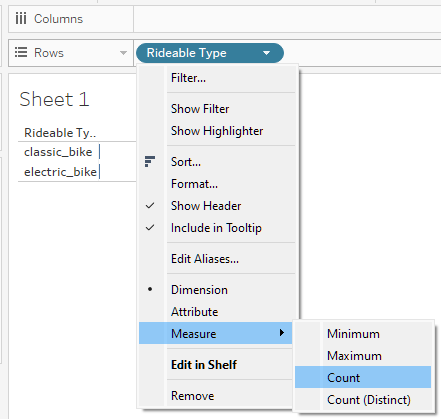
Start by dragging the Rideable Type field to your Tableau worksheet's Rows section. Then click the dropdown menu to set this column as Measure with the aggregation as a Count.
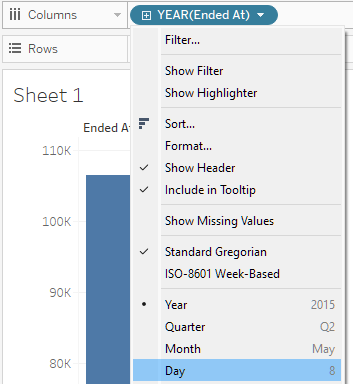
Next, we’ll drag the Ended At field to the Columns area in the worksheet. Then, click on the dropdown and select Day so we can see this in the data on a daily level.
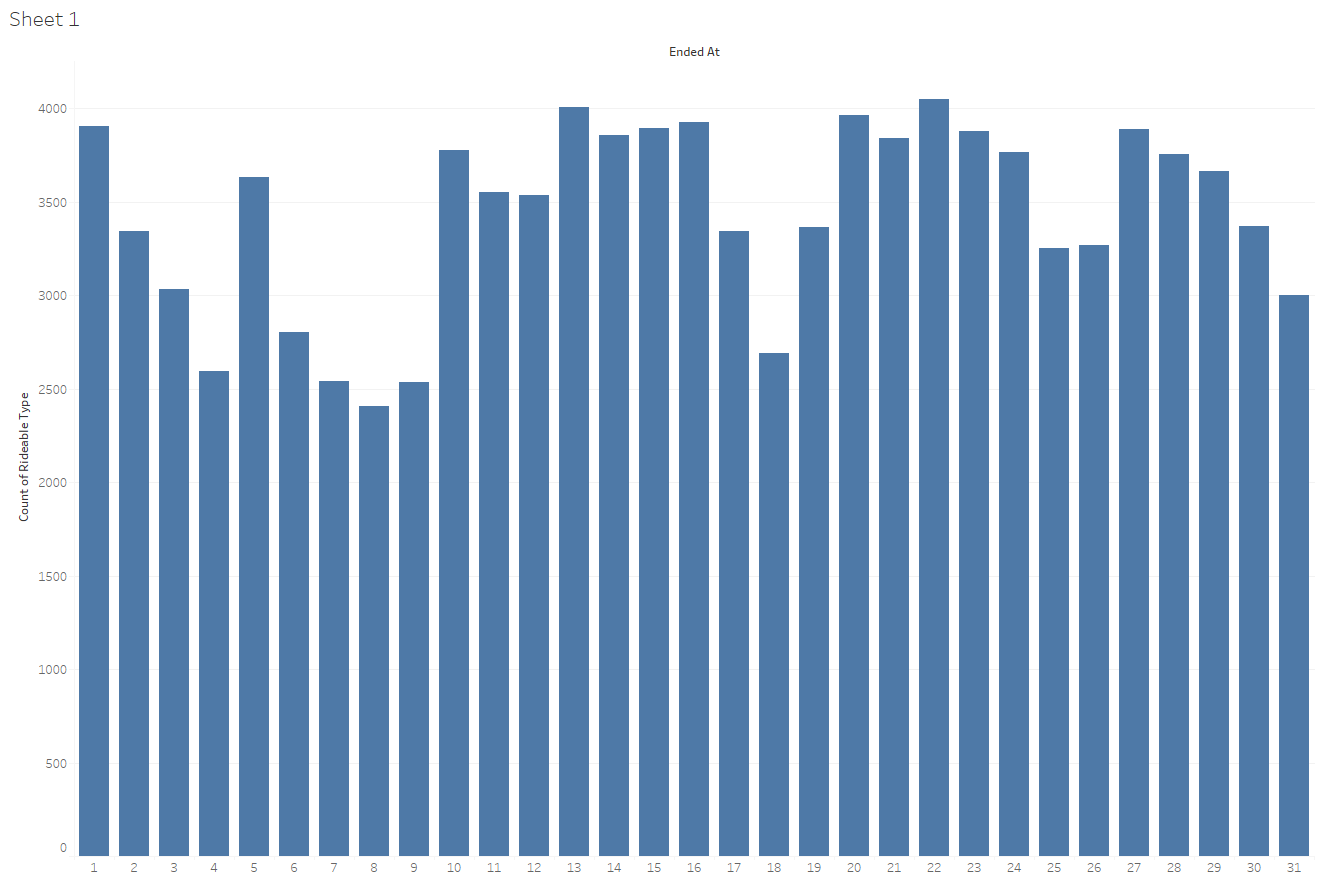
You should now have a pretty simple bar chart that looks like the following:
Our final step is to add an extra variable that will provide us with the “stacking” component. This is generally going to be a category that breaks the data into two or more groups.
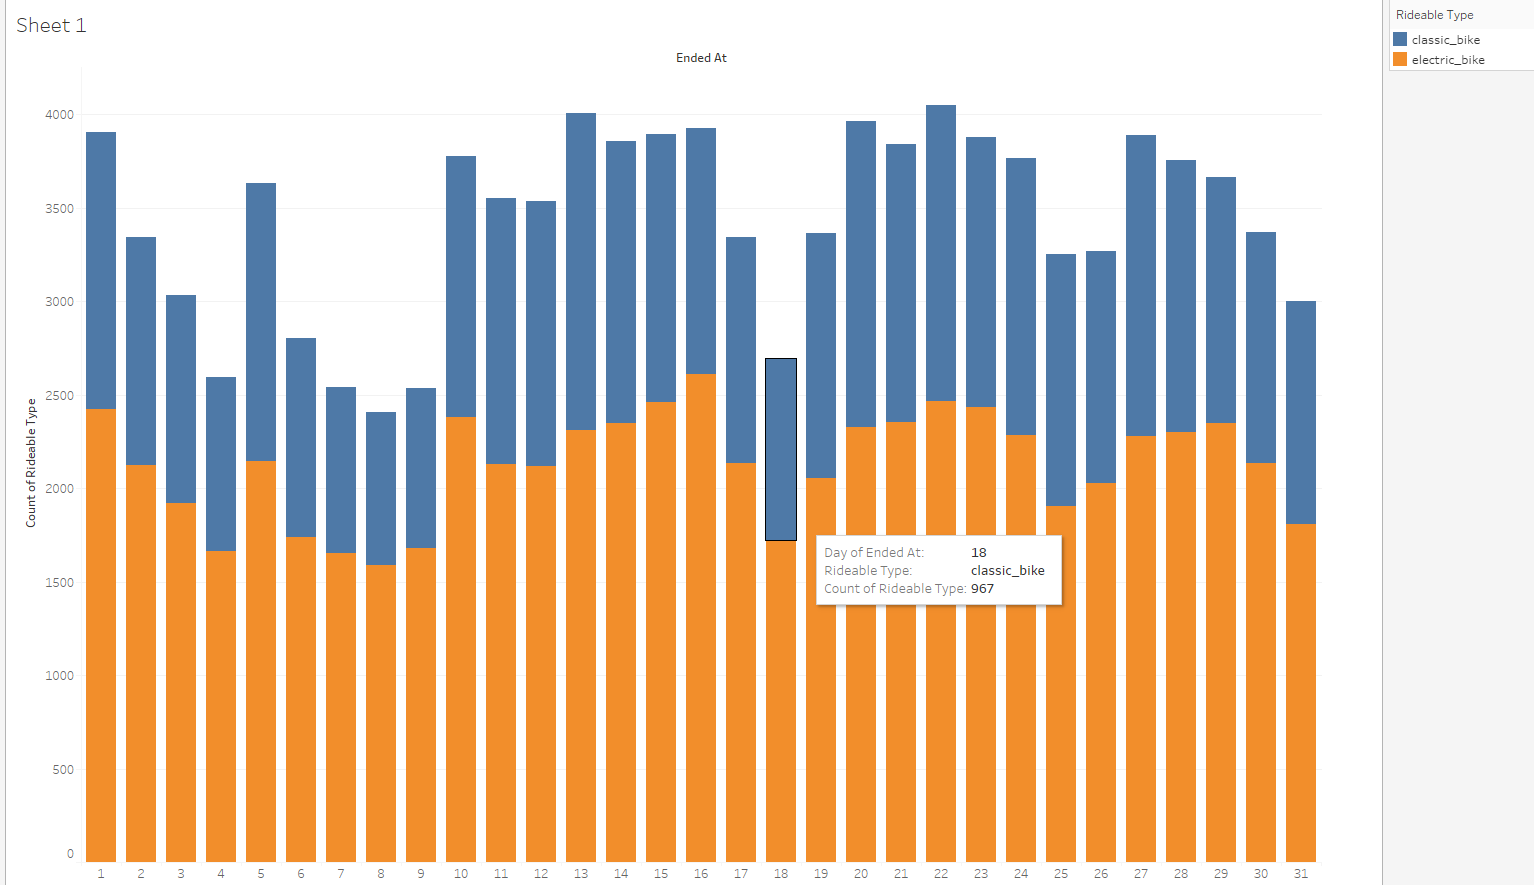
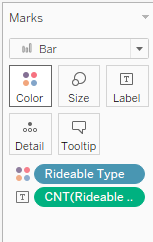
In this instance, the group we are going to use is Rideable Type itself so that we can actually see the breakdown of the two types of rideables: electric and classic bikes. We will drag Rideable Type to the Color icon under Marks. This should now transform your chart from a simple bar chart to a stacked bar!
Sometimes, we need to customize our charts to meet certain visual standards, such as color blindness and company style, and to improve readability. Some things to consider are changing the color, sorting, and adjusting axes and titles.
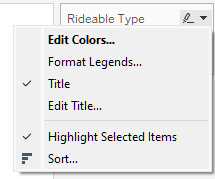
Changing colors in Tableau is straightforward. Go to the legend on the right, click the drop-down menu, then select Edit Colors…. Choose the colors of interest and click Apply -> Ok to change the colors of your chart.
Sometimes, adding labels to our data is interesting. This can be to showcase a particular value of interest or provide additional context for the viewer. To do so, drag any field to the Label icon under the Marks box to populate your chart with labels.
For instance, holding down the Ctrl button on the keyboard and dragging the CNT(Rideable Type) field we created in the Rows field to the Labels will copy those values to the chart.
While our data is currently sorted by date, there may be instances where we need to change the sort or order of our data.
Changing the sort method in Tableau is straightforward. Hover over the y-axis label Count of Rideable Type and click on the little icon that pops up. This will alternate between sorting largest to smallest value, smallest to largest, and alphabetical or numerical order.
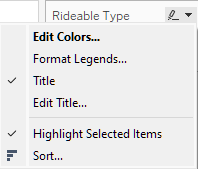
To change the order of the groups themselves, you can go to the legend on the right and click on the dropdown menu and choose the Sort… option. This will provide you with a few choices on how to sort your groups to suit your needs.
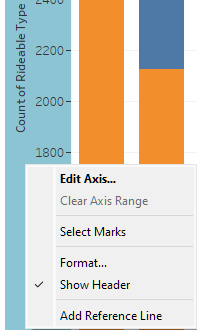
In some instances, we need to change our axes or titles. These can both be done in the same menu. If you right-click on an Axis, you can select Edit Axis… which will pop up a menu that allows you to change various things about the axis, such as the title and range.
Generally, we want to ensure that our axes are labeled appropriately in a way that makes sense for viewers and that we provide a range that is sensible but not misleading.
If you are not starting your axis at zero or cutting off parts of your range, you should be able to explain your reasoning, such as focusing on a particular subset of the data. These changes should be made clear to minimize misleading the audience.
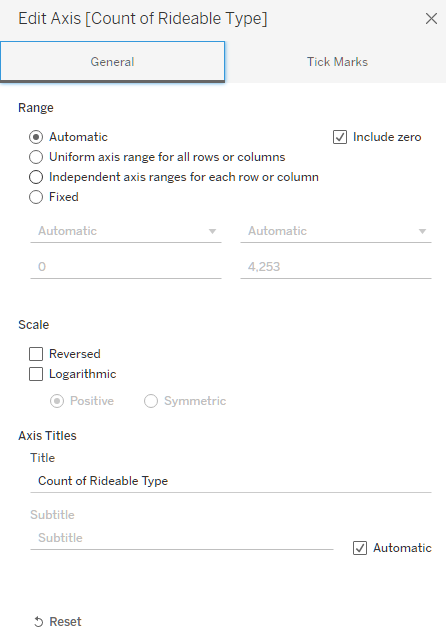
Tableau offers great features for things like filters, tooltips, and actions. These can aid in making the visualization more exciting and interactive.
Adding filters is a great way to allow viewers to control the range of interest. To generate a filter, you just drag the field of interest to the Filters box.
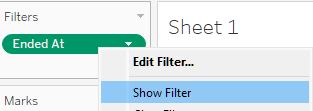
For example, we will drag Ended At to that box now and select Range of Dates. We will then right-click on the new Ended At label in our Filters box and select Show Filter.
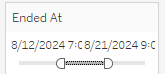
Doing this provides a slider bar that we can use to adjust our dates of interest.
For example, you can limit my data from “08/12/2024” to “08/21/2024” by dragging the filter to those dates:
Tooltips provide additional context to the chart that may not need to be visualized. Any useful information may be added to the tooltip by dragging the field of interest to the Tooltip icon in the Marks box.
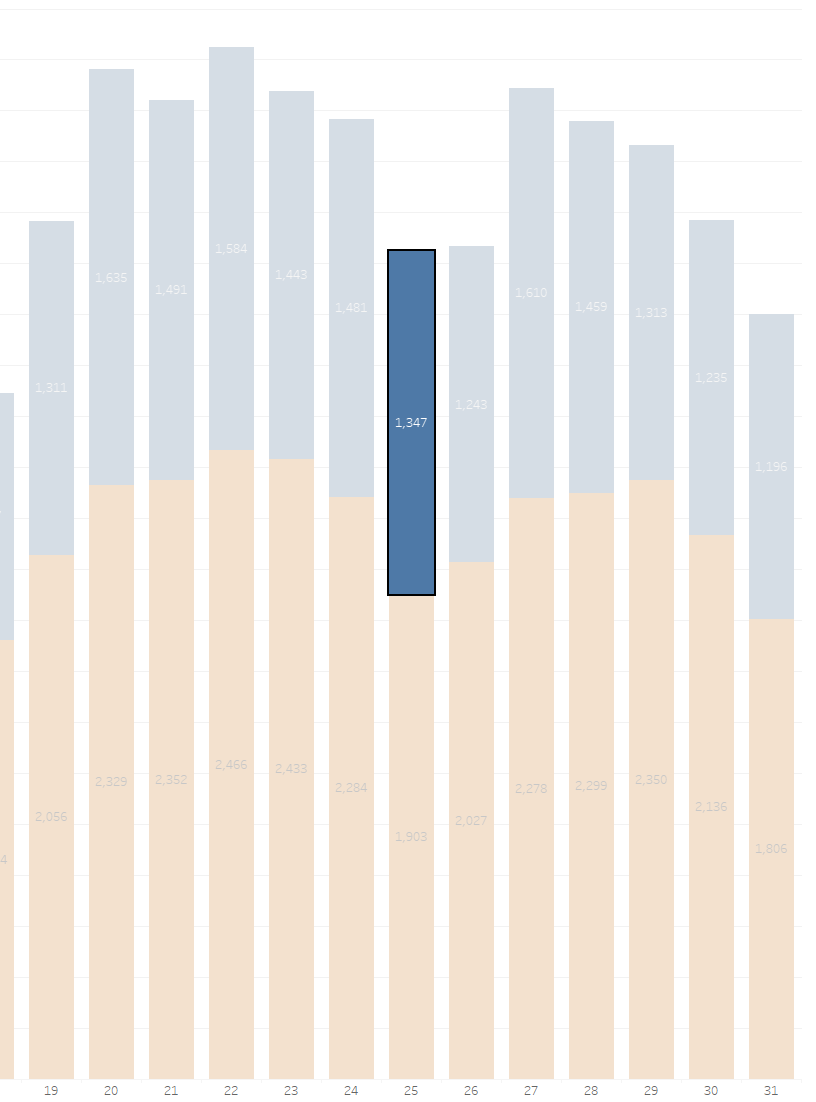
Highlight actions allow us to create interactions with our charts based on other interactions in the dashboard. While in a dashboard, go to the top toolbar, click on Dashboard then Actions. You can then Add actions as needed, such as highlight actions. A default highlight action that exists in Tableau is on Select. When you Select a portion of the chart, it brings it into focus while dimming other portions.
Creating effective stacked bar charts requires more than just plotting data; it’s about ensuring clarity and accuracy. By following best practices, you can avoid common pitfalls and make your visualizations more informative and visually appealing.
Let's explore basic guidelines to help you design stacked bar charts that effectively communicate your data insights.
One key best practice when creating stacked bar charts is to avoid overcrowding. Overcrowding occurs when too many categories or segments are displayed, making the chart cluttered and difficult to interpret.
It’s important to limit the number of categories or segments shown in the chart. As a general rule, try to keep the number of segments within each bar manageable—too many can overwhelm the viewer and obscure the overall message.
Using color wisely is an important best practice for creating effective stacked bar charts.
Colors should be used strategically to differentiate between segments, making it easy for viewers to distinguish between categories and interpret the data accurately. However, it’s important to ensure that the color choices enhance, rather than hinder, the readability of the chart.
Clear and concise labeling is essential for creating effective stacked bar charts. Proper labels ensure that viewers can quickly and easily understand the data being presented.
Directly labeling each segment on the bars themselves can enhance clarity by providing immediate context without requiring viewers to refer to a legend. This approach is particularly useful for highlighting key data points and making the chart more self-explanatory.
Additionally, it’s important to avoid overly complex legends, which can clutter the chart and detract from its readability. Use simple, straightforward labels and limit the number of legend entries to ensure that the chart remains clean and easy to interpret.
When creating a stacked bar chart, it's important to consider whether this type of visualization is the most effective for your data. If a stacked bar chart does not clearly communicate the intended message or if the data becomes too cluttered, exploring alternative chart types might be beneficial.
For example, a grouped bar chart can be a good alternative when you need to compare multiple data series side by side, rather than stacking them. This approach provides a clearer view of individual categories across different groups.
Another option is a 100% stacked bar chart, which shows the percentage contribution of each category to the total, making it easier to compare the relative proportions across groups.
Creating a stacked bar chart in Tableau is fairly straightforward. You obtain a dataset, connect it to Tableau, choose your fields of interest, and add a category as the visualization for your stacked bar. You can even add customizations such as filters, adjusting axes titles, labels, color, and more.
This is just the beginning with Tableau. You can do many more complex visualizations in Tableau and build out a complete dashboard to combine multiple visualizations into a single story. If you want to learn more, consider the following resources from DataCamp:
Learn more about Tableau and data visualization with these courses!
Course
Course
Course
Tutorial
Islam Salahuddin
Tutorial
Chloe Lubin
Tutorial
Eugenia Anello
Tutorial
Eugenia Anello
Tutorial
Elena Kosourova
Tutorial
Parul Pandey