Course
One result on its own doesn’t tell you much. Suppose you flip a coin once and get heads. That doesn’t prove anything — it could’ve landed that way by chance. But if you flip the coin 100 times, you’ll see heads and tails coming up in roughly equal numbers. That’s when the average starts to make sense.
And this is what the law of large numbers is all about. The more data you collect, the more accurate your average becomes. It helps you see the bigger picture.
In this guide, we’ll walk through what the law of large numbers means, how it works in real life, and why it’s so helpful when trying to understand patterns or make better decisions over time.
What Is the Law of Large Numbers?
The law of large numbers is a principle in probability and statistics that explains how averages behave as more data is collected. As your sample size increases, the average of that sample (called the sample mean) gets closer to the true average of the entire group (called the population mean).
In the real world, we usually don’t have access to data from an entire population. Instead, we take a sample like surveying 1,000 voters, instead of all 300 million people. The law of large numbers gives us confidence that, with enough data, the sample average will be close to the real thing.
As the sample grows, random variation starts to cancel out. Outliers have less impact, and the average becomes more stable and predictable.
There are two main versions of the law, and they differ in how strongly they guarantee this effect:
Weak law (convergence in probability)
The weak law of large numbers says that the sample mean probably gets close to the population mean as the sample size increases. The more data you collect, the less likely it is that your average will stay far off the mark.
For example, you flip a fair coin. As you flip more times, the ratio of heads to tails gets closer to 50/50. It may not land perfectly, but it gets pretty close, and that’s what the weak law is about.
Strong law (almost sure convergence)
The strong law of large numbers goes a step further. It says that the sample mean will get close to the population mean and stay there almost certainly, not just probably.
In simple terms: if you keep flipping that fair coin forever, the heads-to-tails ratio won’t get close to 50/50; it’ll settle there. So this law gives us near-total certainty that long-run averages reflect the truth, with only rare exceptions.
Real-Life Examples of the Law at Work
Let’s look at a few real-life examples to understand how this law works:
Coin tosses or dice rolls
Imagine you rolled a regular six-sided die three times. You may get results like 6, 2, and 5. The average is 4.3, which is higher than the expected value of 3.5. But now you roll the die 100 times, then 1,000 times. As the number of rolls increases, your average gets closer to 3.5. The law of large numbers smooths out the randomness over time.
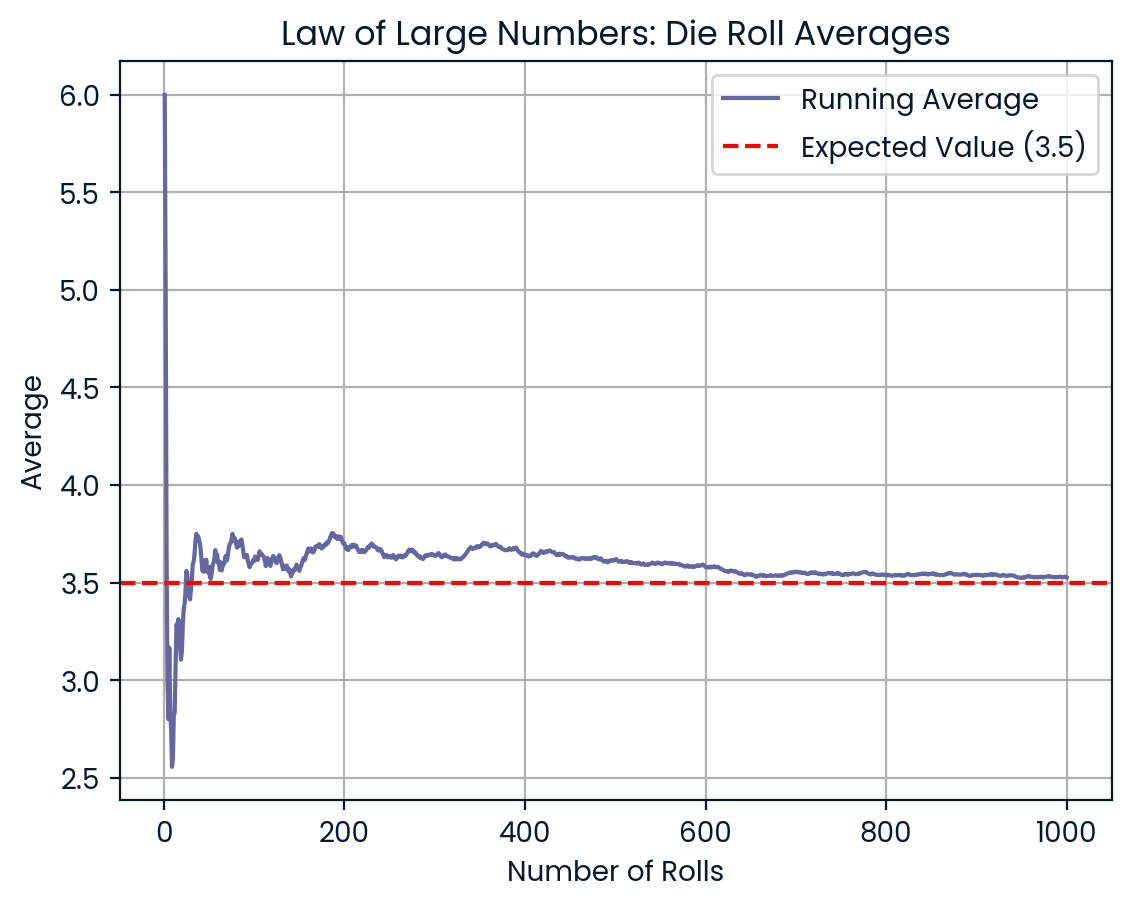
More rolls make the average get closer to 3.5. Image by Author.
Sports stats
Athletes can have good days and bad days. A quarterback may complete 9 out of 10 passes in one game, an impressive 90%. But that doesn’t mean they always play at that level.
Over an entire season, with hundreds of throws, the completion percentage starts to level out. That season-long stat gives a much better sense of the player’s actual ability.
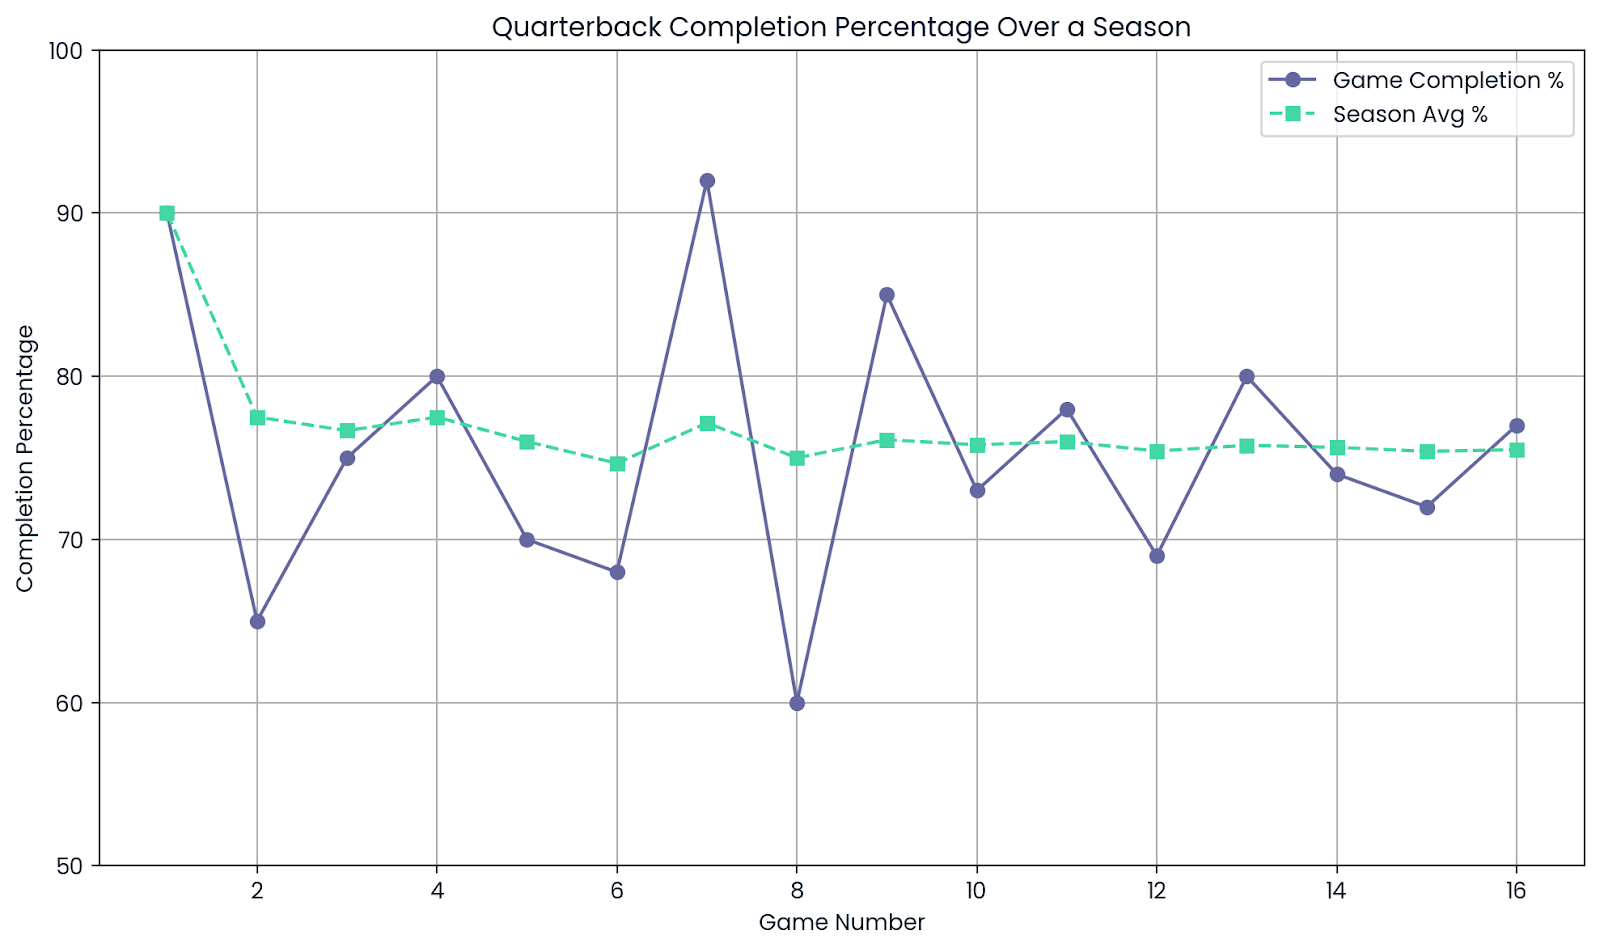
Average. Image by Author.
Insurance industry risk pooling
Insurance companies don’t know exactly how much one person will cost them. Some people use no medical care at all, while others do.
But when you look at a large group of people, those ups and downs balance out. By pooling risk across thousands of policyholders, insurers can predict the average cost more accurately.
This lets them set fair prices (premiums) while staying financially stable.
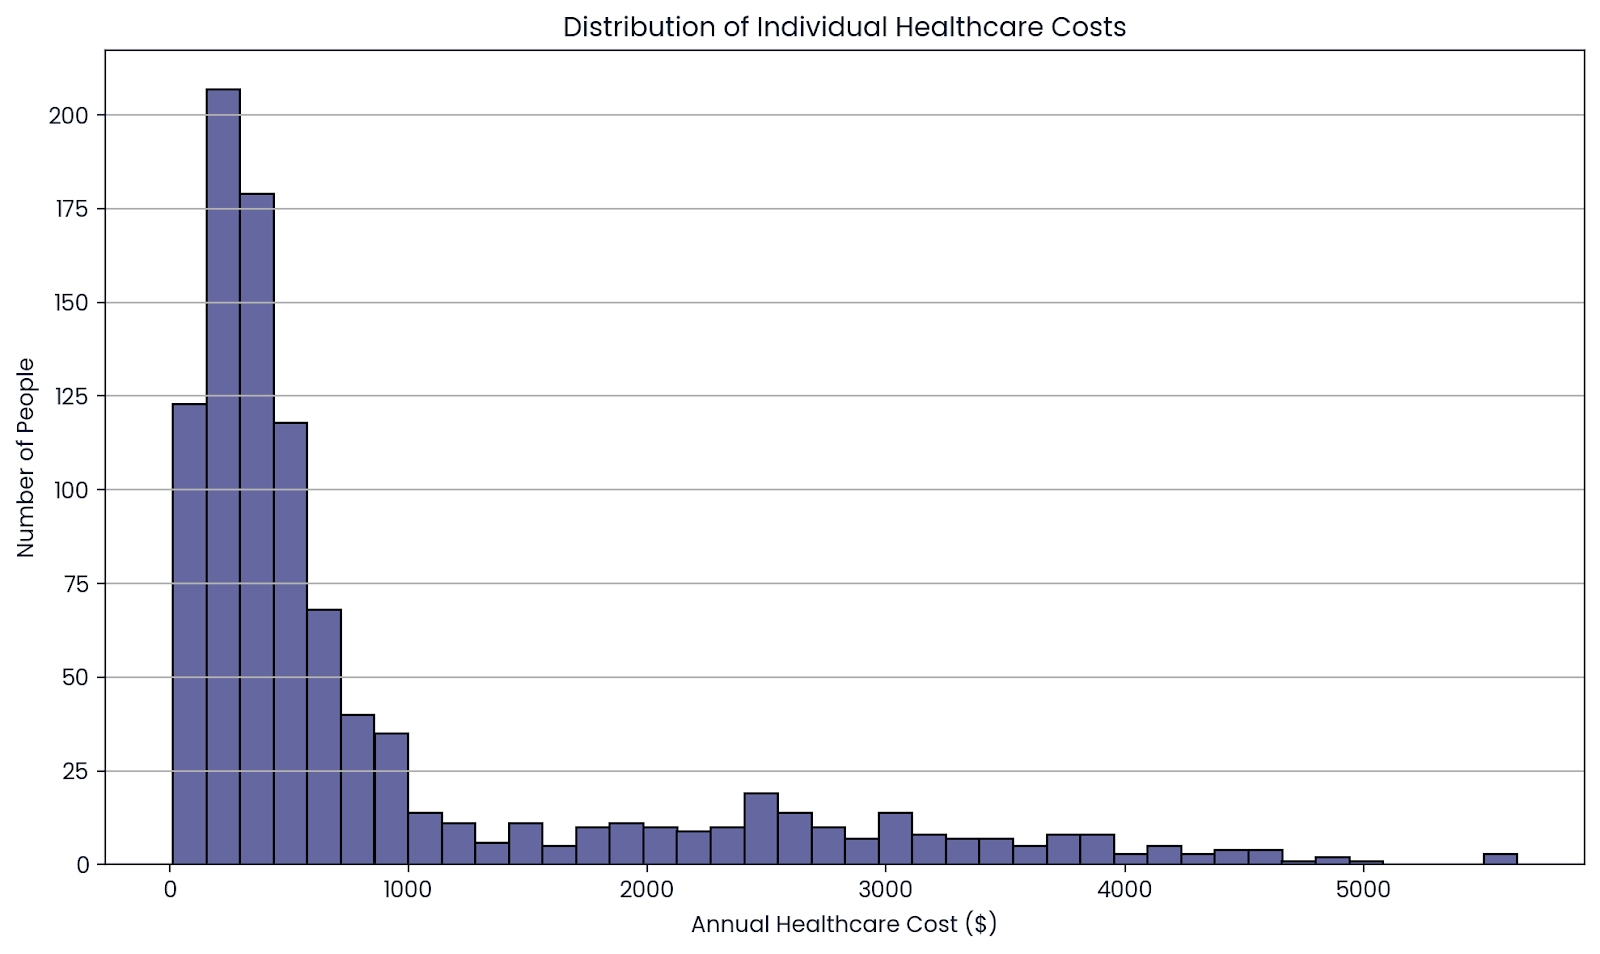
The average over many people shows the true cost. Image by Author.
Casino games and house edge
Casinos build a slight edge in every game. If you play blackjack, you might win five hands in a row or lose ten. But over thousands of games, the average outcome favors the casino.
For example, if the house edge is 0.5%, then over time, the casino expects to earn 50 cents for every $100 bet on average. That may not happen in a short session, but over millions of plays, it adds up exactly as expected.
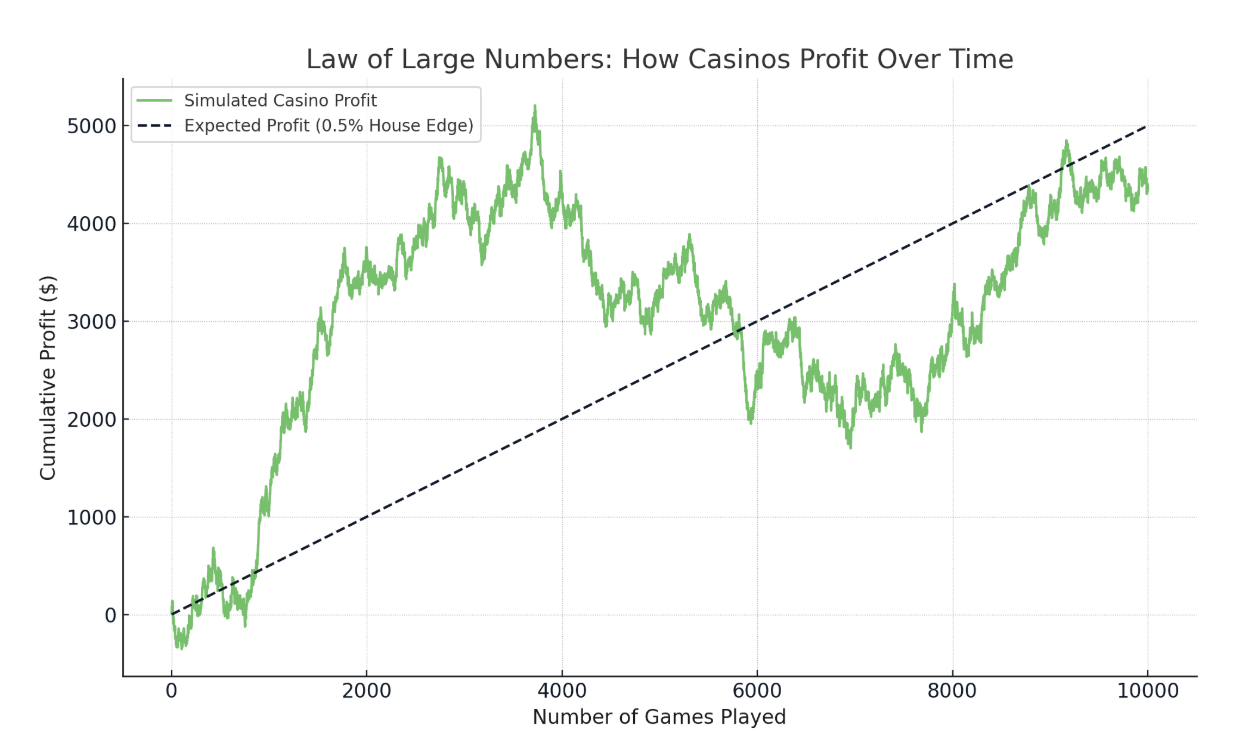
Casino’s edge wins out with more bets. Image by Author.
A/B testing in tech companies
Suppose a company wants to test two versions of a website button: Button A and Button B. After 20 people try each, Button A looks better. But that’s not enough data to trust the result.
Now let 20,000 users see both. As the sample size grows, the average click rates become more reliable, and the better-performing button becomes clear.
That’s why companies rely on large samples for A/B testing. The law of large numbers helps them avoid false positives and make smarter choices.
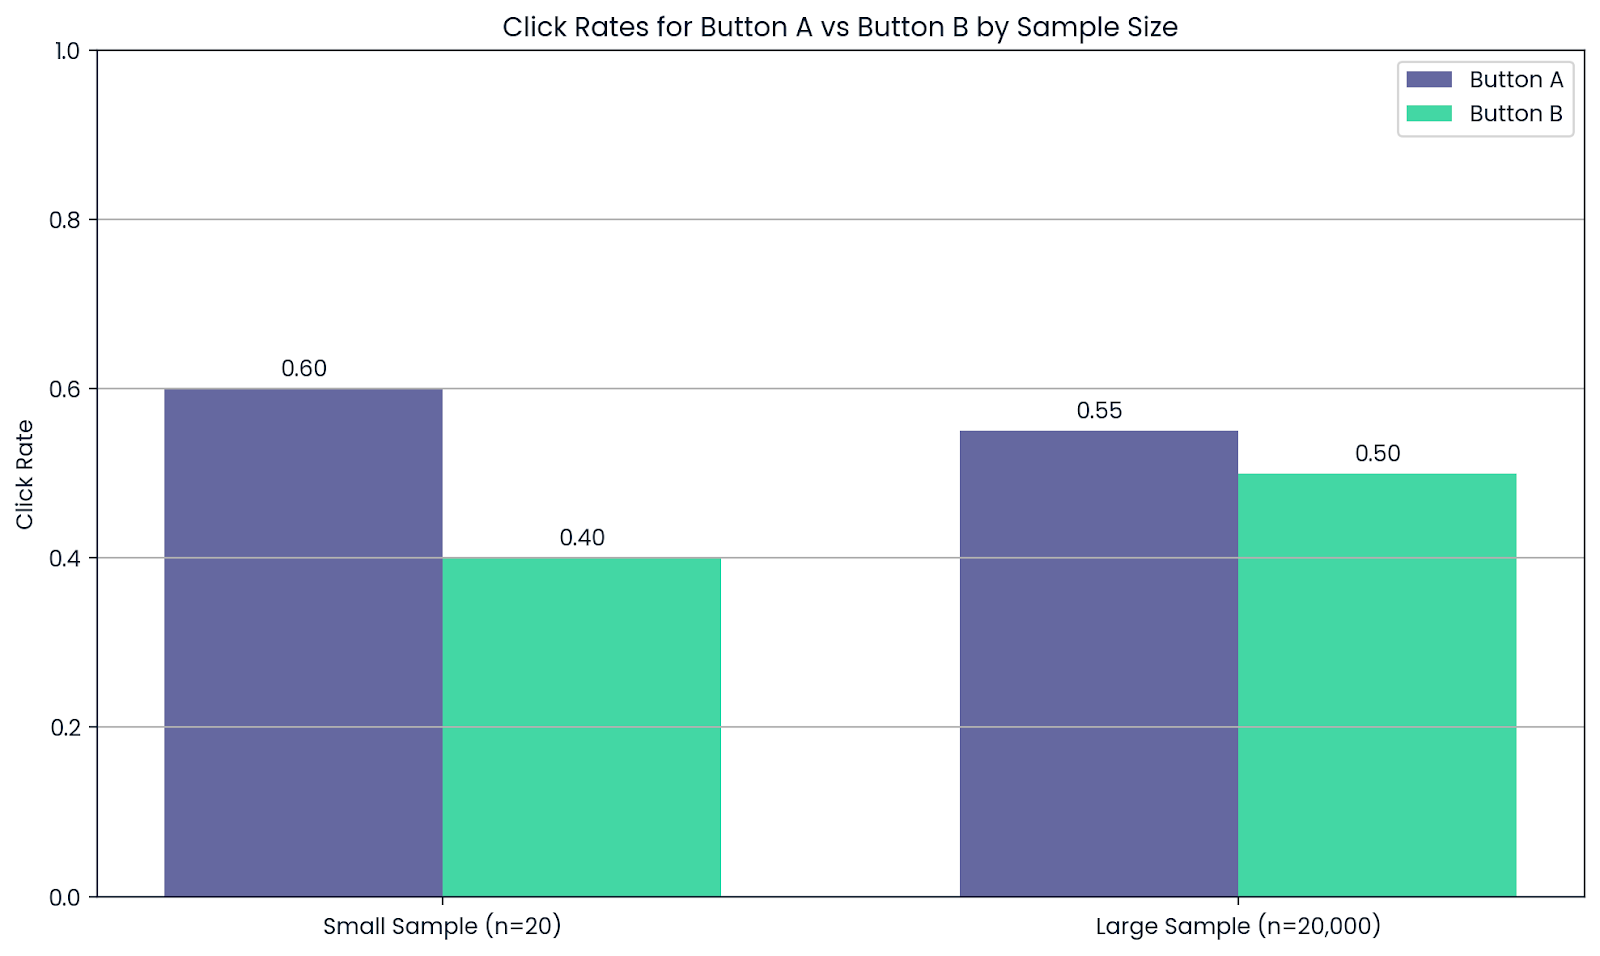
More people tested means more reliable results. Image by Author.
Why the Law of Large Numbers Matters
In data science, we often use data to train models. But if the dataset is too small, a few unusual values can skew the results.
For example, you're testing a new recommendation algorithm using only 10 users. If one user clicks everything and another clicks nothing, your average performance might look great or terrible. That doesn’t mean the model is good or bad; it means your sample is too small to trust.
The law of large numbers tells us that as we gather more data, random fluctuations even out, and the average result becomes more reliable. That’s why large datasets give better predictions and insights.
You also see this in simulations. Take Monte Carlo methods, for example. These involve running the same scenario thousands of times using random inputs. The law of large numbers guarantees that the more trials we run, the closer the average outcome gets to the true expected result.
In machine learning, the law shows up in two important ways:
- Model training: A model trained on a small, unbalanced dataset might learn patterns that don’t reflect the real world. But with enough diverse data, the model learns what actually works.
- Model testing: Testing a model on only 50 users might give wildly different results than testing it on 5,000. A larger test set gives a clearer picture of how the model will perform once it’s deployed.
In short, more data means less noise and better decisions.
Common Misconceptions
The law of large numbers is often misunderstood when people expect it to work instantly.
If you believe outcomes will "even out" quickly, that’s a mistake. For example, if you flip a coin and get heads five times in a row, you might think tails are now "due" to balance things out. But that’s not how probability works.
This thinking is known as the gambler’s fallacy: the false idea that past results influence future ones in a truly random process. In reality, each coin flip is still a 50/50 chance, no matter what happened before.
The law of large numbers doesn’t promise that randomness will smooth out in the short run. Instead, it tells us that over many, many trials, the average outcome moves closer to the expected value. In the case of a fair coin, that means roughly half heads and half tails eventually, not immediately.
Short streaks or unusual patterns can still happen along the way. That’s just how randomness looks in small samples. The law only becomes meaningful when you zoom out and look at the big picture.
How It Relates to Other Concepts
While the law of large numbers tells us that the sample average gets closer to the true average as the sample size grows, the central limit theorem (CLT) takes it further. It explains what the distribution of those averages looks like.
According to the CLT, if you take many large samples and calculate their means, those means will form a bell-shaped curve (a normal distribution) no matter what the original data looked like.
Both are important in statistics but they describe different things: one focuses on accuracy, the other on shape.
|
Type of Convergence |
What it Means |
Related Concept |
|
Convergence in probability |
The sample mean gets close to the true mean as the sample size increases |
Law of large numbers |
|
Convergence in distribution |
The distribution of sample means approaches a normal curve as sample size grows |
Central limit theorem |
Key Takeaways
The law of large numbers highlights a core principle in data analysis: larger sample sizes give more stable and accurate results, but only when the data is representative.
Although big datasets reduce the effects of random variation, more data isn’t always better. If the data is biased or unbalanced, even a massive dataset can produce misleading outcomes. To draw valid conclusions, you need both volume and quality.
If you’d like to build a stronger foundation in these concepts, the Statistical Thinking in Python course is a great place to start. From there, explore the Gaussian distribution to understand how the law of large numbers connects to other key tools in statistics and machine learning.
I'm a content strategist who loves simplifying complex topics. I’ve helped companies like Splunk, Hackernoon, and Tiiny Host create engaging and informative content for their audiences.
FAQs
How many samples do I need for LLN to take effect?
There’s no universal number. It depends on the variance of the data. High-variance data requires more samples for convergence.
What’s the difference between convergence "in probability" and "almost surely"?
"In probability" means the sample mean is likely close to the true mean; "almost surely" means it will almost certainly get there over time.
Can the Law of Large Numbers be applied to quality control in manufacturing?
Yes, large sample inspections help identify the true defect rate, improving decision-making and product consistency.

