
Course
Foundations of Inference in R
4 hr
38.6K
If you’ve ever worked with inferential statistics, especially hypothesis testing and regression, you’ve probably been introduced to the p-value. And if you’ve ever worked with p-values, you likely know, or at least have a hunch, that p-values are vulnerable and can be manipulated, and you would be right.
In fact, this manipulation has got a term named after it. That is p-hacking. Sometimes, it is also referred to as data dredging, data snooping, data fishing, and inflation bias. And this is what this article dives into.
First of all, let’s quickly refresh our memories on what a p-value is. The ‘p’ in p-value stands for probability. Specifically, the p-value is the probability of observing results as extreme as the ones obtained, assuming the null hypothesis is true. This incorrect rejection is also referred to as Type I Error, or the false positive error. Typically, it is obtained to be compared with the significance level (denoted as α), which is the tolerated probability of rejecting the null hypothesis when it is true.
Logically, it follows that if the p-value is greater than the significance level, we fail to reject the null hypothesis and stick to it. On the other hand, if the p-value is less than or equal to the significance level, we can reject the null hypothesis in favor of the alternative one, and in this case, we say that the results are statistically significant.
If any of this very short refresher on p-values does not make sense to you, don’t worry! You can take our Introduction to Statistics theoretical course and quickly develop a grasp on the necessary fundamentals.
Reaching “statistically significant” results sounds a lot like success and, therefore, is tempting. In business, it would mean that you have something new, interesting, or desirable to report on. In academia, you have discovered something and that something can then be published in journals.
And since it is the key to this whole world of excitement, data professionals and researchers are tempted to overfocus on the p-values of their studies, and consider nothing else, even the significance level. And since the most commonly considered significance level over decades has been 0.05, it has been an easy convention to say that if you reached a p-value below 0.05, you should take off your coat and celebrate right away.
As a further result, some researchers fall into the fault of p-hacking, sometimes intentionally, but usually unintentionally, by applying methods that can lower the p-value to be statistically significant, in cases when proper testing would have shown otherwise.
Whether intentionally or not, there are many ways things can go wrong, leading to p-hacking. The methods that lead to p-hacking can be called p-hacks, and they can happen at any phase of the experiments.
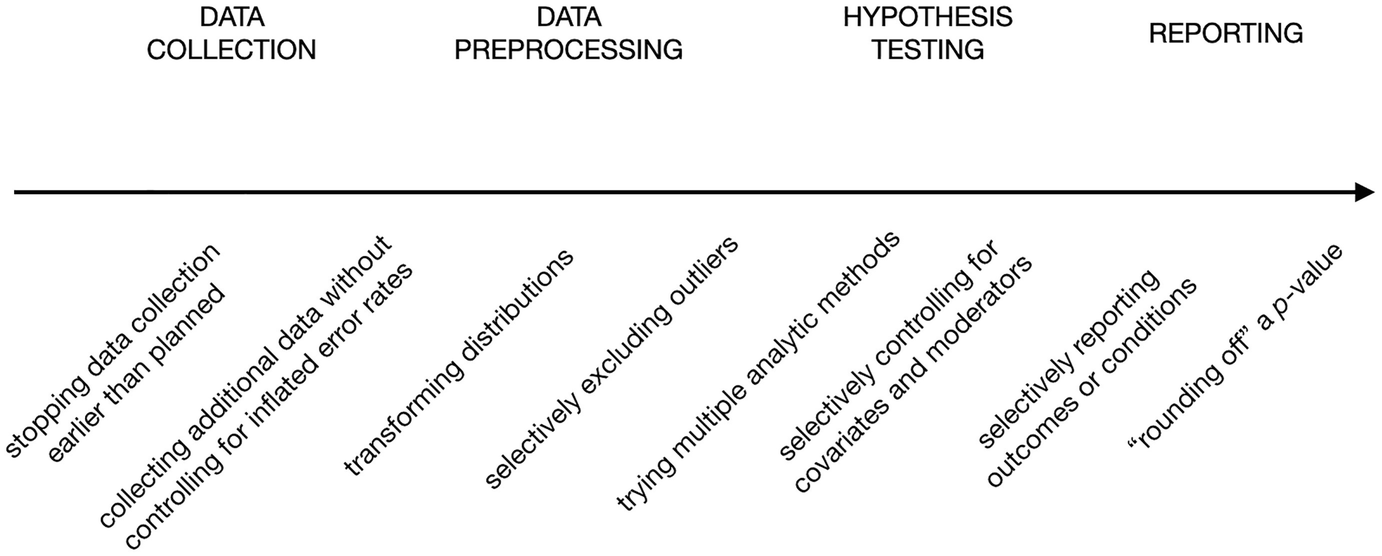
In their book chapter The Myriad Forms of p-Hacking, Dorota Reis and Malte Friese provide a non-exhaustive list of p-hacks over the different stages of experiments from data collection, all the way to reporting, represented in the following graph.
Examples of p-hacks. Source: Avoiding Questionable Research Practices in Applied Psychology.
Let’s see what each one means from the left to the right:
Notice that most of these p-hacks depend on running the experiment over and over, each time tweaking what should be a pre-determined base for the experiment.
But even without the tweaking, the rerunning of the same experiment itself and reporting the result only when it is statistically significant can be a p-hack, because there is always a chance that if any experiment is run enough times, it would return a low p-value at some point. The comic below from xkcd illustrates this idea.
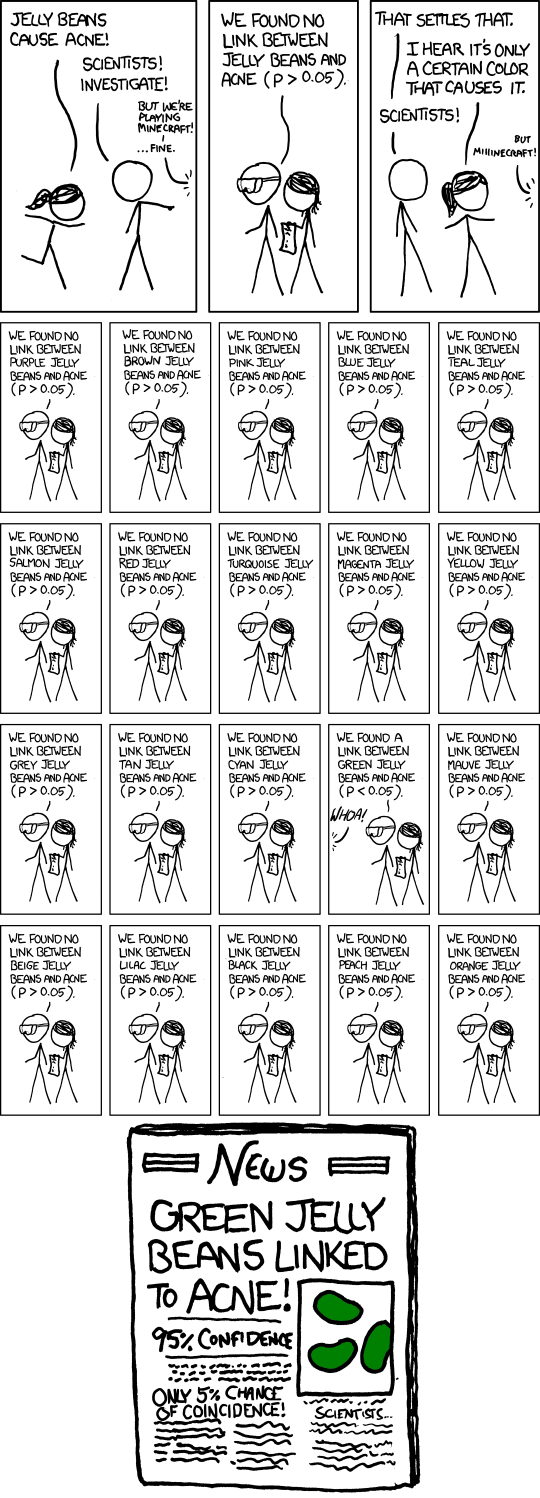
“Significant” comic. Source: xkcd.
P-hacking is a very widespread phenomenon. In the early 2010s, a lot of reviewing studies started finding out that a great percentage of research published in respected journals of various fields is likely to be p-hacked, especially in the fields of psychology and medicine, but also in social sciences and humanities.
For example, in 2015, a study led by a scholar at the University of Verginia reviewing 100 psychology studies published in top journals in 2008, found out that less than half of these studies were replicable. The lack of reproducibility means that the studies, when rerun, do not lead to the same result, sometimes due to p-hacking.
Another project that examined cancer studies found that only 50 experiments out of 193 are replicable. Even earlier in 2009, a study noted a suspicious number of experiments in the field of neuroscience reporting unusually high correlations between emotions, personality, social cognition, and the activity of the brain through fMRI. After surveying the authors of these experiments, it turned out that they depended on a strategy of selectively choosing subsets of the data, and reporting on the ones that resulted in a significant result, a p-hack similar to what we called post-hoc replacement.
The findings of these reviewing studies uncovered how p-hacking, in addition to other questionable research practices, is causing the grounds of the long-respected scientific research to be shaky and full of holes. A crisis that has been called the replicability crisis, which is still ongoing amid many discussions and efforts to find a way out of it.
So, why is p-hacking a problem after all?
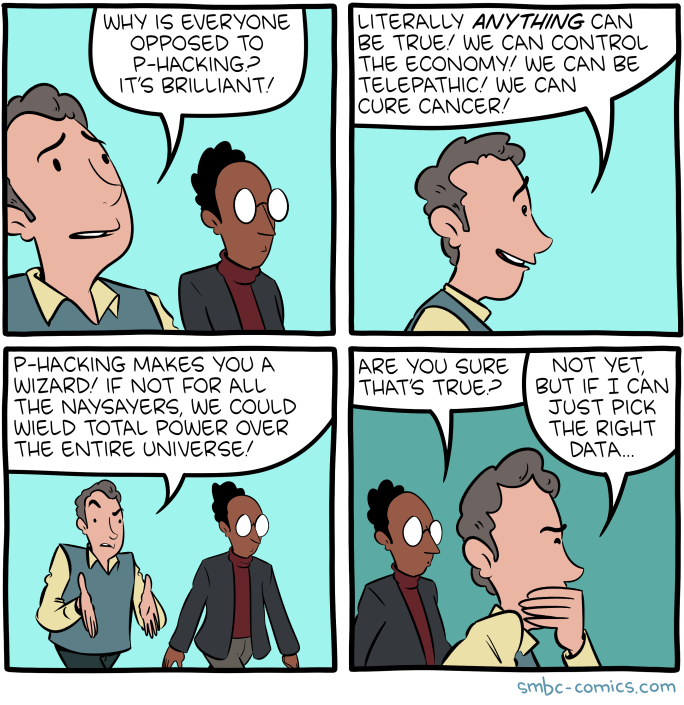
“P-hacking makes you a wizard”. Source: SMBC Comics.
The question may sound too obvious to answer, but a breakdown of the reasons why p-hacking is wrong and unethical can also help us better understand the “significance” of the falsified significance problem.
P-hacking at its core is nothing but the result of manipulating the methodology or manipulating the results. If done intentionally, this would simply be like lying for no good reason other than self-benefit (like getting published or acknowledged). If done unintentionally, it would be like going down the wrong road and eventually reaching nothing but the mirage of false positives.
Experiments, whether in the scientific domain or in business, have consequences. They are done to make decisions or to further build on their results. If the experiment results are fabricated, the dependent decisions would be unfounded, and sometimes that can lead to disastrous consequences.
For example, research in sensitive domains like oncology and neurology can collectively contribute to the development of treatments and medicines. It would be a disaster if some of the founding research was manipulated.
In business, wrong decisions can go in many directions, from launching a failing product, to exhausting resources, to getting someone fired, to bankruptcy. A simple p-hack can create a butterfly effect.
The replicability crisis has led to wide skepticism about science as a whole, expressed even within the political discourse. While critical thinking can always be useful even when receiving scientific findings, dismissing every empirical finding can lead to a despair of ignorance and unfounded decisions.
In business, on a smaller scale, p-hacking and similar questionable practices can lead business leaders to revert from making data-driven decisions, back to depending only the hinge and intuition, which is exactly the opposite of what the domain of data science as a whole promises and can actually fulfill.
Human knowledge is all based on its accumulative nature. Every little experiment is a building block that paves the way for a bigger knowledge structure. When an increasing number of these building blocks become shaky due to questionable practices like p-hacking, the potential of such accumulation becomes ill-fated. Even the simple practice of finding previous literature to build a new experiment on becomes a tricky mission like finding a way through a land of mines.
Based on what we now know about p-hacking and its methods, we can infer some of the red flags that can help us detect p-hacks. Most of these red flags still require a curious mind, critical thinking and introspecting eyes to notice. Some even depend on extensive domain knowledge.
Sensational experiment results are usually too fishy to take without a grain of salt. Usually picked up by the press and social media trends, studies declaring stuff like “chocolate can lead to weight loss” simply doesn’t sound ready to be taken for granted.
In business, a test promising 100% increase in profit due to the introduction of a small feature in a website can be considered similarly sensational.
When encountering such a study, if they are of concern to you, always double check on the methodology and the results before accepting the findings.
Beware of experiments that are not clear on their methodology or that do not declare some methodology components. Being open about the initial hypotheses, the significance level, the sample size, the collected variables, the chosen test type and the data preparation steps are all essential for a sound scientific procedure. Being unclear about any of these components is a red flag.
If the experiment data preparation includes variables transformation, double-check the reason behind the measure, as the justification should be declared. If it is not, or if it is unconvincing, then this can be a direct indicator of p-hacking.
A small sample size reduces the statistical power of the study, increasing the risk of false negatives. However, when combined with selective reporting or p-hacking, low-powered studies can also contribute to a higher rate of false-positive findings in the published literature.
In some domains, small sample sizes are acceptable and common, like in clinical research, environmental studies, engineering and quality control. But generally speaking, larger sample sizes lead to better inference, and therefore less likelihood of false-positives and untrue significant p-values.
In any case, if a small sample size is not justified, this may indicate a lack of statistical power, which increases the risk of false-positive findings. In some cases, I think it may also hint at early stopping, the specific p-hacking practice I mentioned earlier, where data collection ends once significance is reached rather than when the planned sample size is met.
The effect size measures the strength or magnitude of the relationship between variables, giving context to the statistical significance of a result. If a study reports statistical significance but fails to provide a clear or meaningful effect size, it raises suspicion.
A p-value might indicate that the result is unlikely due to chance, but without an effect size, it's hard to determine the practical significance of the findings. In p-hacked studies, being unclear about the effect size may indicate that the researchers overfocused on achieving statistical significance, regardless of the other considerations
When a study’s results deviate significantly from the original hypothesis, it should raise questions. This could be a sign that researchers modified their hypothesis or methods after collecting the data to match the results—a practice known as HARKing (Hypothesizing After Results are Known).
For example, if an experiment claims to have tested a specific hypothesis but the final analysis seems to focus on unrelated variables or outcomes, this may suggest p-hacking. Always compare the stated hypothesis with the final results to ensure they align.
An unusually high effect size can be a red flag for p-hacking. In many cases, real-world effects are small to moderate, especially in fields like psychology, medicine, or social sciences. Just like judging proper sample size, making sense of how an effect size is plausible requires intensive domain expertise.
If a study reports an unusually large effect size, it could indicate that the data has been selectively manipulated or the sample is biased in some way. Researchers might intentionally or unintentionally exclude data that would reduce the effect size to make their findings appear more impressive than they actually are(the post-hoc replacement p-hack).
When the reported p-value is just below the significance threshold (e.g., p = 0.049 in a study where p < 0.05 is the cutoff for significance), it may indicate that the researchers engaged in p-hacking.
This is because repeatedly running tests or tweaking variables can lead to a result that barely crosses the significance threshold by chance. A pattern of results that consistently hover just below the significance level suggests that the researchers may have stopped data collection once they achieved their desired result (early stopping), or selectively reported certain analyses (post-hoc replacement).
One of the strongest indicators of p-hacking is when a study's findings are not replicable. If independent researchers are unable to replicate the results of a study using the same methodology, it may indicate that the original findings were the result of p-hacking or selective reporting.
Replicability is a cornerstone of scientific integrity, and results that cannot be consistently reproduced suggest that the original analysis may have been flawed or manipulated.
By reversing the above red flags, we can also come up with ways of preventing p-hacking. These ways have been already arising in the discourse of the scientific community over the last decade as a response to the replicability crisis.
A solid understanding of statistical principles is essential for preventing p-hacking. When analysts have the necessary knowledge, they’re better equipped to avoid common traps, such as misinterpreting p-values or improperly handling multiple comparisons.
For instance, in A/B testing for a website feature, a well-informed analyst will understand that the p-value is not the end goal, as even if the test turned out to have a low p-value, it can still have an effect size that is not large enough, and therefore no practical significance. Understanding the difference between statistical and practical significance can help analysts not to overfocus on the p-value, possible leading to p-hacking practices, and therefore decreases the likelihood of manipulating the results for a more favorable outcome.
Pre-registration in scientific research involves outlining the research or testing plan, including hypotheses, methods, and analysis techniques, before collecting any data. This process prevents p-hacking by locking in decisions about how the analysis will be conducted, making it harder to alter the analysis post hoc to achieve a significant result.
In business, similar practices can be done even on the level of data teams. For example, before running an experiment to measure the impact of a new pricing model, the team can pre-document and internally declare the hypothesis, specifying the variables that will be tested (e.g., revenue, customer acquisition rate), the significance level, and the sample size. This ensures that team sticks to the original plan and doesn’t change the analysis after seeing the initial results, avoiding practices of post-hoc replacement and cherry-picking only the data that shows a favorable outcome.
Open science refers to making data, methods, and analysis available for others to review and replicate. In business, while the term "open science" may not be directly used, similar transparency practices are important for ensuring the integrity of analyses.
For instance, a company conducting a market analysis can share its raw data and analysis steps internally with other teams, auditors or concerned stakeholders, or to systematically document it for future replications. This transparency discourages p-hacking because anyone can check for discrepancies or flaws in the methodology. In an organization, being open about methods and results fosters accountability and helps ensure that conclusions are drawn from solid, reproducible data.
Data preparation and transformation steps should always be well-justified. Without clear justification, removing outliers or transforming variables can be used to manipulate results and create a false narrative.
For example, when analyzing customer purchase data, an analyst might exclude certain data points (e.g., extreme outliers) that don’t seem to fit the model. However, without a valid reason—such as identifying them as true anomalies rather than part of the normal distribution—this could be a form of p-hacking. To prevent this, every data preparation step (like excluding certain time periods or applying log transformations) should be explicitly justified in the analysis report, ensuring transparency.
Beyond statistical significance, it’s crucial to report and interpret effect sizes. This ensures that the results are meaningful in practical terms and aren’t just capitalizing on statistical significance due to large sample sizes.
In business, consider an A/B test where a new product description boosts conversion rates by 0.5%, but the sample size is large enough to make the result statistically significant. Without context, this change could be misinterpreted as meaningful. However, by focusing on the effect size and asking whether a 0.5% increase justifies the cost of changing all product descriptions, companies can avoid making decisions based solely on p-values.
We said that running the same test (or different tests) on the same data can lead to returning a significant result by chance, and therefore, we considered it as a p-hack. But actually, running the same test on the same data multiple times can be a good measure to prevent and beware of p-hacking, if -and only if- it is combined with correction methods, which are statistical techniques adjust for the fact that multiple comparisons are being made. The two most common types of correction methods are the Bonferroni correction method and the Benjamini-Hochberg (BH) procedure.
The Bonferroni involves adjusting the p-value threshold (the significance level) downward, dividing it by the number of tests performed. While effective in reducing the chances of false positives., it can be overly conservative, increasing the likelihood of false negatives.
In contrast, the BH procedure is one of the False Discovery Rate (FDR) control techniques that aim to strike a balance between the likelihood of the two types of errors. Briefly put, the BH procedure works by first ranking all the p-values from multiple tests in order from smallest to largest. Each p-value is then compared to a threshold that increases with its rank. The largest p-value that is still below its threshold is identified, and all p-values up to this point are considered significant.
In a business context, if a company is testing several versions of a landing page, it’s tempting to run many A/B tests and stop when one version appears to perform significantly better. To avoid this, the analyst can apply corrections to account for the multiple tests being run. By doing so, they ensure that any significant findings aren’t just the result of repeated testing.
Lastly, it’s important to acknowledge and report non-significant results rather than discarding them. There have been calls in the science community to allow publishing experiments with insignificant results as long as they follow a rigorous pre-registered methodology, because the finding of no finding can still be a finding! Similar wisdom can be followed in business.
For example, if a marketing campaign doesn’t significantly impact sales, a company should still report and consider this finding. It provides valuable information and prevents skewed reporting that might lead to unjustified business decisions. Being open about non-significant results contributes to a more honest analysis and avoids the temptation to manipulate data for the sake of showing success.
In this article, we deeply explored the world of p-hacking, where the p-value can be vulnerable to manipulation. We looked into the various p-hacks, how they can be detected and how they can be prevented.
As you can see, and as we mentioned, a great part of being aware of p-hacking is to have a strong statistical knowledge. You can achieve this through our various courses on statistics, like our theoretical Introduction to Statistics, or our practical Introduction to Statistics in Google sheets, Introduction to Statistics in Python and Introduction to Statistics in R.
Learn with DataCamp
Course
Course
Course
Tutorial
Patrick David
Tutorial
Jachimma Christian
Tutorial
DataCamp Team
Tutorial
Sayak Paul
Tutorial
Vinod Chugani
Tutorial
Abid Ali Awan