
Implementing a Semantic Layer with dbt: A Hands-On Guide

Learn how to build a semantic layer with dbt, turning raw data into consistent metrics for analytics and BI tools!
Jan 22, 2025  · 18 min read

Many modern companies rely on semantic layers to bridge the gap between raw data stored in data warehouses like Snowflake and insights in dashboards or reports. 

A semantic layer is an abstraction that defines consistent metrics, measures, and dimensions for analytics and reporting.

In this tutorial, we will explore how to implement a semantic layer using dbt (data build tool), a popular data transformation and modeling framework. This guide includes practical examples and insights to help you master the concept.

What is a Semantic Layer, and Why is it Important?

A semantic layer translates raw data into consistent, reusable metrics and dimensions, simplifying data analysis. It is a tool for maintaining uniformity across teams and tools.

Benefits of a semantic layer

  • Consistent data definitions: Ensures that business metrics like revenue, churn rate, YoY growth, average order value, etc., are uniformly defined. This eliminates confusion caused by different teams using inconsistent definitions and helps maintain trust in the data across the organization.
  • Enhanced collaboration: Facilitates better communication and alignment between technical and non-technical teams. By providing a unified data layer, technical teams can focus on data accuracy while business teams leverage clear and accessible metrics for strategic decisions.
  • Accelerated time-to-insight: Reduces ambiguity, enabling faster decision-making. With a semantic layer, stakeholders can quickly access and analyze reliable metrics, minimizing the time spent reconciling data or resolving discrepancies.

Why dbt is Ideal for Building a Semantic Layer

Let’s see what makes dbt the perfect tool for enabling data and analytics engineers to build a semantic layer.

A screenshot showing architecture of modeling with dbt

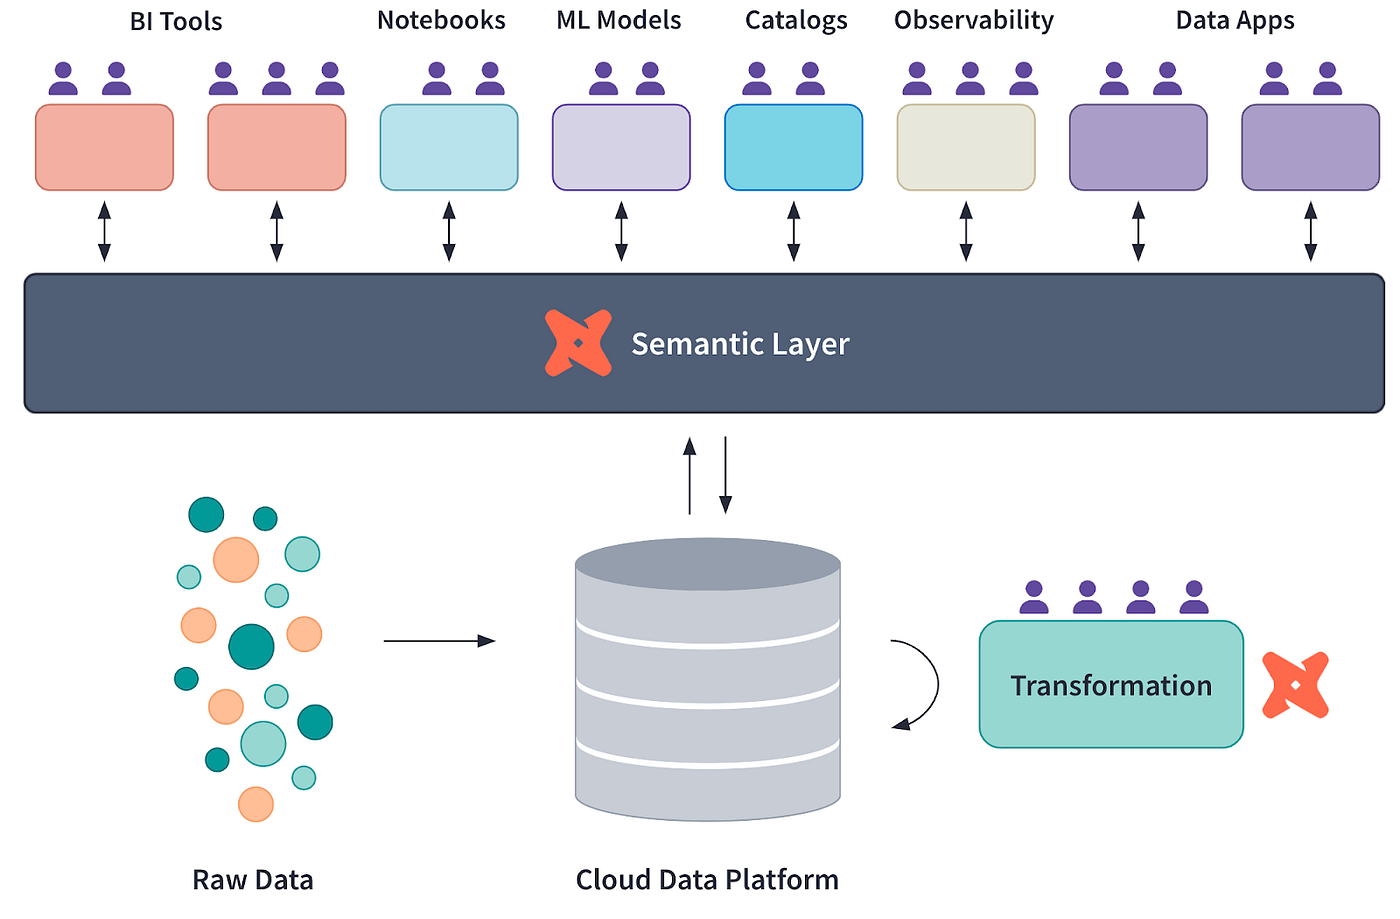
dbt Semantic Layer conceptual diagram, courtesy of dbt Labs

Modular data modeling

dbt allows you to break down complex data transformations into reusable, modular models. These models can be layered hierarchically, where foundational data models feed into higher-level analytical ones. 

This approach makes the pipeline maintainable and enables teams to collaborate more effectively by isolating changes to specific models without impacting the entire system.

To learn more about dbt’s foundational concepts and best practices for data modeling, check out the dbt Tutorial: 7 Must-Know Concepts for Data Engineers. It offers insights that complement the strategies outlined here.

Centralized metric definitions

With dbt, business logic and metrics are defined in one place, ensuring consistency across various analytics tools. By using dbt’s metrics feature, you can define KPIs like revenue, conversion rates, or churn once and use them across dashboards, reports, and analyses without redefinition. This reduces discrepancies and ensures data integrity.

Version control and documentation

dbt’s integration with Git facilitates robust version control, enabling you to track and audit changes over time. Coupled with its auto-generated documentation, dbt creates a living, accessible reference for all data transformations and metrics. This results in transparency and allows new team members to onboard quickly by exploring the documented data pipeline.

Integration with BI tools

dbt works with BI platforms such as Looker, Tableau, and Mode, allowing for integration of the semantic layer into visualization tools. Using dbt exposures, you can directly link dbt models to BI dashboards, ensuring that any updates in the data models are reflected in the analytics without manual intervention.

Become a Data Engineer

Become a data engineer through advanced Python learning
Start Learning for Free

Setting Up Your dbt Project

Usually, dbt sits on top of cloud data warehouses like Snowflake or Google BigQuery. However, to keep things simple for this tutorial, we will connect to a DuckDB database locally.

1. Prerequisites

  • Install Python on your machine if it has not already been installed.

2. Installing the necessary tools

Use pip to install the dbt CLI:

pip install dbt-core

Install DuckDB via pip:

pip install duckdb

Install DuckDB adapter via pip:

pip install dbt-duckdb

3. Initializing the dbt project

Create a new dbt project:

dbt init project_name

This command will create a project in your current directory, which will look like this:

project_name/
├── analyses/
├── logs/
├── macros/
├── models/
├── seeds/
├── snapshots/
├── tests/
├── .gitignore
├── dbt_project.yml

4. Setting up the DuckDB connection

Edit the profiles.yml file, usually located in the ~/.dbt/ folder. If it doesn’t exist, create one:

project_name:  # This matches the name in dbt_project.yml file
  target: dev
  outputs:
    dev:
      type: duckdb
      path: path/to/demo_database.duckdb  
      threads: 1

The profiles.yml contains the pointer to the location of the .duckdb database file, which you should indicate in the path

You can either create a new database or download a small sample one from here. In the next section, I will use the duckdb-demo.duckdb file from the same source. 

To create a new duckDB database file, simply run the following:

import duckdb
duckdb.connect('/path/to/your/duckdb/database.duckdb')

5. Testing the connection

Now, we can test by running dbt debug to check if everything works. Make sure you are in the project folder before you run the command:

cd /path/to/your/project/
dbt debug

If everything is set up correctly, you will get something like this in return (all paths are redacted for privacy reasons):

15:20:00  Running with dbt=1.9.1
15:20:00  dbt version: 1.9.1
15:20:00  python version: 3.11.5
15:20:00  python path: ...
15:20:00  os info: Windows-10-10.0.22631-SP0
15:20:00  Using profiles dir at ....
15:20:00  Using profiles.yml file at ...
15:20:00  Using dbt_project.yml file at ...
15:20:00  adapter type: duckdb
15:20:00  adapter version: 1.9.1
15:20:00  Configuration:
15:20:00    profiles.yml file [OK found and valid]
15:20:00    dbt_project.yml file [OK found and valid]
15:20:00  Required dependencies:
15:20:00   - git [OK found]

15:20:00  Connection:
15:20:00    database: demo_database
15:20:00    schema: main
15:20:00    path: ...
15:20:00    config_options: None
15:20:00    extensions: None
15:20:00    settings: {}
15:20:00    external_root: .
15:20:00    use_credential_provider: None
15:20:00    attach: None
15:20:00    filesystems: None
15:20:00    remote: None
15:20:00    plugins: None
15:20:00    disable_transactions: False
15:20:00  Registered adapter: duckdb=1.9.1
15:20:01    Connection test: [OK connection ok]

Creating a Semantic Layer with dbt

Congratulations on making it this far! You've successfully set up your first dbt project.

Now, let’s see how to create a semantic layer on top of a database. To do that, you can either import your own data from CSV to DuckDB or download a small (5MB) sample database file from here.

Then, we can write a simple Python script to explore what this database file contains:

import duckdb

# Connect to the database
conn = duckdb.connect("duckdb-demo.duckdb")

# Get list of tables
tables = conn.execute(
    "SELECT table_name FROM information_schema.tables WHERE table_schema='main'"
).fetchall()

print(f"\nNumber of tables in database: {len(tables)}")

print("Table names:")
for t in tables:
    print(f"- {t[0]}")

print("\nTables in database:")
for table in tables:
    print(f"- {table[0]}")

    # Get schema for each table
    schema = conn.execute(f"DESCRIBE {table[0]}").fetchall()
    print("\nSchema:")
    for col in schema:
        print(f"  {col[0]}: {col[1]}")

    # Preview data
    data = conn.execute(f"SELECT * FROM {table[0]} LIMIT 5").fetchall()
    print("\nFirst 5 rows:")
    for row in data:
        print(f"  {row}")
    print("\n---")

# Close connection
conn.close()

Output (truncated for brevity):

Number of tables in database: 17
Table names:
- bank_failures
- boxplot
- calendar
- ...

Tables in database:
- bank_failures

Schema:
  c1: BIGINT
  Bank: VARCHAR
  City: VARCHAR
  State: VARCHAR
  Date: DATE
  Acquired by: VARCHAR
  Assets ($mil.): DOUBLE

First 5 rows:
  (1, 'Douglass National Bank', 'Kansas City', 'Missouri', datetime.date(2008, 1, 25), 'Liberty Bank and Trust', 58.5)
  (2, 'Hume Bank', 'Hume', 'Missouri', datetime.date(2008, 3, 7), 'Security Bank', 18.7)
...
…

This database has 17 tables. However, we are only going to use the bank_failures table for this tutorial. This table contains historical financial details of failed banks in the US.

1. Defining the SQL models

SQL models are the foundation of any dbt project. They represent the structured transformations of raw data into a more analytical format. 

For this tutorial, we will define two SQL files under the models/ folder. 

Create a new file under the models folder of your project named base_bank_failures.sql:

SELECT *
FROM bank_failures

This file directly pulls raw data from the bank_failures table. It acts as the base model, which subsequent models can reference.

After that, create another file named clean_bank_failures.sql:

SELECT
    State,
    COUNT(*) AS total_failures,
    SUM("Assets ($mil.)" ) AS total_assets
FROM
    {{ ref('base_bank_failures') }}
GROUP BY
    State

This file builds on the base_bank_failures model (using the ref() function) to aggregate and clean the data, preparing it for analysis. It summarizes the total failures and assets by state.

2. Creating a metrics.yml file

The metrics.yml file defines centralized, reusable metrics that ensure consistency across analyses and dashboards.

In our case, it will describe metrics such as total_assets and avg_assets_per_failure, making them available for use in BI tools and other queries:

version: 2
models:
  - name: clean_bank_failures
    description: "Aggregated data about bank failures."
    columns:
      - name: State
        tests:
          - unique
      - name: "Assets ($mil.)"
    metrics:
      - name: total_assets
        label: Total Assets
        type: sum
        expression: "Assets ($mil.)"
        description: "Total assets of failed banks, aggregated by state."

      - name: avg_assets_per_failure
        label: Average Assets per Failure
        type: average
        expression: "Assets ($mil.)"
        description: "Average assets for each bank failure."

3. Creating an exposures.yml file

The exposures.yml file links your dbt models to external tools like Tableau or Looker. It documents these connections, ensuring traceability and consistency.

This file specifies that the clean_bank_failures model is used in a Tableau dashboard, providing details about the owner and the dependency:

exposures:
  - name: tableau_dashboard
    type: dashboard
    url: https://tableau.yourcompany.com/workbook
    owner:
      name: Data Team
      email: datateam@yourcompany.com
    depends_on:
      - ref('clean_bank_failures')

Building and Testing the Semantic Layer

To successfully validate and build your dbt project, here are some useful commands you can use:

1. Build the models: Run the dbt build command to materialize all models, apply tests, and execute seeds and snapshots. This command combines the functionalities of dbt run and dbt test:

dbt build

2. Test the models: If you only want to validate your data with tests after building, use the dbt test command. This ensures that all data quality tests (e.g., uniqueness and not-null checks) are applied to your models.

dbt test

3. Run specific models or tests: To run only specific models or tests, provide their names as arguments. For instance, to run a single model:

dbt run --select clean_bank_failures

To test a specific column:

dbt test --select clean_bank_failures.State

Integrating the Semantic Layer with BI Tools

To connect dbt to BI tools such as Looker or Tableau, follow these steps to expose the semantic layer effectively and ensure the BI tools can directly reference dbt models and metrics:

1. Enabling exposures in dbt

In your dbt project, create an exposures.yml file under the models folder, which looks like this:

exposures:
  - name: tableau_dashboard
    type: dashboard
    url: https://tableau.yourcompany.com/workbook
    owner:
      name: Your Name
      email: email@yourcompany.com
    depends_on:
      - ref('clean_bank_failures')

2. Preparing your database connection

  • Ensure the transformed data models are available in your database (e.g., Snowflake, BigQuery, DuckDB).
  • Run dbt build to materialize the dbt models into the database.

3. Connecting Tableau to dbt models

  • Open Tableau Desktop and create a new connection to your database.
  • Select the schema where the dbt models are stored.
  • Drag and drop the dbt models (e.g., clean_bank_failures) onto the Tableau workspace.

4. Defining metrics in Tableau

  • In Tableau, use the dbt-defined metrics such as total_assets or avg_assets_per_failure directly in your visualizations to ensure consistency.
  • Create calculated fields if needed to enhance visualizations.

5. Connecting Looker to dbt models

  • In Looker, navigate to the admin panel and set up a connection to your database.
  • Create a LookML view for each dbt model by importing the schema and fields.
  • Use the total_assets or avg_assets_per_failure metrics defined in dbt to build consistent Looker Explores and dashboards.

Best Practices for Implementing a Semantic Layer with dbt

Now that you have an overview of the steps involved in building a semantic layer with dbt, let’s review some best practices. 

Centralize business logic

Define all business rules in dbt to ensure consistency and maintainability. By centralizing business logic, you eliminate redundant definitions across tools, creating a single source of truth that all stakeholders can easily update and understand. 

Modularize models

Divide transformations into logical, reusable components. For instance, create base models for raw data, intermediate models for cleaned and transformed data, and final models for analytics-ready data. 

This modular structure simplifies troubleshooting, promotes code reuse, and enables collaboration among team members who can work on individual components without disrupting the entire pipeline.

Document everything

Leverage dbt’s automated documentation to keep your semantic layer well-organized and transparent. 

Use descriptions in YAML files to provide clear explanations for models, metrics, and columns. 

Update documentation regularly to reflect changes and use dbt’s autogenerated lineage graphs to visualize relationships between models. This ensures that the semantic layer remains accessible and easy to navigate for all users.

Tools like the dbt-utils package can significantly streamline your dbt workflows, providing pre-built macros and utilities that simplify model development and ensure thorough documentation.

Conclusion

Implementing a semantic layer with dbt is a powerful approach to bridging the gap between raw data and actionable insights. dbt's modular data modeling, centralized metric definitions, robust version control, and integration with BI tools can help you ensure consistent, reliable, and accessible data for analytics and reporting.

This tutorial has walked you through setting up a dbt project, creating SQL models, defining reusable metrics, and integrating the semantic layer with visualization tools like Tableau and Looker.

To learn more about dbt, check out the excellent Introduction to dbt course!

Become a Data Engineer

Prove your skills as a job-ready data engineer.

Moez Ali's photo
Author
Moez Ali
LinkedIn
Twitter

Data Scientist, Founder & Creator of PyCaret

Topics

Learn more about data engineering with these courses!

course

Introduction to Data Engineering

4 hr
116K
Learn about the world of data engineering in this short course, covering tools and topics like ETL and cloud computing.
See DetailsRight Arrow
Start Course
See MoreRight Arrow
Related

blog

What is a Semantic Layer? A Detailed Guide

Discover what semantic layers are and how they help data quality and consistency. Learn how they boost self-service analytics by providing user-friendly access.
Laiba Siddiqui's photo

Laiba Siddiqui

8 min

blog

What are Power BI Semantic Models?

Learn about semantic models in Power BI, their components, modes, and best practices to create and manage them.
Joleen Bothma's photo

Joleen Bothma

7 min

blog

An Introduction to The dbt-utils Package

Learn how dbt-utils enhances dbt with pre-built macros, key features, and practical use cases. Streamline your data transformations with our step-by-step guide.
Austin Chia's photo

Austin Chia

12 min

tutorial

What is dbt? A Hands-On Introduction for Data Engineers

Ready to start with dbt and take data modeling to the next level? This hands-on tutorial dives into essential techniques and project patterns to help you build intuitive, high-quality data warehouses with dbt.
Mike Shakhomirov's photo

Mike Shakhomirov

25 min

tutorial

Databricks SQL: A Comprehensive Guide for Data Analytics and BI Workloads

Discover how to leverage Databricks SQL for efficient data analytics, querying, and business intelligence with practical examples and best practices.
Allan Ouko's photo

Allan Ouko

11 min

tutorial

dbt Tutorial: 7 Must-Know Concepts For Data Engineers

Learn the 7 most important concepts around dbt - the favorite tool of modern data engineers.
Bex Tuychiev's photo

Bex Tuychiev

11 min

See MoreSee More