

Design the Experiment and Harness
My implementation pairs Claude with four Python functions, called tools, which I'll show after the dataset. The complete code and optional Streamlit interface are in the GitHub repository.
Define the four cooling models
Newton's law of cooling says an object cools faster when it is much hotter than the room, then slows as the temperature gap shrinks. The equation is T(t) = Ta + (T0 - Ta) * exp(-k * t). Here, T0 is the starting temperature, Ta is the room temperature, and k is the cooling rate per minute.
I wrote four model families for the agent to choose from:
-
Single rate: one
kthroughout, used as the baseline -
Time change: two rates, switching at the same elapsed minute in every run
-
Temperature threshold: two rates, switching at a shared temperature, so at a different minute in each run
-
Sensor offset: one true rate, plus a probe error that starts partway through and grows
Separate visible measurements from hidden truth
Claude sees three cooling series and whatever the tools return. The true rates, threshold, data settings, and confirmation measurements stay outside its tool access.
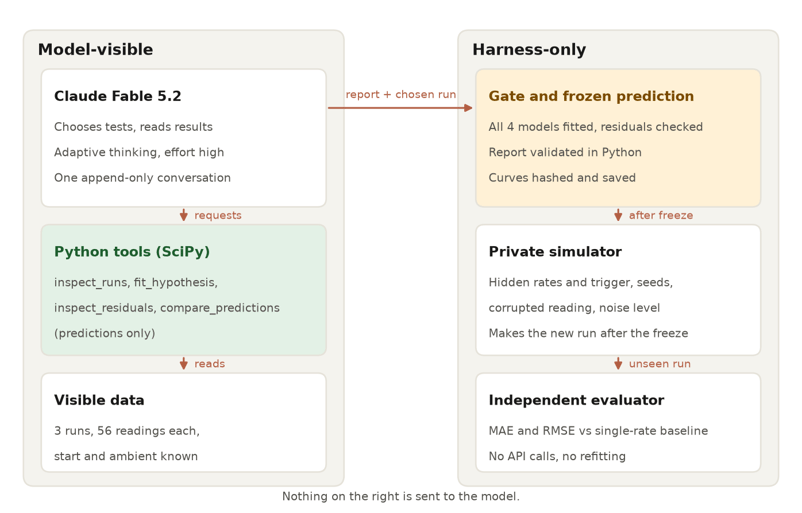
Claude accesses tools; truth remains hidden. Image by Author.
Everything in Python around Claude makes up the agent harness. Besides running the tools, it caps requests, time, and spend, as I'll cover with the tool loop.
Before the first API call, I fixed the candidate models, parameter bounds, limits, and the pass rule for the new experiment: an RMSE of at most 1.0 °C and no more than half the single-rate baseline's. Those rules stayed fixed.
Set Up Claude Fable 5.2 in Python
Setup requires a virtual environment and an API key. The claude-fable-5-2 model can read up to 1M tokens of prompt and conversation history, then return up to 128K output tokens.
Adaptive thinking, where the model decides how much to reason before it answers, is always on, and the API defaults to high effort. Claude API pricing is $8 per million input tokens and $40 per million output tokens, with five-minute prompt-cache writes at $10 and cache reads at $0.20.
You need:
-
Python 3.12+, because NumPy 2.5.4 and SciPy 1.18.1 require it (the Anthropic package itself supports 3.10)
-
An API key with access to
claude-fable-5-2 -
anthropic2.7.0, the release that added the model ID
Clone the project and install its pinned dependencies. On macOS or Linux, create the environment with python3.12 -m venv .venv, activate it with source .venv/bin/activate, and replace Copy-Item with cp.
git clone https://github.com/KhalidAbdelaty/claude-fable-5-2-api.git
cd claude-fable-5-2-api
py -3.12 -m venv .venv
.venv\Scripts\Activate.ps1
pip install -r requirements.txt
Copy-Item .env.example .env # then paste your key after ANTHROPIC_API_KEY=The code loads the API key from the environment without printing it. The repository README lists the commands for the full experiment, and only two of them call the API. Our Claude API guide covers keys and billing in general.
Make your first Fable 5.2 API request
Skip this section if you've called Claude from Python before. This request focuses on the evidence that separates the two hypotheses.
import anthropic
from dotenv import load_dotenv

load_dotenv(".env", override=True)
client = anthropic.Anthropic()  # reads ANTHROPIC_API_KEY

response = client.messages.create(
    model="claude-fable-5-2",
    max_tokens=4096,
    output_config={"effort": "high"},
    messages=[{"role": "user", "content": (
        "Three cooling runs start at 80, 95, and 110 C. Each seems to slow down partway through. "
        "In three short bullets: what pattern across the runs would point to a change after a fixed "
        "time, what pattern would point to a change at a fixed temperature, and what the data alone "
        "cannot tell us.")}],
)
print("block types:", [block.type for block in response.content])
print("stop reason:", response.stop_reason)
print("".join(block.text for block in response.content if block.type == "text"))Claude returns a list of typed content blocks, so read text by block type; content[0] may be a thinking block. Here is the first response:
block types: ['thinking', 'text']
stop reason: end_turn

- **Fixed time:** the slowdown appears at the same elapsed time in all three runs but at different temperatures, with the hotter-start runs still hotter when it happens.
- **Fixed temperature:** the slowdown appears at the same temperature in all three runs but at different elapsed times, with the hotter-start runs reaching it later.
- **What the data cannot tell us:** the cause. A matching pattern shows what the change tracks, not why it happens (for example a phase change, a setup artifact, or a shift in the surroundings). Since cooling naturally slows as it nears room temperature, the data also cannot show on its own that there is a distinct change rather than a smooth curve.Both thinking and text blocks appeared. Thinking tokens count as output tokens, so include them when estimating cost. The Claude Fable 5.2 migration guide states that budget_tokens, thinking disabled, temperature, top_p, and top_k return a 400 error.
Create a Cooling Dataset Without Data Leakage
The data has to be messy enough to need model fitting, and the answer has to stay out of Claude's reach.
Simulate three cooling runs
I simulated three runs from Newton's law with a hidden, continuous change in the cooling. Run A starts at 80 °C in a 21.0 °C room, B at 95 °C in 24.0 °C, and C at 110 °C in 22.5 °C. A fixed NumPy random number generator adds Gaussian noise, and one reading gets an extra error on purpose.
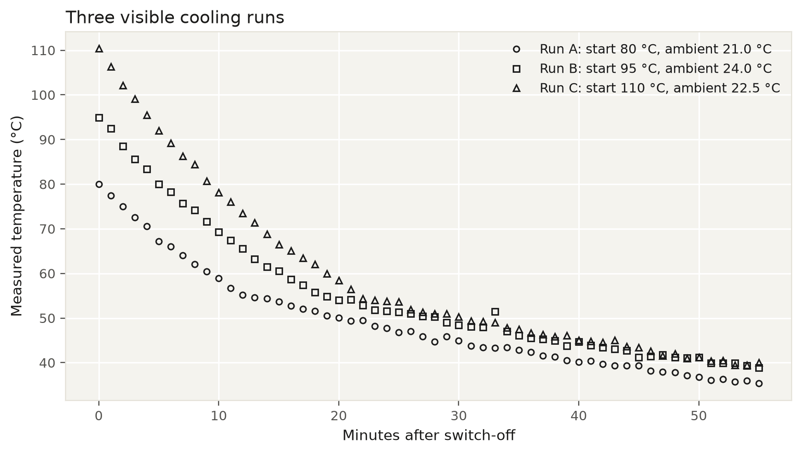
Three noisy runs include one outlier. Image by Author.
Run A cools faster early than late. That pattern alone does not show a discrete change because any exponential slows near room temperature.
Run B contains an isolated jump of about 4 °C, while neighboring gaps elsewhere stay below 1.2 °C. Each bend spreads over several noisy minutes, so visual inspection cannot separate the time and threshold models.
Test Cooling Hypotheses With Python Tools
Python fits each cooling candidate under the same rules and returns its parameters and errors. Claude never sees the fitting code, only what each tool returns.
Fit shared parameters without one outlier dominating
Fitting means choosing parameter values that keep each predicted curve close to its measurements. I use soft L1 loss because it reduces the influence of a large error without deleting that reading.
All runs share the fitted parameters, while each run keeps its own start and room temperature. For the threshold model, that gives each run its own switch time, ln((T0 - Ta) / (threshold - Ta)) / k_above.
SciPy's least_squares() searches for the best-fitting parameters, while parameter bounds keep rates and switch points inside the ranges fixed before the run.
The excerpt below shows the solver call and convergence checks. The residual function and grid scan around it are in the repository.
from scipy.optimize import least_squares

def _solve(hypothesis, names, x0, lo, hi, runs):
    # soft L1: residuals under f_scale count roughly squared, larger ones roughly linearly
    return least_squares(_residuals, x0, bounds=(lo, hi), method="trf",
                         loss="soft_l1", f_scale=0.5, args=(hypothesis, names, runs))

# scan the change point in 0.5 steps with the rates fitted at each step, then refine all three
res = _solve(hypothesis, names, best_grid_point, lo, hi, runs)
converged = bool(res.success and res.status > 0 and np.all(np.isfinite(res.x)))
at_bound = [n for n, v, a, b in zip(names, res.x, lo, hi) if min(v - a, b - v) < 1e-4 * (b - a)]I set f_scale to 0.5 °C before the run. Residuals larger than that start losing influence under soft L1. A grid scan over the switch point gives the solver a sensible starting value.
Validate models with leave-one-run-out tests
MAE is the average miss in °C. RMSE squares errors first, so larger errors count more.
Training error favors models with more parameters. Cross-validation estimates held-out error by rotating the excluded data. Here, leave-one-run-out (LORO) validation fits on two runs and predicts the third.
Define Claude tool-calling schemas
A tool schema is a JSON description of a Python function and the arguments Claude may send. Strict tool use makes the API check that shape before Python runs the function.
Claude can request four tools:
-
inspect_runs: returns the visible measurements and simple slope summaries. -
fit_hypothesis: fits one cooling model and returns its parameters and held-out errors. -
inspect_residuals: shows where observed temperatures differ from model predictions. -
compare_predictions: compares fitted models under proposed experiment conditions.
The compare_predictions schema keeps confirmation measurements outside the tool:
{"name": "compare_predictions", "strict": True,
 "description": "Predict a new run from existing fits under proposed conditions and report how far the "
                "predictions differ. initial_temp_c must be 75 to 115 and ambient_temp_c 20 to 25. "
                "Returns predictions only; no new measurements are generated.",
 "input_schema": {"type": "object", "additionalProperties": False,
                  "properties": {"initial_temp_c": {"type": "number"},
                                 "ambient_temp_c": {"type": "number"},
                                 "fit_ids": {"type": "array", "items": {"type": "string"}}},
"required": ["initial_temp_c", "ambient_temp_c", "fit_ids"]}}The fit_ids values refer to models fitted earlier in the same investigation. Strict schemas don't accept minimum or maximum, so Python checks the temperature ranges itself. Leave tool_choice on auto, since forcing a tool returns a 400 error on Fable 5.2.
Build the Claude Tool Loop
The application repeats one cycle: send the conversation to Claude, run any requested Python tools, and return their results. It continues until the required comparisons are complete, then asks Claude for a final report in a fixed format.
Write a prompt for hypothesis testing
The system prompt describes the method without suggesting an answer. The core prompt is:
SYSTEM = """You are a scientific investigator working on a controlled cooling experiment. You decide which
checks to run and how to read the results. Python tools do every numerical calculation.

How to work:
- Look at the measurements before you choose a model.
- Fit every candidate model with fit_hypothesis. Compare them on leave-one-run-out error as well as
  training error, because a model with more parameters always fits the training runs at least as well.
- Use inspect_residuals to look for systematic patterns and to decide whether any single reading is
  an outlier.
- Use only numbers that a tool returned. Do not invent measurements, parameters, or errors.
- Keep observed evidence separate from assumptions. The data can show which mathematical model fits
  best; it cannot show the physical cause of a change.
- If the evidence does not separate the candidates, say so and treat the result as inconclusive.
..."""I care most about the last bullet. Without it, the model has to name a winner even when the errors are too close to call.
Keep the tool loop append-only
Every call sends the same system and tools, and each response goes back untouched. This excerpt shows the message handling; the full loop with stop handling is in the repository.
resp = client.messages.create(
    model="claude-fable-5-2",
    max_tokens=20_000,
    system=SYSTEM,
    tools=TOOLS,  # all four, declared on the first request
    thinking={"type": "adaptive", "display": "summarized"},
    output_config={"effort": "high"},
    cache_control={"type": "ephemeral"},  # automatic prompt caching
    messages=messages,
)
messages.append({"role": "assistant", "content": resp.content})  # unchanged, thinking included

if resp.stop_reason == "tool_use":
    results = []
    for block in resp.content:
        if block.type == "tool_use":
            out, is_error = box.run(block.name, dict(block.input))
            results.append({"type": "tool_result", "tool_use_id": block.id,
                            "content": out, "is_error": is_error})
messages.append({"role": "user", "content": results})Preserved thinking lets Claude keep its earlier reasoning across turns, as long as system, tools, and earlier messages stay unchanged. On Fable 5.2, editing any of them returns a 400 error by default.
You can change output_config, tool_choice, and max_tokens between calls, though a new output format still misses the prompt cache. Group parallel tool results in one user message, as the loop above does.
Set limits on requests, time, and spend
Python counts requests, tool calls, elapsed time, and spend, and it won't start new work once a limit is reached. A request that is already running can still go past the time or spend limit, so treat those two as soft limits.
Before accepting a final answer, Python also checks that Claude fitted every candidate, inspected residuals, and compared confirmation designs. If Claude stops for any reason besides a tool request or a finished turn, the investigation ends as inconclusive. Set max_tokens high enough for thinking plus the answer.
Return a structured report
Once the checks pass, one more request asks for structured outputs on the same history, so the final report arrives as a validated Python object:
messages.append({"role": "user", "content": REPORT_PROMPT})
resp = client.messages.parse(
    model="claude-fable-5-2", max_tokens=20_000, system=SYSTEM, tools=TOOLS,
    thinking={"type": "adaptive", "display": "summarized"},
    output_config={"effort": "high"},
    output_format=InvestigationReport,  # the SDK sends this as output_config.format
    tool_choice={"type": "none"},       # tools stay declared, so the prefix check passes
    messages=messages,
)
problems = validate(resp.parsed_output, box.fits) # fit IDs exist, all four covered, ranges holdPydantic checks the report's shape, and validate() confirms that every cited fit exists and the conditions fall inside the allowed range. After that, the model choice and conditions are final.
Fable 5.2 Selects the Temperature-Threshold Model
I ran one investigation at high effort. Here is how Claude got to its answer.
Trace Claude's test sequence
Claude began by inspecting the measurements. Before fitting anything, its summary read: "The change shows up at about 55 °C in every run: at minute 12 in A, minute 19 in B, and minute 22 in C. That points to a threshold, so I'll fit all four."
I'd call that anchoring: Claude committed to an answer before testing it. The later fit agreed, with switches near minutes 12, 18, and 22. The terminal trace shows the order of the remaining checks.
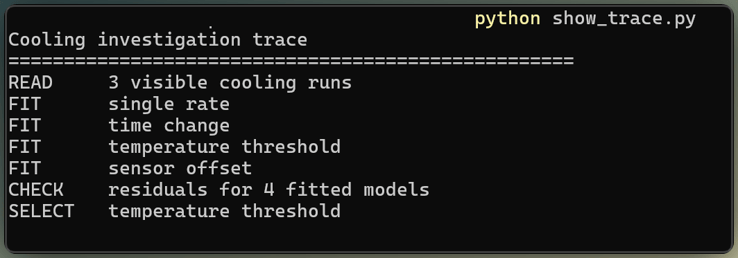
Terminal trace shows Claude's test order. Image by Author.
Compare held-out errors across four models
Train RMSE measures each fit on all three runs. The held-out columns average the three LORO tests.
|
Candidate |
Main assumption |
Train RMSE (°C) |
Held-out MAE (°C) |
Held-out RMSE (°C) |
|
Single rate |
One rate throughout |
4.08 |
3.90 |
4.60 |
|
Time change |
Shared switch near minute 19 |
1.92 |
2.17 |
2.63 |
|
Temperature threshold |
Shared switch near 55 °C |
0.49 |
0.32 |
0.48 |
|
Sensor offset |
A growing measurement drift |
1.49 |
1.45 |
1.87 |
For the threshold model, training and held-out errors are close, so the fit carries over from run to run, though three runs can't rule out overfitting in general. The residual plot below shows the observed temperature minus each model's prediction.
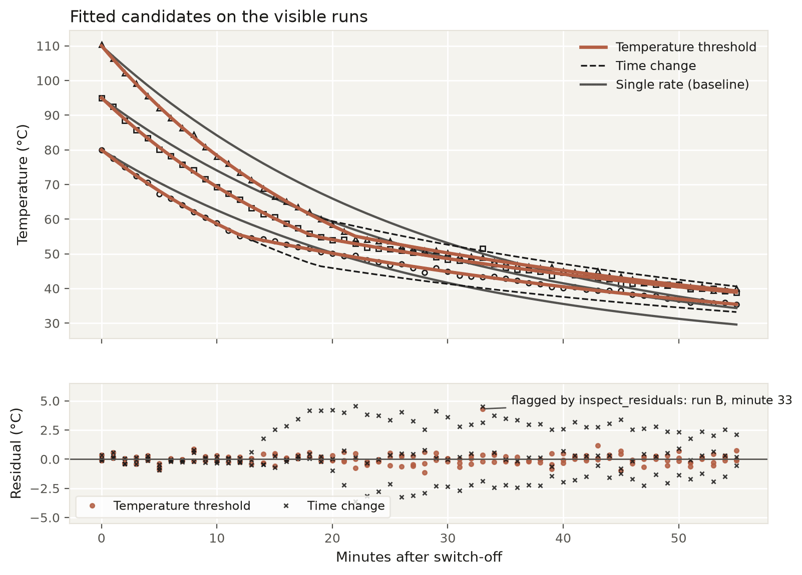
Threshold residuals show no systematic pattern. Image by Author.
The time-change fit matches run B. After the switch, it misses run A by roughly +2.5 to +3.5 °C and run C by -1.5 to -2.8 °C.
I find the sign change more useful than the ranking alone: it shows that the switch arrives earlier in A and later in C, as a temperature trigger predicts. The sensor-offset model reduces some error by adding drift, but its held-out errors remain larger.
Check the corrupted reading
The agent did not know which reading I had corrupted. It found run B, minute 33, with a residual of about +4.3 °C. Its robust z-score, which measures distance from the typical residual spread, was above 12.
Claude left the reading in, since soft L1 already limits its pull. To check that choice, I refit all four models without it. The threshold model stayed first by a wide margin, and its threshold estimate barely moved.
Design a Confirmation Experiment
The agent compared candidate predictions across several starting and room temperatures, then chose conditions without seeing any new measurements.
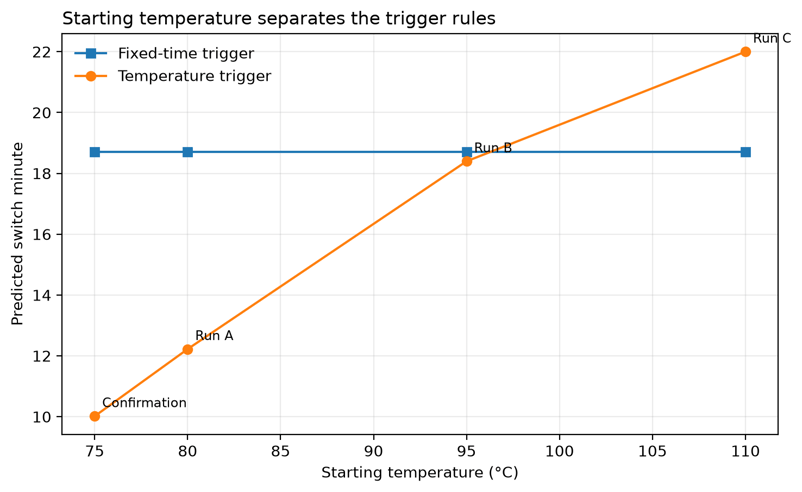
Start temperatures expose each trigger rule. Image by Author.
Choose conditions that separate the models
As noted in the TL;DR, the agent chose a 75 °C start and a 20 °C room. The threshold model switches near minute 10, while the time model switches near minute 19. The sensor-offset curve also stays separate from the threshold prediction.
A mid-range setup close to run B would separate the threshold and time models by only about 0.6 °C. The chosen conditions sit slightly outside the tested range, and Claude flagged that in its report.
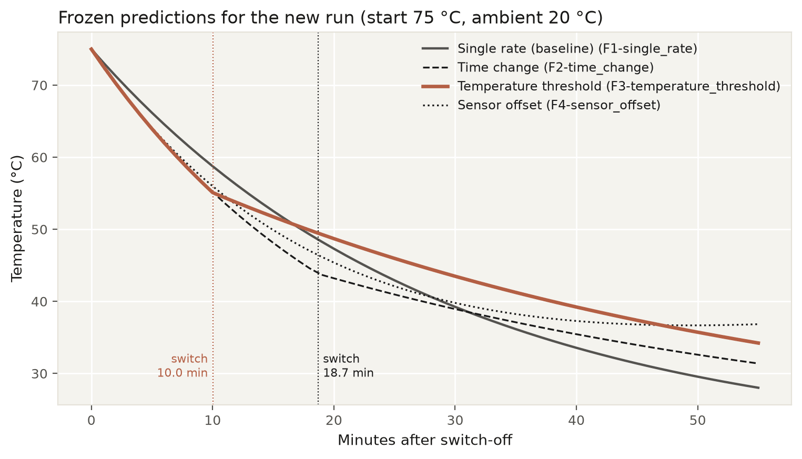
Candidate predictions for the chosen run. Image by Author.
Lock predictions before data generation
I locked the chosen conditions, fitted parameters, and every candidate's prediction before generating any new measurements. The agent did not receive the confirmation measurements and could not revise its answer after the outcome.
The confirmation measurements use the same Gaussian noise model, a separate fixed seed, and no added outlier.
Score the Unseen Run
Separate Python code scored the frozen predictions. It never calls the API, so Claude has no part in grading its own answer.
Score predictions with independent Python
The threshold prediction passed both preset tests. On the unseen run, it scored 0.27 °C MAE and 0.32 °C RMSE. Fixed-time scored 3.67 °C RMSE, sensor offset 2.35 °C, and single-rate 4.28 °C.
The confirmation run contains no planted outlier, which helps explain its lower error compared with the leave-one-run-out results. A different random-noise sample may also contribute.
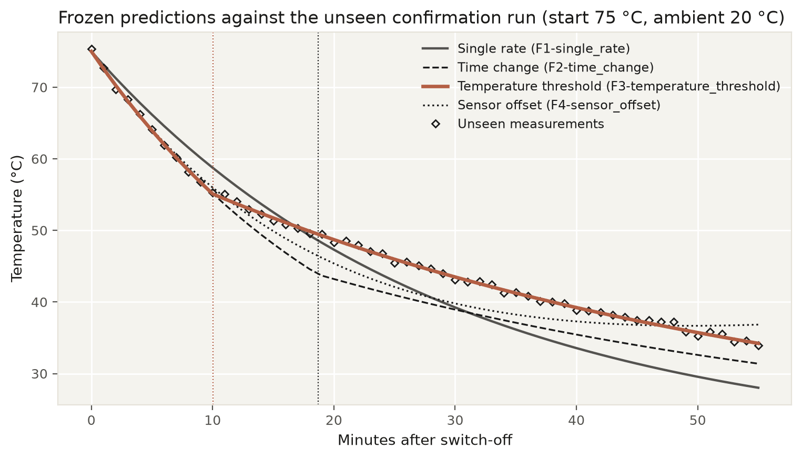
Frozen predictions match the unseen measurements. Image by Author.
Compare fitted parameters with hidden truth
After scoring, compare the fitted parameters with the hidden generating values:
import numpy as np

def true_curve(t0, ta, minutes, truth):
    """Newton cooling whose rate drops when the temperature crosses a threshold. Continuous at the switch."""
    t = np.asarray(minutes, dtype=float)
    k1, k2, th = truth["k_above"], truth["k_below"], truth["threshold_c"]
    if t0 <= th:
        return ta + (t0 - ta) * np.exp(-k2 * t)
    t_cross = np.log((t0 - ta) / (th - ta)) / k1
    fast = ta + (t0 - ta) * np.exp(-k1 * t)
    slow = ta + (th - ta) * np.exp(-k2 * (t - t_cross))  # restarts from the threshold
return np.where(t <= t_cross, fast, slow)The simulator adds seeded Gaussian noise around this curve.
The hidden rule was a temperature threshold at 55 °C, with rates of 0.045 and 0.020 per minute and a noise standard deviation of 0.35 °C.
Fitted rates match to 3 decimal places, the threshold falls within 0.1 °C, and the predicted switch is within 0.1 minute.
The data identify the mathematical rule used by the simulator. They cannot show whether a real device slowing near 55 °C involves a phase change, a fan cycle, or another physical cause.
Review how the agent reached its answer
The report cited fit IDs and tool numbers as evidence, and it named what three runs can't establish. The weak spot is the early guess I mentioned earlier. A single investigation can't show how often that kind of guess goes wrong.
Watch the investigation in Streamlit
In the video, I start a live run, follow the tool log, and open the Report, Curves, Confirmation, and Cost tabs after scoring.
The Streamlit interface shows one investigation. Video by Author.
Measure Claude Fable 5.2 API Cost
The investigation, final report included, cost about $0.49 and took just over a minute. SciPy runs on your machine, so it adds nothing to the API bill.
The report request alone took nearly half the cost and time. As I mentioned in the tool-loop section, a new output format misses the prompt cache, so that last request processed the whole conversation again before writing a long report. Track uncached input, cache writes, cache reads, and output separately, since each has its own price.
Limits and Practical Considerations
Two kinds of limits matter here: what the experiment can show, and what the code needs before it runs as a service.
Scientific limits
The simulator and threshold candidate use the same equation. A gradual switch in a real device could still fit this model while following a different curve.
If the true rule were missing, the agent could still pick the closest supplied model over answering inconclusive. More noise or a barely crossed threshold could make the errors too similar to separate. Another run may take a different tool order.
Before production
The limits from the tool loop cover one investigation on your machine. A production service needs more:
- Set SDK retries and request timeouts for the service.
- Validate every tool input and output in Python.
- Log the model, SDK version, stop reason, tokens, latency, and cost for each request.
- Pin model and SDK versions, rerun the hidden test, and confirm the 30-day retention policy before an upgrade.
When this pattern fits
Use this pattern when several explanations fit, Python can test them, and a hidden experiment can score the choice, especially when the next experiment costs more than the API call.
Use plain Python when you know the model family. Anthropic's Fable 5.2 model guidance recommends trying Opus first and testing Fable when Opus misses the requirement.
Final Thoughts
We built an agent that compared four cooling models, chose a temperature threshold, designed a confirmation run, and predicted measurements it had never seen. For this synthetic device, the answer to my opening question is yes.
I would not stretch that to real equipment or open-ended discovery. As I covered in the limits, the candidates included the simulator's own equation, and I ran the agent once.
What carries over is the method: hide the truth, set the scoring rules before the first request, freeze predictions, and use a separate evaluator. A useful next test would add a gradual-transition model and repeat the investigation across different noise levels.
For model selection, our Introduction to Claude Models course covers the Claude lineup and its trade-offs.
FAQs
Can I turn off thinking or set a thinking budget on Claude Fable 5.2?
No. Adaptive thinking is always on, and both thinking: {type: "disabled"} and budget_tokens return a 400 error. Control how much it thinks with the effort parameter instead, which defaults to high. Thinking tokens are billed as output and count toward max_tokens.
Why does Claude Fable 5.2 return a 400 error after I edit earlier messages?
Each thinking block is only valid against the system prompt, tools, and messages that came before it, and Fable 5.2 checks this on every account. Keep the conversation append-only and freeze system and tools for the session. As a stopgap, setting prefix_mismatch_behavior to "drop_block" with the beta header drops the affected blocks instead of failing.
Can I force Claude Fable 5.2 to call a specific tool?
No. Setting tool_choice to any or to a named tool returns a 400 error; only auto and none work. Name the tool in your instruction and set strict: true so the call matches your schema. If the call is required, use a mid-conversation system message.
What happens when Claude Fable 5.2 refuses a request?
The response comes back with stop_reason: "refusal", and stop_details.category tells you which safeguard was triggered. You can retry on another model yourself, or opt into server-side fallback with fallbacks: "default", a beta that retries on Claude Opus 4.8 or Claude Opus 5. The fallback model doesn’t receive Fable 5.2’s thinking blocks.
Can I use Claude Fable 5.2 with zero data retention?
Not by default. Fable 5.2 requires 30-day data retention, and API requests from an organization or workspace without it return a 400 error. Under a ZDR arrangement, enable 30-day retention for a workspace or contact your Anthropic account team.
Can the Batch API replace the tool loop from this experiment?
No. Each tool step needs the previous response, so the Batch API cannot replace this loop directly. Its 50% discount fits independent requests or parallel evaluations.

I’m a data engineer and community builder who works across data pipelines, cloud, and AI tooling while writing practical, high-impact tutorials for DataCamp and emerging developers.



LLMs are good at sounding like they reasoned their way to an answer. Whether they actually did is harder to check. In most tasks, the model has either seen something similar to the answer before or no one can verify the answer at all. So I built a test where the answer stays hidden.
Claude Fable 5.2 gets noisy readings from a simulated device that cools after it’s switched off, plus 4 possible explanations for why its cooling slows partway through. It has to pick one, design a follow-up experiment, and commit to a prediction before seeing a single new measurement. Separate Python code then grades the prediction, and Claude never touches it.
The cooling device is only the test case. What carries over is the setup: hide the truth from the model, fix the scoring rules before the first API call, freeze its predictions, and grade them with code it can’t see. You can reuse it for any “which explanation is right?” problem, from root-cause analysis to reading an A/B test.
In this tutorial, you’ll build that agent in Python. SciPy does the math; Claude decides which check to run next and what to conclude. If you’re comfortable with Python functions and API requests, you can follow along, and I explain the cooling math when it first appears. We’ll cover how to:
Our Claude Fable 5.2 overview covers the launch and benchmarks, so I'm sticking with the API and the cooling test here. I ran the experiment the day after launch.
TL;DR
I gave Fable 5.2 noisy data from a simulated device whose cooling slows partway through, plus four possible explanations. It had to pick one, design a new experiment, and predict the result before seeing it.