Track

Image by author.
Apache Airflow is a popular open-source data orchestration tool designed for building, scheduling, and monitoring data pipelines. It features a dashboard that helps manage the state of workflows, making it a perfect tool for most workflow needs.
However, Airflow lacks some important features that can be vital for complex, modern data orchestration requirements.
In this tutorial, we will explore five alternatives to Airflow that offer enhanced capabilities and address some of its limitations. Moreover, we will learn to build a simple ETL pipeline using each tool, run it, and visualize it in their dashboard.
Why Choose an Airflow Alternative?
Airflow is a powerful tool for various data workflows, but it has several limitations that might make companies consider alternatives.
Here are some reasons why you might choose an alternative:
- Steep learning curve: Airflow can be challenging to learn, especially for those who are new to workflow management tools.
- Maintenance: It requires significant maintenance, especially in large-scale deployments.
- Insufficient documentation: Users have reported multiple documentation issues that make it harder to troubleshoot problems or learn about new features.
- Resource intensive: Airflow can be resource-intensive, requiring substantial computing and memory to run efficiently.
- Limited flexibility for non-Python users: The workflow-as-code philosophy relies heavily on Python, which can exclude domain experts who may not be proficient in programming.
- Scalability: Some users report difficulties scaling Airflow for large workflows.
- Limited real-time processing: Airflow is primarily designed for batch processing, not real-time data streams.
Before we dive into the coding part of other data orchestration tools, it is important to learn how to write the data pipeline using Apache Airflow by following the Getting Started with Apache Airflow tutorial, so you can fairly compare alternatives.
If you’re completely new to Airflow, consider taking the short Introduction to Airflow in Python course to learn the basics of building and scheduling data pipelines.
5 Best Airflow Alternatives For Data Orchestration
Now, let’s describe the top 5 alternatives to Airflow and show how to use them with practical code examples.
1. Prefect
Prefect is an open-source Python workflow orchestration tool built for modern data and machine learning engineers. It offers a simple API that lets you build a data pipeline quickly and manage it through an interactive dashboard.
Perfect offers a hybrid execution model, meaning you can deploy the workflow on the cloud and run it there or use the local repository.
Compared to Airflow, Prefect comes with advanced features such as automated task dependencies, event-based triggers, built-in notifications, workflow-specific infrastructure, and cross-task data sharing. These capabilities make it a powerful solution for managing complex workflows efficiently and effectively.
Prefect is simple and comes with powerful features. It basically took me 5 minutes to run the example code. I especially like how the dashboard UI is designed, how you can set up notifications, re-run pipelines, manage and monitor everything through the Dashboard.
Abid Ali Awan, Author
Read the Airflow vs Prefect: Deciding Which is Right For Your Data Workflow blog to learn about the detailed comparison between these two data orchestration tools.
Getting started with Prefect
We will start our Prefect project by installing the Python package. Run the following command in a terminal.
$ pip install -U prefectAfter that, we will create a Python script named prefect_etl.py and write the following code.
from prefect import task, flow
import pandas as pd

# Extract data
@task
def extract_data():
    # Simulating data extraction
    data = {
        "name": ["Alice", "Bob", "Charlie"],
        "age": [25, 30, 35],
        "city": ["New York", "Los Angeles", "Chicago"]
    }
    df = pd.DataFrame(data)
    return df

# Transform data
@task
def transform_data(df: pd.DataFrame):
    # Example transformation: adding a new column
    df["age_plus_ten"] = df["age"] + 10
    return df

# Load data
@task
def load_data(df: pd.DataFrame):
    # Simulating data load
    print("Loading data to target destination:")
    print(df)

# Defining the flow
@flow(log_prints=True)
def etl():
    raw_data = extract_data()
    transformed_data = transform_data(raw_data)
    load_data(transformed_data)

# Running the flow
if __name__ == "__main__":
    etl()
The code above defines the extract_data(), transform_data(), and load_data()task functions and executes them in series in a flow function named etl(). These functions are created using Prefect Python decorators.
In short, we are creating a pandas DataFrame, transforming it, and then displaying the final result using print. This is a simple way to simulate an ETL pipeline.
To execute the workflow, just run the Python script using the following command.
$ python prefect_etl.py As we can see, our workflow run is successfully completed.

Prefect flow run logs.
Deploying the flow
We will now deploy our workflow so that we can run it on a schedule or trigger it based on an event. Deploying the flow also allows us to monitor and manage multiple workflows in a centralized way.
To deploy the flow, we will use the Prefect CLI. The deploy function requires the Python file name, the flow function name in the file, and the deployment name. In this case, we are calling this deployment “simple_etl.”
$ prefect deploy prefect_etl.py:etl -n 'simple_etl'After running the above script in the terminal, we may receive the message that we don't have a worker pool to run the deployment. To create the worker pool, use the following command.
$ prefect worker start --pool 'datacamp'Now that we have a worker pool, we will launch another terminal window and run the deployment. The prefect deployment run command requires the “<flow-function-name>/<deployment-name>” as an argument, as shown in the command below.
$ prefect deployment run 'etl/simple_etlAs a result of running the deployment, you will receive the message that the workflow is running. Usually, the flow run that gets created gets assigned a random name, in my case witty-lorikeet.
Creating flow run for deployment 'etl/simple_etl'...
Created flow run 'witty-lorikeet'.
└── UUID: 4e0495b0-9c7e-4ed8-b9ab-5160994dc7f0
└── Parameters: {}
└── Job Variables: {}
└── Scheduled start time: 2024-06-22 14:05:01 PKT (now)
└── URL: <no dashboard available>
To see the full log, switch back to the terminal window where you started the workers pool.

Prefect flow run summary.
You must initiate the Prefect web server to visualize the flow run in a more user-friendly manner and manage other workflows.
$ prefect server start After executing the command above, you should be redirected to the Prefect dashboard. Alternatively, you can go directly to the http://127.0.0.1:4200 address in your browser.
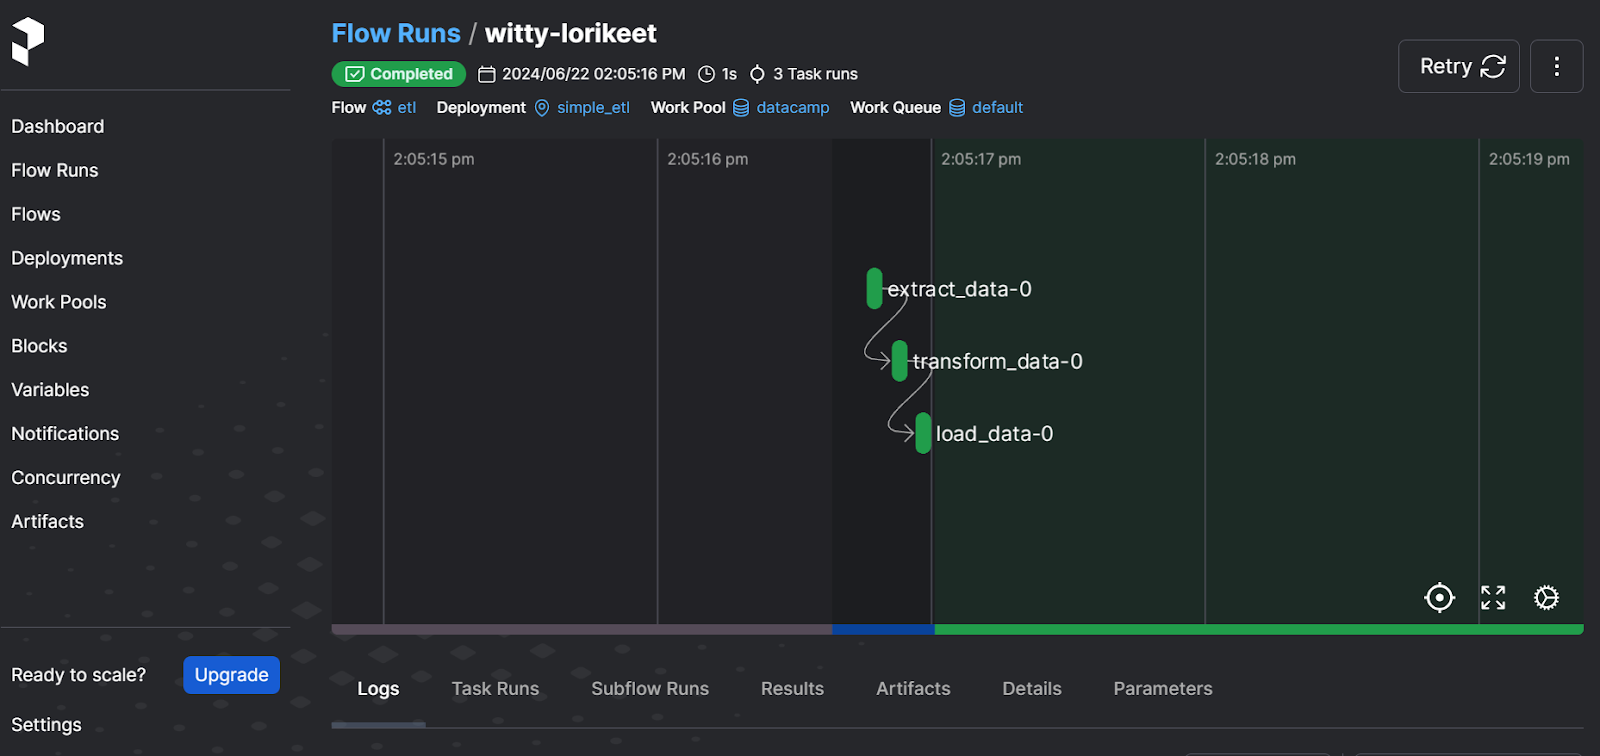
Prefect web server UI
The dashboard lets you rerun the workflow, view the logs, check on work pools, set notifications, and select other advanced options. It is a complete solution for your modern data orchestration needs.
To learn how to build and execute machine learning pipelines using Prefect, you can follow the Using Prefect for Machine Learning Workflows tutorial.
2. Dagster
Dasgter is an open-source framework designed for data engineers to define, schedule, and monitor data pipelines. It is highly scalable and facilitates collaboration between various data teams.
Dagster enables users to define their data assets as Python functions using decorators. Once these assets are defined, users can execute them seamlessly through scheduling or event-based triggers.
Compared to Airflow, Dagster lets us develop, test, and review the pipeline locally, provides an asset-based approach to orchestration, and is cloud and container-native.
Instead of thinking of workflow in terms of steps and flows, I had to change my thinking and build a pipeline using data assets. Apart from that, building and executing a simple ETL pipeline was pretty simple. Also, the webserver is relatively minimal but provides all the information to monitor assets, runs, and deployments.
Abid Ali Awan, Author
Getting started with Dagster
We will create a simple ETL pipeline, execute it, and visualize it using the Dagster web server. Similar to the Prefect dashboard, the Dagster web server provides centralized ways to monitor multiple workflows and schedule runs and assets.
We will start by installing the Python package.
$ pip install dagster -qThen, we will create three Python functions for extracting, transforming, and loading the data. These functions are named create_dirty_data(), clean_data(), and load_cleaned_data()in the code. Using the @asset decorator, we will declare the functions as data assets in Dagster.
Next, we will create the asset job (job variable) using all the assets (all_assets variable) and then create the asset definition (defs variable).
You can skip the asset definition part, but it becomes important if you want to schedule your run, run multiple jobs, and set up sensors.
import pandas as pd
import numpy as np
from dagster import asset, Definitions, define_asset_job, materialize

@asset
def create_dirty_data():
    # Create a sample DataFrame with dirty data
    data = {
        'Name': [' John Doe ', 'Jane Smith', 'Bob Johnson ', '  Alice Brown'],
        'Age': [30, np.nan, 40, 35],
        'City': ['New York', 'los angeles', 'CHICAGO', 'Houston'],
        'Salary': ['50,000', '60000', '75,000', 'invalid']
    }
    df = pd.DataFrame(data)

    # Save the DataFrame to a CSV file
    dirty_file_path = 'dag_data/dirty_data.csv'
    df.to_csv(dirty_file_path, index=False)

    return dirty_file_path

@asset
def clean_data(create_dirty_data):
    # Read the dirty CSV file
    df = pd.read_csv(create_dirty_data)

    # Clean the data
    df['Name'] = df['Name'].str.strip()
    df['Age'] = pd.to_numeric(df['Age'], errors='coerce').fillna(df['Age'].mean())
    df['City'] = df['City'].str.upper()
    df['Salary'] = df['Salary'].replace('[\$,]', '', regex=True)
    df['Salary'] = pd.to_numeric(df['Salary'], errors='coerce').fillna(0)

    # Calculate average salary
    avg_salary = df['Salary'].mean()

    # Save the cleaned DataFrame to a new CSV file
    cleaned_file_path = 'dag_data/cleaned_data.csv'
    df.to_csv(cleaned_file_path, index=False)

    return {
        'cleaned_file_path': cleaned_file_path,
        'avg_salary': avg_salary
    }

@asset
def load_cleaned_data(clean_data):
    cleaned_file_path = clean_data['cleaned_file_path']
    avg_salary = clean_data['avg_salary']

    # Read the cleaned CSV file to verify
    df = pd.read_csv(cleaned_file_path)

    print({
        'num_rows': len(df),
        'num_columns': len(df.columns),
        'avg_salary': avg_salary
    })

# Define all assets
all_assets = [create_dirty_data, clean_data, load_cleaned_data]

# Create a job that will materialize all assets
job = define_asset_job("all_assets_job", selection=all_assets)

# Create Definitions object
defs = Definitions(
    assets=all_assets,
    jobs=[job]
)

if __name__ == "__main__":
    result = materialize(all_assets)
    print("Pipeline execution result:", result.success)
You can run the above code in a Jupyter Notebook or create the Python file and run it.
As a result of executing the code, we will get a complete log of the workflow run.

Dagster web server
To visualize the assets and job runs, we have to install and run the Dagster web server. The web server lets you run the jobs, materialize individual assets, and monitor multiple jobs at once.
$ pip install dagster-webserverTo initiate the Dagster server, we will use the Daster CLI and provide it with the Python file location. In this case, I named the file dagster_pipe.py.
$ dagster dev -f dagster_pipe.py The command above will launch the web server on your browser automatically. Alternatively, you can go directly to the http://127.0.0.1:3000 address in your browser.
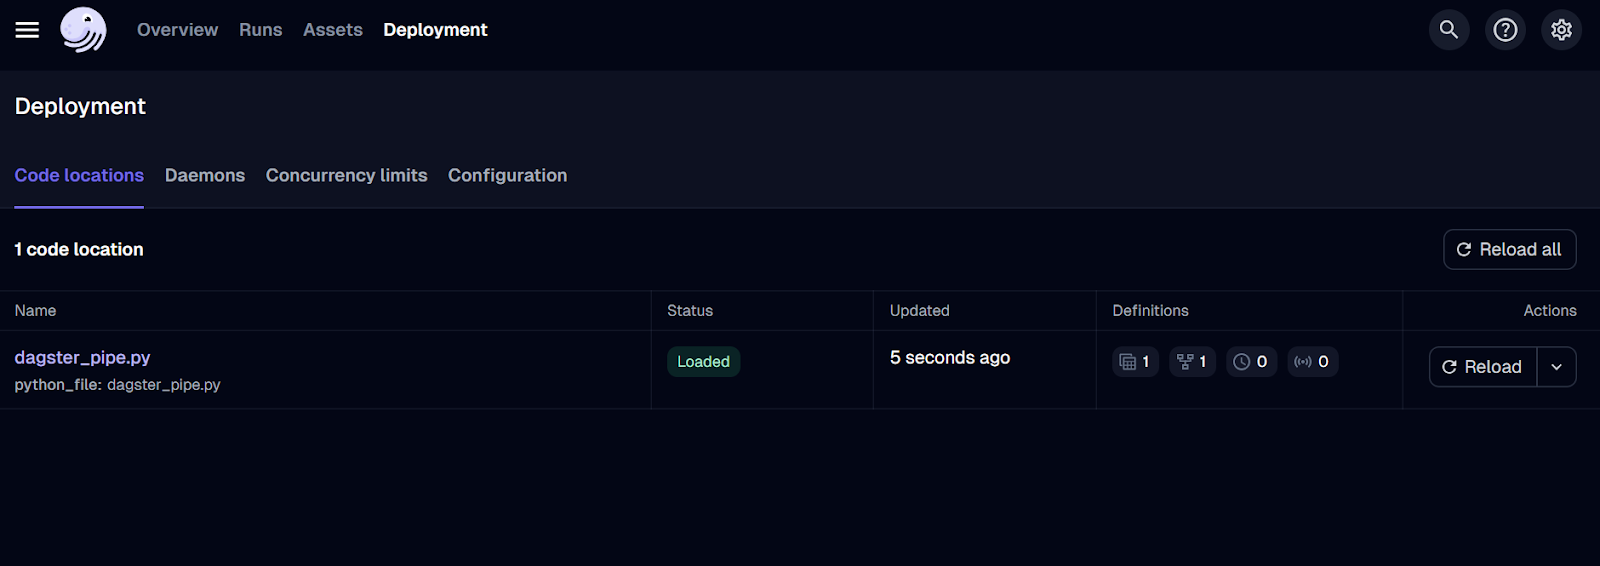
Dagster web server UI.
We have only deployed the job so far. To run the workflow, go to the “Runs” tab and click on the “Launch a new run” button.
The run should be successfully completed! To see the logs, click on the ID of the run you’re interested in.
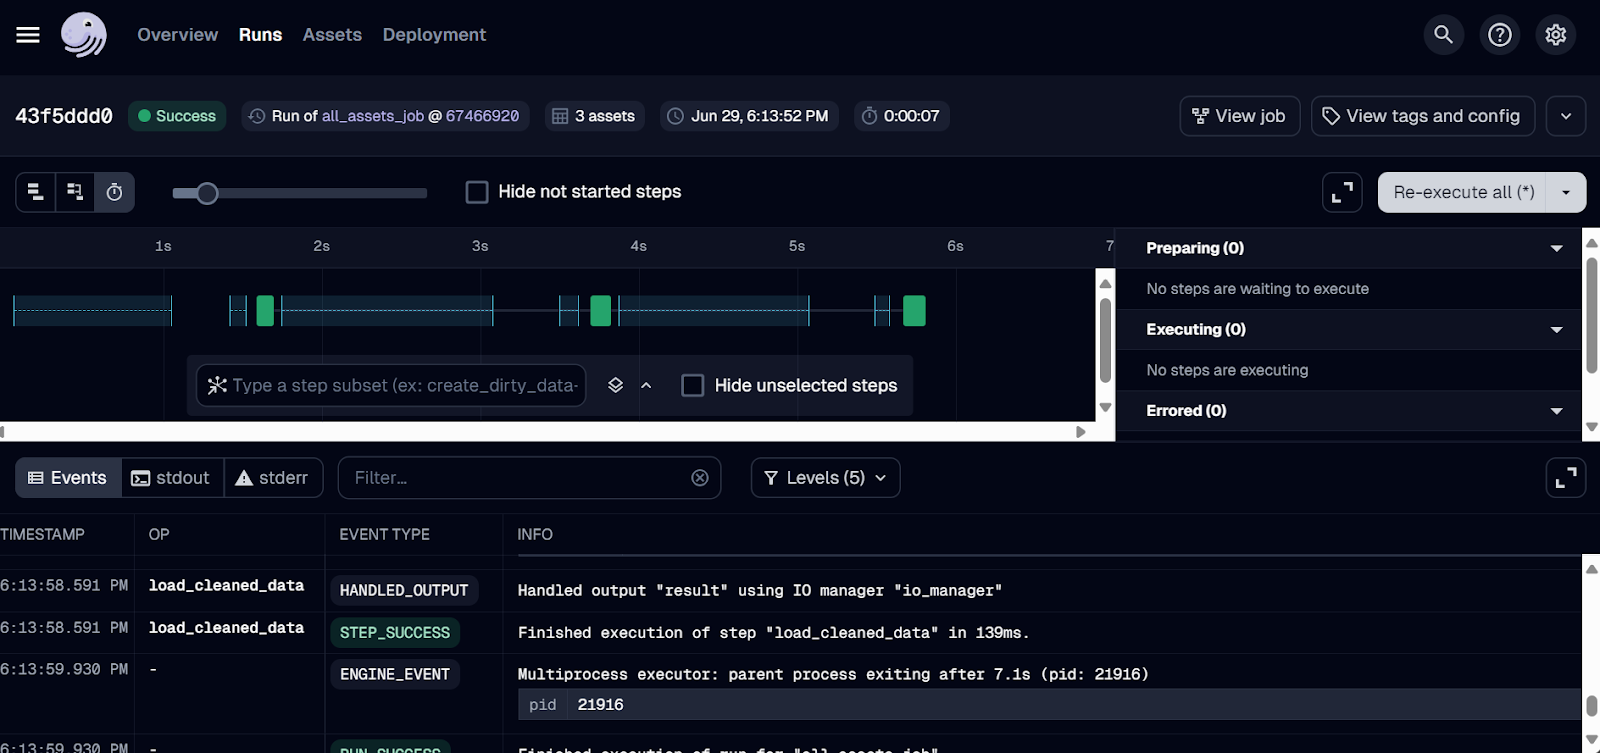
Dagster run logs.
3. Mage AI
Mage AI is an open-source hybrid data orchestration framework. Hybrid means that you get the flexibility of a Jupyter Notebook and the control of modular code.
Anyone, even with limited knowledge of Python, can build, run, and monitor data pipelines. Instead of writing and running a Python file directly, you will create a Mage AI project and launch it in the dashboard, where you can build, run, and manage your data pipelines.
Compared to Airflow, Mage AI provides a user-friendly interface and ease of use, making it an excellent choice for those new to data engineering. It is designed with scalability in mind and is capable of handling large volumes of data and complex pipeline structures efficiently.
I felt strange because it was completely different from what I am used to. I had to install and launch the Mage AI web UI. It was supposed to be easy, but I found it difficult to build and run the ETL pipeline. On the other hand, I can see why this unique design can be attractive to individuals who are new to the field, as it is basically drag and drop and pressing buttons.
Abid Ali Awan, Author
Getting started with Mage AI
Starting the Mage AI is pretty simple. We just have to install the Mage AI Python package.
$ pip install mage-aiAnd start the Mage AI project.
$ mage start mage_ai_etl The above command will initiate the web server. As mentioned before, all code editing, job running, and job monitoring are done through the Mage AI UI.
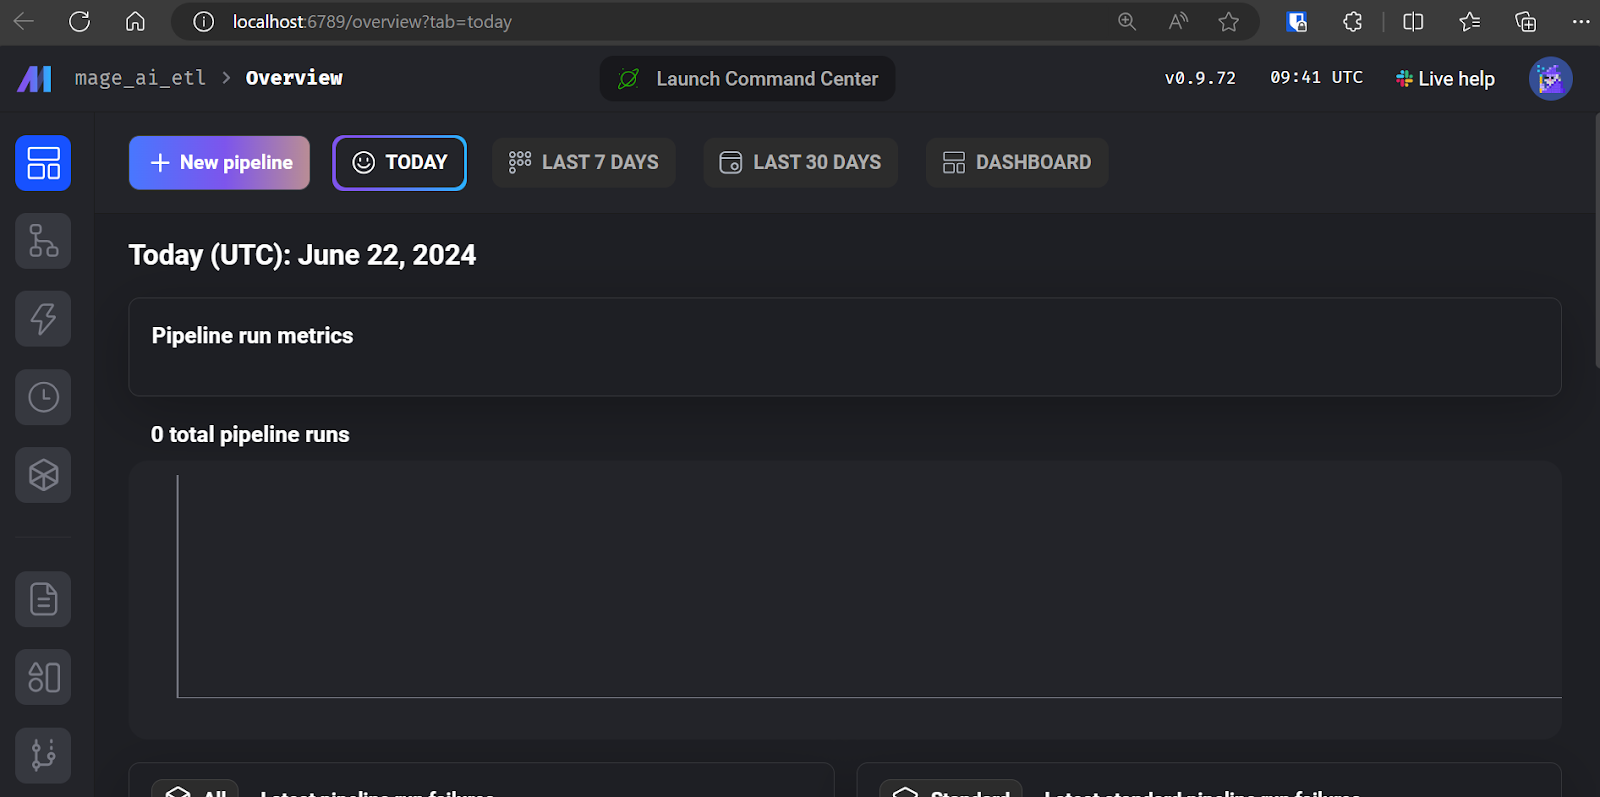
Mage AI UI.
Click on “+ New pipeline” to create your first ETL pipeline. I named mine “simple_etl.”
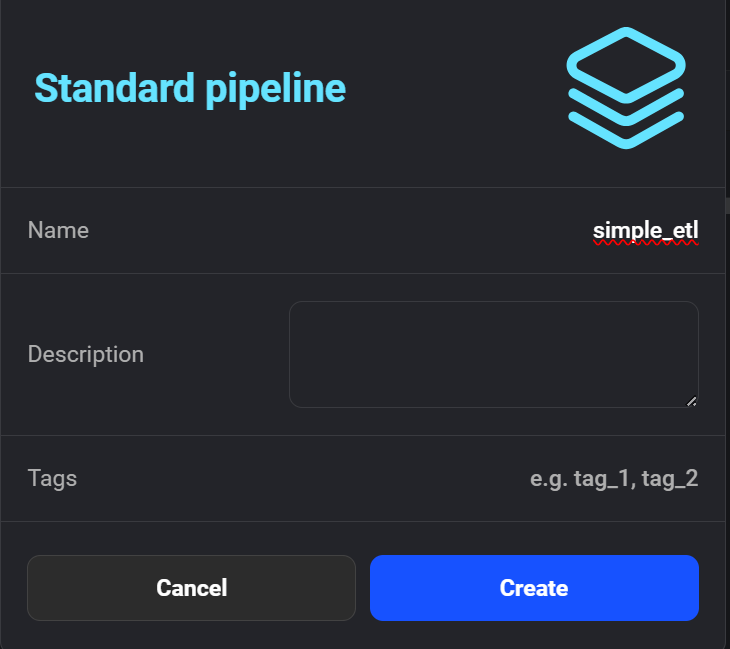
Creating the new pipeline in Mage AI.
Then, the interface will ask you to add a module to start coding. Select the “Data Loader” module and write the following Python code.
Here, we declare a create_sample_csv() function, which is the first step in our pipeline. We use the Mage AI @data_loader decorator. We also define a test_output() function that asserts if the output exists. This helps with task dependency management.
import io
import pandas as pd

if 'data_loader' not in globals():
    from mage_ai.data_preparation.decorators import data_loader
if 'test' not in globals():
    from mage_ai.data_preparation.decorators import test

@data_loader
def create_sample_csv() -> pd.DataFrame:
    """
    Create a sample CSV file with duplicates and missing values
    """
    csv_data = """
category,product,quantity,price
Electronics,Laptop,5,1000
Electronics,Smartphone,10,500
Clothing,T-shirt,50,20
Clothing,Jeans,30,50
Books,Novel,100,15
Books,Textbook,20,80
Electronics,Laptop,5,1000
Clothing,T-shirt,,20
Electronics,Tablet,,300
Books,Magazine,25,
"""
    return pd.read_csv(io.StringIO(csv_data.strip()))

@test
def test_output(df) -> None:
    """
    Template code for testing the output of the block.
    """
    assert df is not None, 'The output is undefined'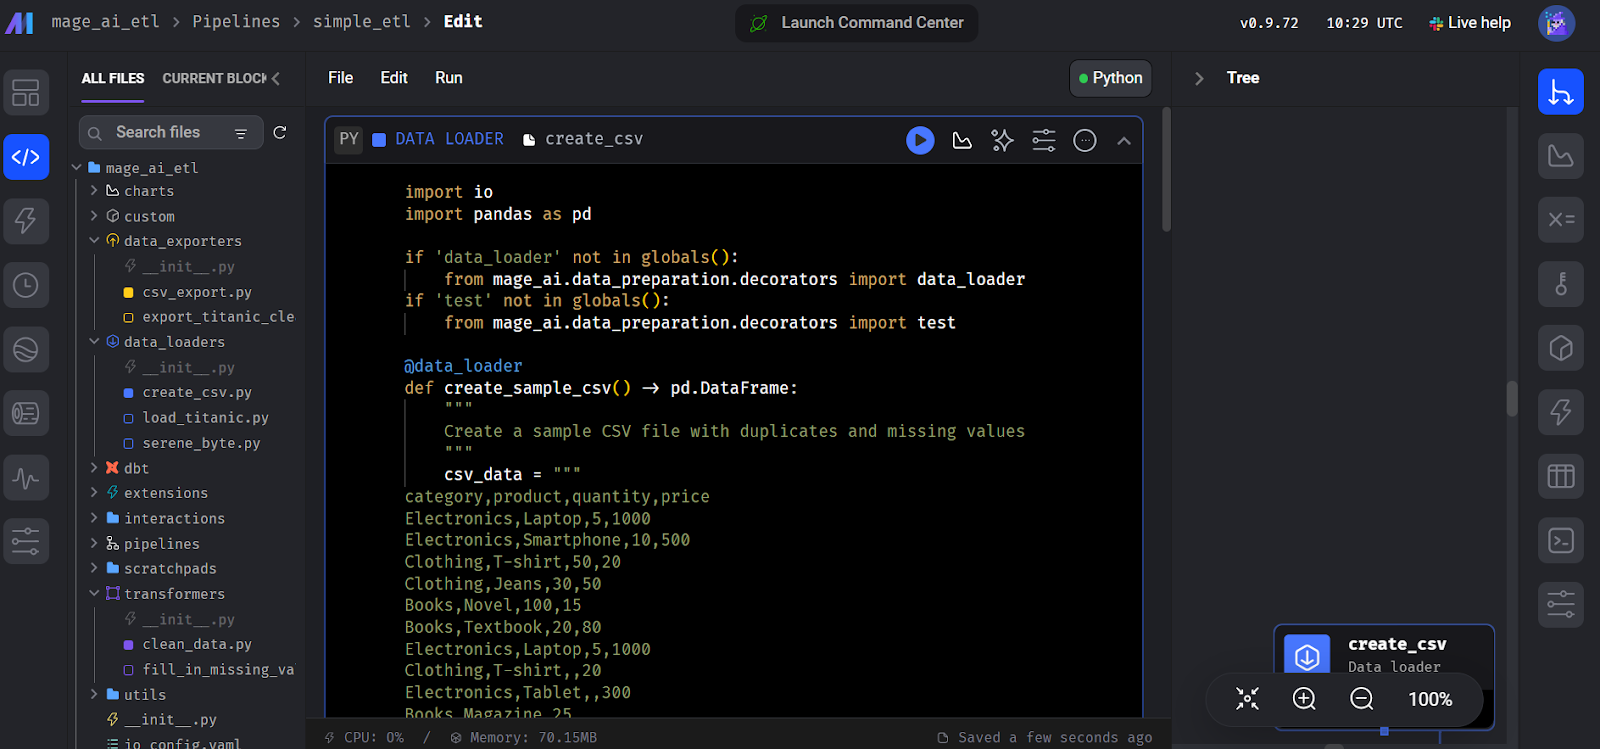
Creating the data loader block in Mage AI.
Next, create another module called “Transformer” and add the clean_data() function, as shown in the code below.
You may ignore the test() function; you just have to add the main transformer function, clean_data().
import pandas as pd

if 'transformer' not in globals():
    from mage_ai.data_preparation.decorators import transformer
if 'test' not in globals():
    from mage_ai.data_preparation.decorators import test

@transformer
def clean_data(df: pd.DataFrame) -> pd.DataFrame:
    """
    Clean and transform the data
    """
    # Remove duplicates
    df = df.drop_duplicates()
    # Fill missing values with 0
    df = df.fillna(0)
    return df

@test
def test_output(df) -> None:
    """
    Template code for testing the output of the block.
    """
    assert df is not None, 'The output is undefined'
Similarly, create a “Data Exporter” module and add the following code. The code declares a data loading function, export_data_to_csv(), that saves the transformed data into a CSV file.
import pandas as pd

if 'data_exporter' not in globals():
    from mage_ai.data_preparation.decorators import data_exporter

@data_exporter
def export_data_to_csv(df: pd.DataFrame) -> None:
    """
    Export the processed data to a CSV file
    """
    df.to_csv('output_data.csv', index=False)
    print("Data exported successfully to output_data.csv")
To run the pipeline, go to the “Trigger” tab, and click on “Run@once”.
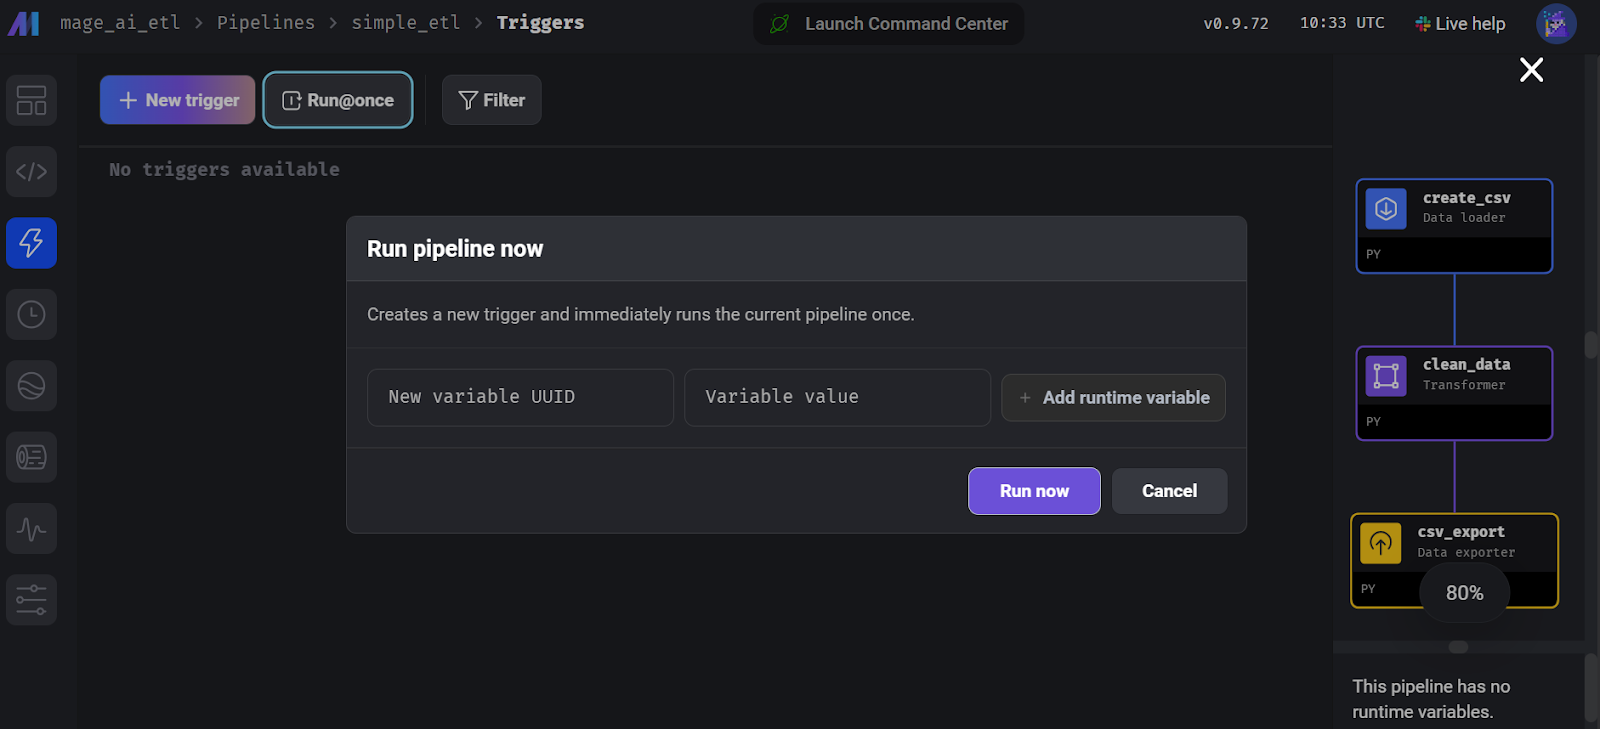
Running the pipeline in Mage AI.
To view the run logs, go to the “Runs” tab and click on the “Logs” button on the recently run pipeline.
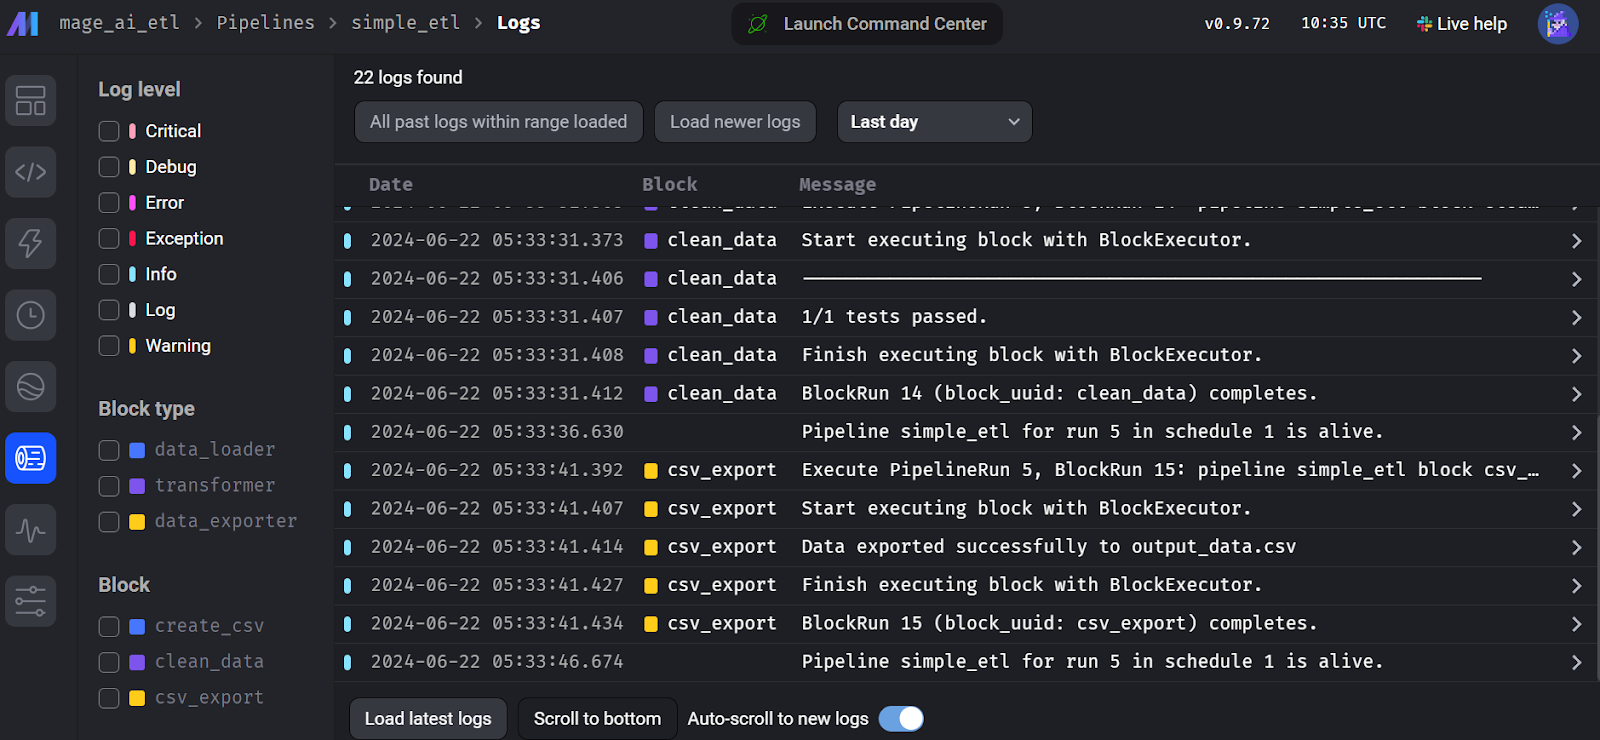
Mage AI flow run logs.
4. Kedro
Kedro is another popular open-source data orchestration framework that is slightly different from the other tools. It was created for machine learning engineers and borrows many concepts from software engineering, applying them to machine learning projects.
Kedro is designed to be highly modular, which means that even to export a dataset, you have to create a data catalog that specifies the location and type of data, ensuring standardized and efficient data management throughout the pipeline.
To understand how Kedro fits into the machine learning ecosystem, you can explore various MLOps tools by reading the article 25 Top MLOps Tools You Need to Know in 2024.
Compared to Airflow, the Kedro API is simpler to build a data pipeline. It focuses more on machine learning engineering and offers data categorization and versioning.
The coding part is pretty straightforward, but issues arise when you want to execute your pipeline. You have to create a data catalog, register the pipeline, and figure out the Kedro project structure. I would say it is more challenging compared to Dagster and Prefect. However, I understand why it is designed this way: to make your data pipeline reliable and error-free.
Abid Ali Awan, Author
Getting started with Kedro
Building a Kedro data pipeline is a different game. The framework is modular, and you need to understand the project structure and the various steps involved to execute the workflow successfully.
Start by installing the Kedro Python package.
$ pip install kedroInitialize the Kedro project.
$ kedro new --name=kedro_etl --tools=none --example=n Move to the project directory.
$ cd kedro-etl Create a folder within the pipelines folder called data_processing.
$ mkdir -p src/kedro_etl/pipelines/data_processing Create a Python file called kedro_pipe.py and open it in your favorite IDE, for example, you can use Visual Studio Code.
$ code src/kedro_etl/pipelines/data_processing/kedro_pipe.pyThe Python script should contain the extract, transform, and load functions, which are nodes in the pipeline. In this case, these are the create_sample_data(), clean_data(), and load_and_process_data() functions.
Then, we join these nodes using the Kedro Pipeline class inside the create_pipeline() function. In the pipeline function, we define nodes, and each node has inputs, outputs, and a node name.
import pandas as pd
import numpy as np
from kedro.pipeline import Pipeline, node

def create_sample_data():
    data = {
        'id': range(1, 101),
        'name': [f'Person_{i}' for i in range(1, 101)],
        'age': np.random.randint(18, 80, 100),
        'salary': np.random.randint(20000, 100000, 100),
        'missing_values': [np.nan if i % 10 == 0 else i for i in range(100)]
    }
    return pd.DataFrame(data)

def clean_data(df: pd.DataFrame):
    # Remove rows with missing values
    df_cleaned = df.dropna()

    # Convert salary to thousands
    df_cleaned['salary'] = df_cleaned['salary'] / 1000

    # Capitalize names
    df_cleaned['name'] = df_cleaned['name'].str.upper()

    return df_cleaned

def load_and_process_data(df: pd.DataFrame):
    # Calculate average salary
    avg_salary = df['salary'].mean()

    # Add a new column for salary category
    df['salary_category'] = df['salary'].apply(
        lambda x: 'High' if x > avg_salary else 'Low')

    # Calculate age groups
    df['age_group'] = pd.cut(df['age'], bins=[0, 30, 50, 100], labels=[
                             'Young', 'Middle', 'Senior'])

    print(df)
    return df

def create_pipeline(**kwargs):
    return Pipeline(
        [
            node(
                func=create_sample_data,
                inputs=None,
                outputs="raw_data",
                name="create_sample_data_node",
            ),
            node(
                func=clean_data,
                inputs="raw_data",
                outputs="cleaned_data",
                name="clean_data_node",
            ),
            node(
                func=load_and_process_data,
                inputs="cleaned_data",
                outputs="processed_data",
                name="load_and_process_data_node",
            ),
        ]
    )
If we run the pipeline without creating the data catalog, it won't export our data. So, we need to go to the conf/base/catalog.yml file and edit it by providing the dataset configuration.
raw_data:
  type: pandas.CSVDataset
  filepath: ./data/kedro/sample_data.csv

cleaned_data:
  type: pandas.CSVDataset
  filepath: ./data/kedro/cleaned_data.csv

processed_data:
  type: pandas.CSVDataset
  filepath: ./data/kedro/processed_data.csv
We must also include our newly created Python file within the pipeline registry. To do so, go to the src/simple_etl/pipeline_registry.py Python file and include the following code.
"""Project pipelines."""
from __future__ import annotations

from kedro.pipeline import Pipeline
from kedro_etl.pipelines.data_processing import kedro_pipe

def register_pipelines() -> Dict[str, Pipeline]:
    data_processing_pipeline = kedro_pipe.create_pipeline()

    return {
        "__default__": data_processing_pipeline,
        "data_processing": data_processing_pipeline,
    }
Run the pipeline and view the live logs within the terminal by running the following command.
$ kedro run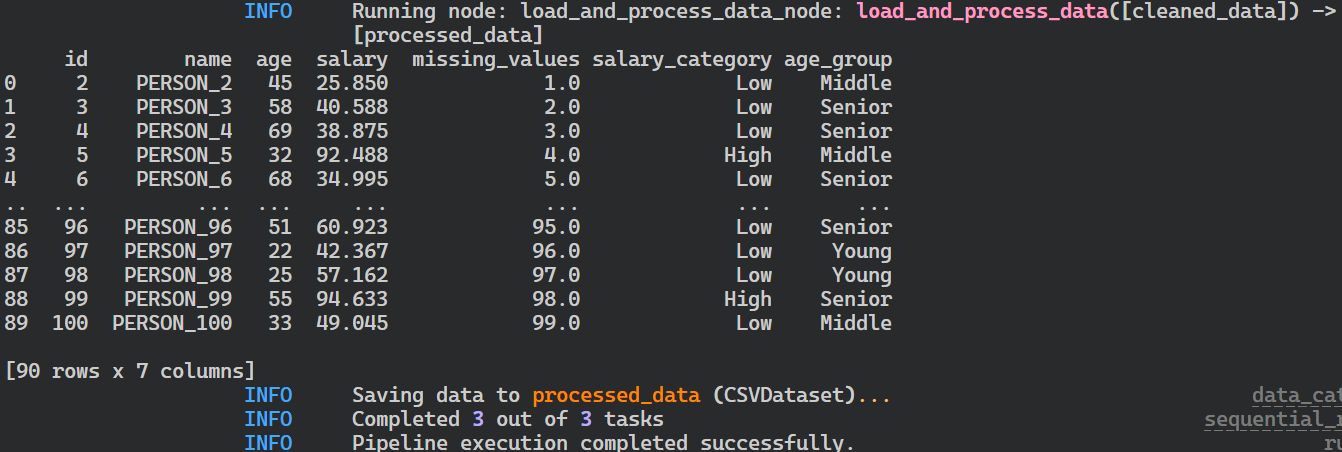
Logs of Kedro pipeline run.
After running the pipeline, your files will be stored in CSV file format in the location defined in the data catalog.
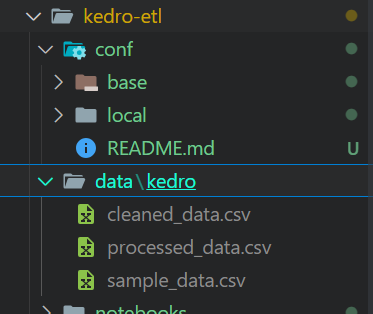
Output files of Kedro pipeline run.
If you face issues running the pipeline, please consider installing Kedro with all extensions.
$ pip install "kedro[all]"Kedro visualization
We can visualize and share our pipelines by installing the kedro-viz tool.
$ pip install kedro-vizThen, executing the following command will allow us to visualize all the data pipelines and data nodes. It also provides an option for experiment tracing and the ability to share the pipeline visualization.
$ kedro viz run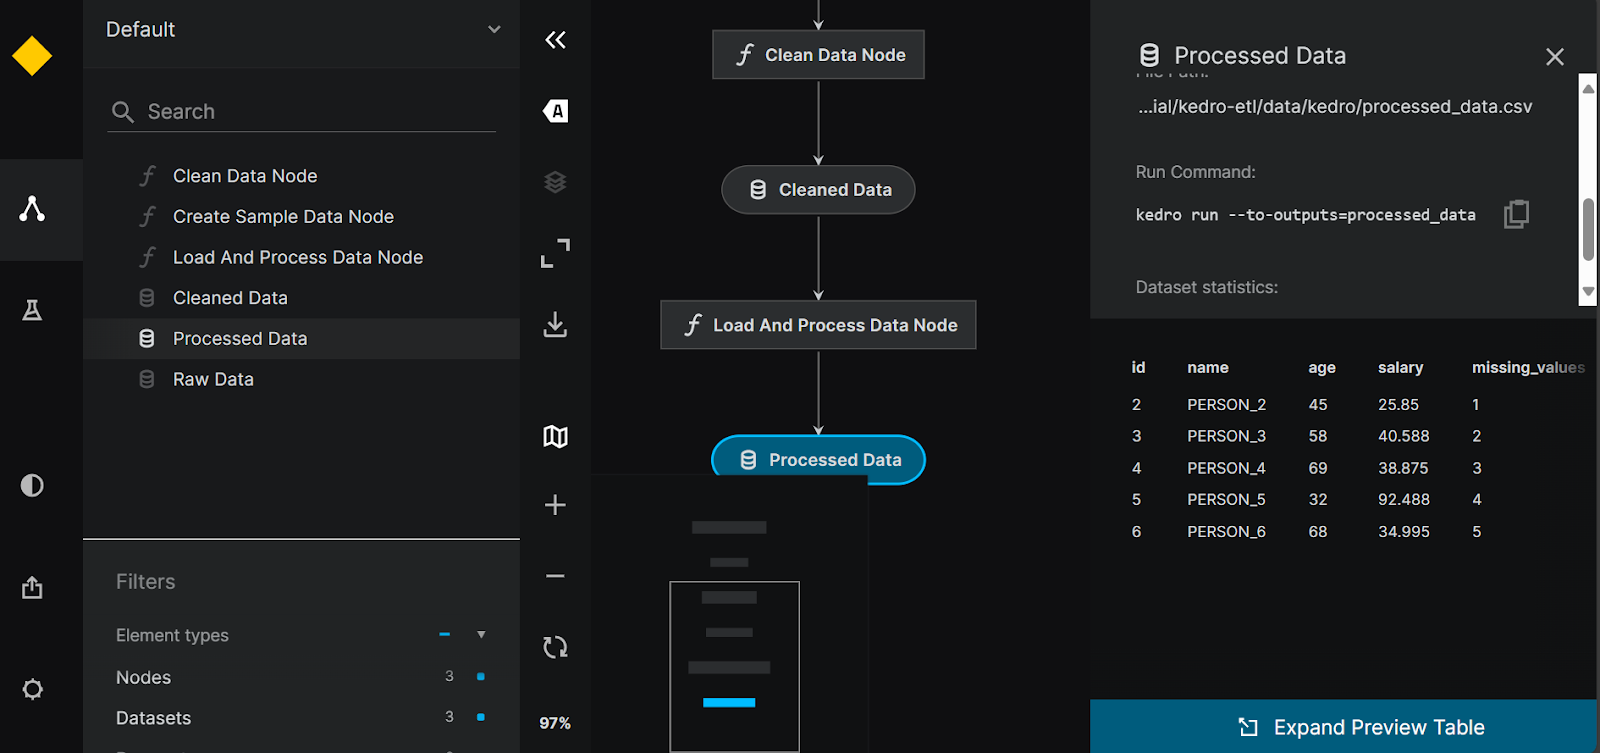
Kedro pipeline visualization.
5. Luigi
Luigi is an open-source, Python-based framework developed by Spotify that excels in managing long-running batch processes and complex data pipelines. It is good at dependency resolution, workflow management, visualization, and failure recovery, making it a powerful tool for orchestrating data workflows.
Compared to Airflow, Luigi has a minimal API, calendar scheduling, and a loyal user base that will help you with any issues related to the data orchestration pipeline.
If you are a beginner in Python, you may find it difficult to build and run the pipelines. However, documentation and guides can help you get started quickly. Logs provide limited information, and the dashboard is just a visualization tool for DAGs and dependencies.
Abid Ali Awan, Author
Getting started with Luigi
Creating a Luigi data pipeline requires an understanding of object-oriented programming. Let’s start by installing the Luigi Python package.
$ pip install luigiTo develop a simple ETL pipeline in Luigi, we will create interconnected tasks. Instead of creating Python functions as tasks, we will create a Python class for each step within the pipeline, FetchData, ProcessData and GenerateReport. Each class will have three functions called: requires(), output(), and run().
The requires() and output() functions will connect the tasks, and the run() function will execute the processing code. In the end, we will build the pipeline using the last task in the pipeline.
import luigi
import pandas as pd
import numpy as np

class FetchData(luigi.Task):
    def output(self):
        return luigi.LocalTarget('data/fetch_data.csv')

    def run(self):
        # Simulate fetching data by creating a sample CSV file
        data = {
            'column1': [1, 2, np.nan, 4],
            'column2': ['A', 'B', 'C', np.nan]
        }
        df = pd.DataFrame(data)
        df.to_csv(self.output().path, index=False)

class ProcessData(luigi.Task):
    def requires(self):
        return FetchData()

    def output(self):
        return luigi.LocalTarget('data/process_data.csv')

    def run(self):
        df = pd.read_csv(self.input().path)
        # Fill missing values
        df['column1'].fillna(df['column1'].mean(), inplace=True)
        df['column2'].fillna('B', inplace=True)
        df.to_csv(self.output().path, index=False)

class GenerateReport(luigi.Task):
    def requires(self):
        return ProcessData()

    def output(self):
        return luigi.LocalTarget('data/generate_report.txt')

    def run(self):
        df = pd.read_csv(self.input().path)
        # Simple data analysis: calculate mean of column1 and value counts of column2
        mean_column1 = df['column1'].mean()
        value_counts_column2 = df['column2'].value_counts()

        with self.output().open('w') as out_file:
            out_file.write(f'Mean of column1: {mean_column1}\n')
            out_file.write('Value counts of column2:\n')
            out_file.write(value_counts_column2.to_string())

if __name__ == '__main__':
    luigi.build([GenerateReport()], local_scheduler=True)
Run the above code in the Jupyter Notebook or create the Python file and run it using the terminal.
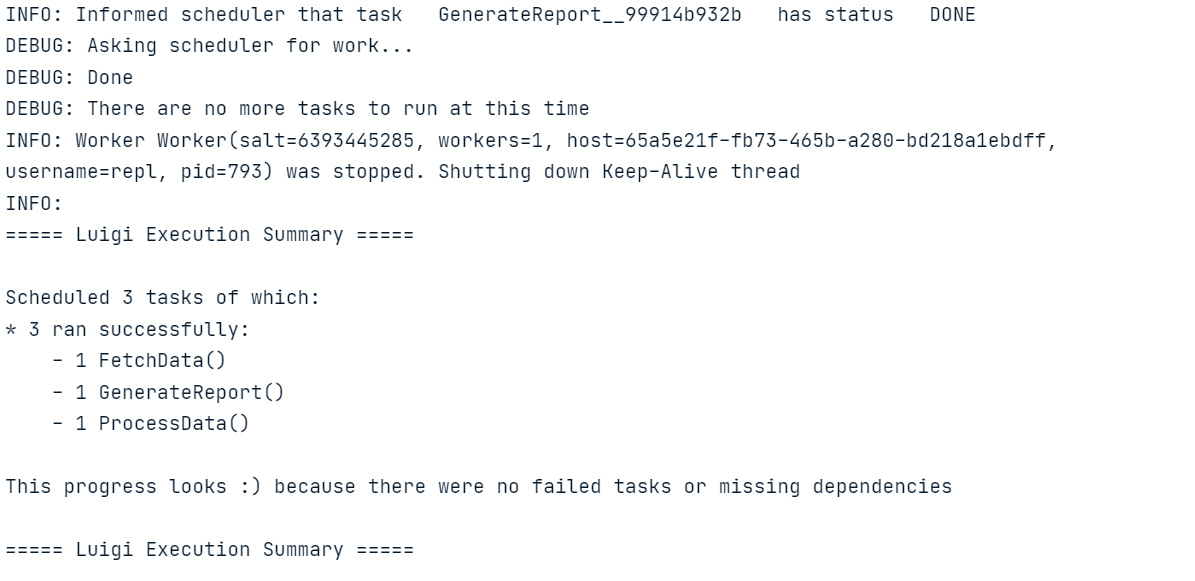
Similar to Luigi, you can also learn how to build an ETL pipeline with Apache Airflow. The tutorial covers the basics of extracting, transforming, and loading data with Apache Airflow.
Luigi central planner
We need to initialize the Luigi central planner to schedule pipeline runs or trigger them with an event.
Start the scheduler by typing the following command in the terminal.
$ luigid 2024-06-22 13:35:18,636 luigi[25056] INFO: logging configured by default settings
2024-06-22 13:35:18,636 luigi.scheduler[25056] INFO: No prior state file exists at /var/lib/luigi-server/state.pickle. Starting with empty state
2024-06-22 13:35:18,640 luigi.server[25056] INFO: Scheduler starting upTo run the pipeline, launch a new terminal and type the following command. The Luigi command requires a Python file name and the last task we want to execute. In this case, the file name is luigi_pipe.py, and our last Luigi task is GenerateReport.
$ python -m luigi --module luigi_pipe GenerateReportIf you want to visualize the pipeline run and task status, you can simply go to http://localhost:8082 in your browser.
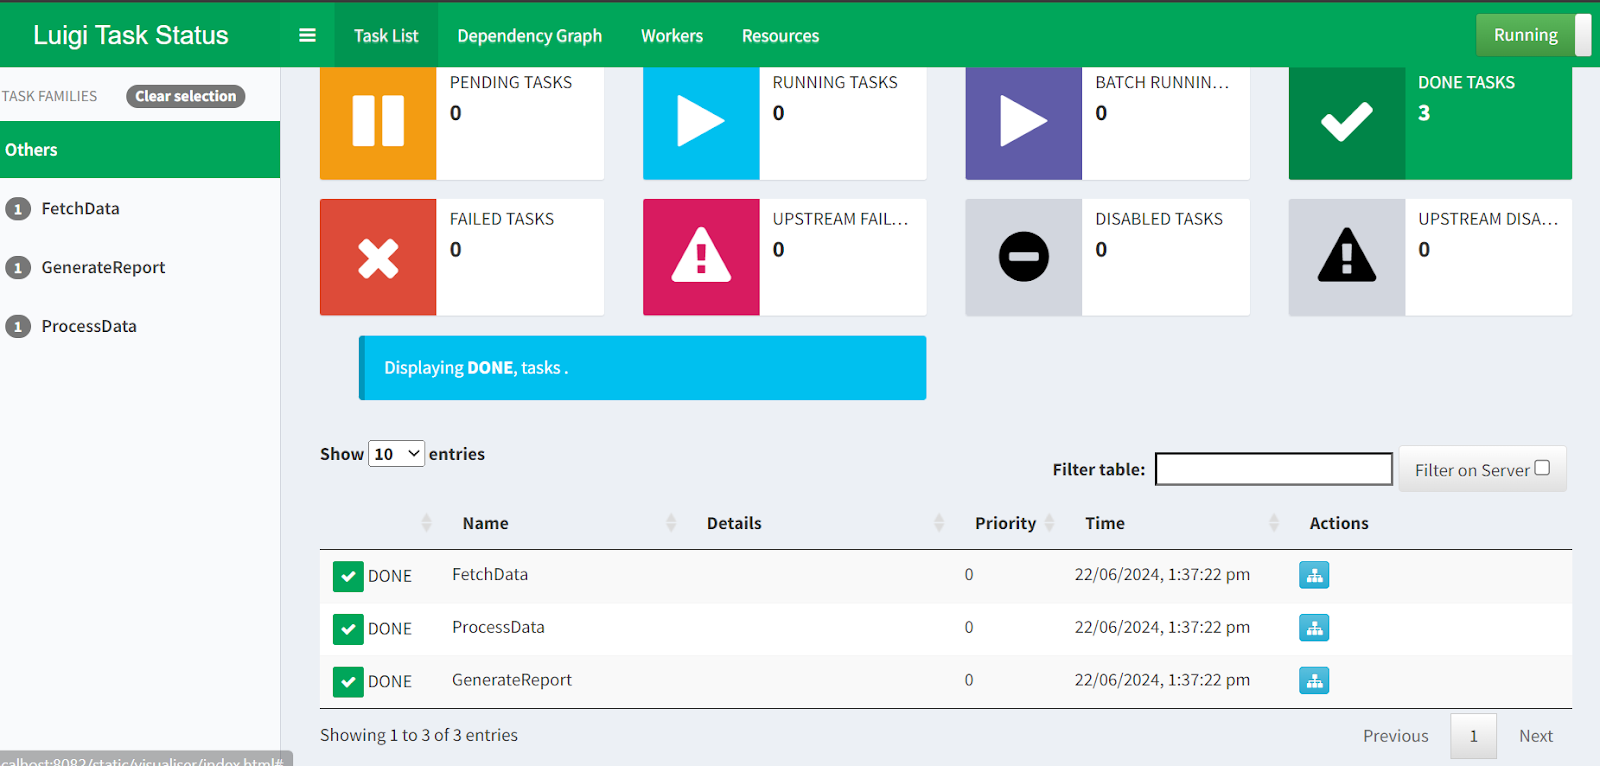
Luigi Central Planner webUI.
That wraps our walkthrough of the 5 best alternatives to Airflow! If you want to dive deeper into any of the examples presented in this article, here are some resources to consider:
- For Prefect, Dagster, and Luigi source code and data, please refer to the DataLab workspace.
- For Mage AI and Kedro code source and data, please refer to the GitHub repository.
Final Thoughts
In this tutorial, we have discussed the top open-source, free Airflow alternatives. We have also learned about each data orchestration tool, and built and executed a simple ETL pipeline. Seeing code examples will help you decide which one works best for your use case.
If you are a beginner, I suggest starting with Prefect or Mage AI, as they are user-friendly and come with a simple setup. However, if you are looking for more advanced tools that adhere to software engineering practices, I recommend exploring Dagster, Kedro, and Luigi.
After exploring this article, the next natural step in your data engineering journey is to get a certification like DataCamp’s Data Engineer in Python to learn about other tools and build an end-to-end data pipeline that you can deploy to production.

As a certified data scientist, I am passionate about leveraging cutting-edge technology to create innovative machine learning applications. With a strong background in speech recognition, data analysis and reporting, MLOps, conversational AI, and NLP, I have honed my skills in developing intelligent systems that can make a real impact. In addition to my technical expertise, I am also a skilled communicator with a talent for distilling complex concepts into clear and concise language. As a result, I have become a sought-after blogger on data science, sharing my insights and experiences with a growing community of fellow data professionals. Currently, I am focusing on content creation and editing, working with large language models to develop powerful and engaging content that can help businesses and individuals alike make the most of their data.


