Course
In the world of data analysis, Python is a popular language due to its versatility and extensive ecosystem of libraries. Data manipulation and analysis play a crucial role in extracting insights and making informed decisions. However, as datasets continue to grow in size and complexity, the need for high-performance solutions becomes paramount.
Handling large datasets efficiently requires tools that can deliver speedy computations and optimized operations. This is where Polars comes into the picture. Polars is a powerful open-source library specifically designed for high-performance data manipulation and analysis in Python.
Polars Features
Polars is a DataFrame library completely written in Rust and is built to empower Python developers with a scalable and efficient framework for handling data and is considered as an alternative to the very popular pandas library. It provides a wide range of functionalities that facilitate various data manipulation and analysis tasks. Some of the key features and advantages of using Polars include:
1. Speed and performance
Polars is engineered with performance in mind. It leverages parallel processing and memory optimization techniques, allowing it to process large datasets significantly faster than traditional methods.
2. Data manipulation capabilities
Polars provides a comprehensive toolkit for data manipulation, encompassing essential operations such as filtering, sorting, grouping, joining, and aggregating data. While Polars may not have the same extensive functionality as pandas due to its relative novelty, it covers approximately 80% of the common operations found in Pandas.
3. Expressive syntax
Polars employs a concise and intuitive syntax, making it easy to learn and use. Its syntax is reminiscent of popular Python libraries like pandas, allowing users to quickly adapt to Polars and leverage their existing knowledge.
4. DataFrame and series structures
At the core of Polars are the DataFrame and Series structures, which provide a familiar and powerful abstraction for working with tabular data. DataFrame operations in Polars can be chained together, enabling efficient and concise data transformations.
5. Polars support lazy evaluation
Polars incorporates lazy evaluation, which involves examining and optimizing queries to enhance their performance and minimize memory consumption. When working with Polars, the library analyzes your queries and seeks opportunities to expedite their execution or reduce memory usage. In contrast, Pandas solely supports eager evaluation, whereby expressions are promptly evaluated upon encountering them.
Why Choose Polars When We Have pandas?
pandas, a widely adopted library, is known for its flexibility and ease of use. However, when dealing with large datasets, Pandas can suffer from performance bottlenecks due to its reliance on single-threaded execution. As the dataset size increases, processing times can become prohibitively long, limiting productivity.
Polars has been specifically designed to handle large datasets efficiently. With its lazy evaluation strategy and parallel execution capabilities, Polars excels at processing substantial amounts of data swiftly. By distributing computations across multiple CPU cores, Polars leverages parallelism to deliver impressive performance gains. See the speed comparison test between Pandas and Polars by Yuki.
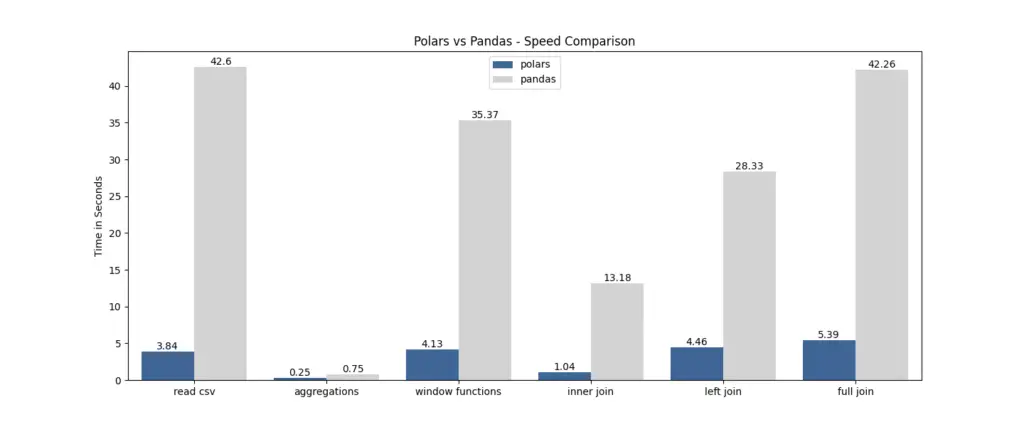
For a full comparison of Polars vs pandas, check out our separate article.
Installing Polars
Polars can be installed via pip, the Python package manager. Open your command-line interface and run the following command:
install polars
Loading a Dataset in Polars
Polars provides convenient methods to load data from various sources, including CSV files, Parquet files, and Pandas DataFrames. The methods to read CSV or parquet file is the same as the pandas library.
# read csv file
import polars as pl
data = pl.read_csv('https://raw.githubusercontent.com/pycaret/pycaret/master/datasets/diamond.csv')


# check the head
data.head()
Output:
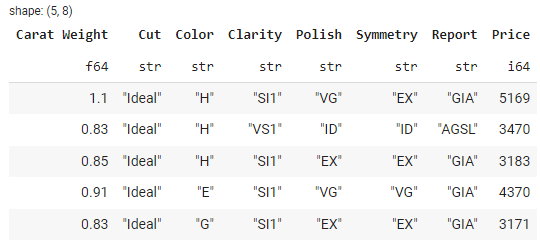
The type of data is polars.DataFrame.
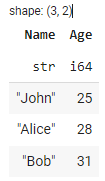
type(data)
>>> polars.dataframe.frame.DataFrame
Output:
Common Data Manipulation Functions with Polars
Polars provides a comprehensive set of functionalities for data manipulation, allowing you to select, filter, sort, transform, and clean your data with ease. Let's explore some common data manipulation tasks and how to accomplish them using Polars:
1. Selecting and filtering data
To select specific columns from a DataFrame, you can use the select() method. Here's an example:
import polars as pl


# Load diamond data from a CSV file
df = pl.read_csv('https://raw.githubusercontent.com/pycaret/pycaret/master/datasets/diamond.csv')


# Select specific columns: carat, cut, and price
selected_df = df.select(['Carat Weight', 'Cut', 'Price'])


# show selected_df head
selected_df.head()
Output:
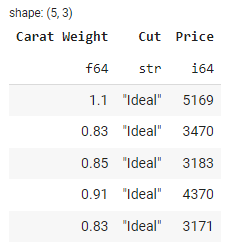
Filtering rows based on certain conditions can be done using the filter() method. For instance, to filter rows where the carat is greater than 1.0, you can do the following:
import polars as pl


# Load diamond data from a CSV file
df = pl.read_csv('https://raw.githubusercontent.com/pycaret/pycaret/master/datasets/diamond.csv')


# filter the df with condition
filtered_df = df.filter(pl.col('Carat Weight') > 2.0)


# show filtered_df head
filtered_df.head()
Output:
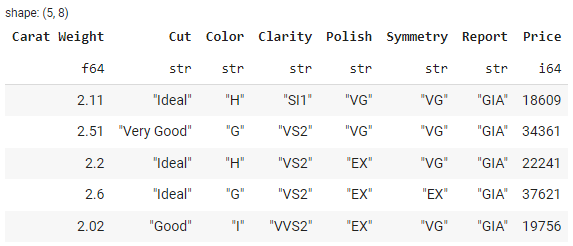
2. Sorting and ordering data
Polars provides the sort() method to sort a DataFrame based on one or more columns. Here's an example:
import polars as pl


# Load diamond data from a CSV file
df = pl.read_csv('https://raw.githubusercontent.com/pycaret/pycaret/master/datasets/diamond.csv')


# sort the df by price
sorted_df = df.sort(by='Price')


# show sorted_df head
sorted_df.head()
Output:
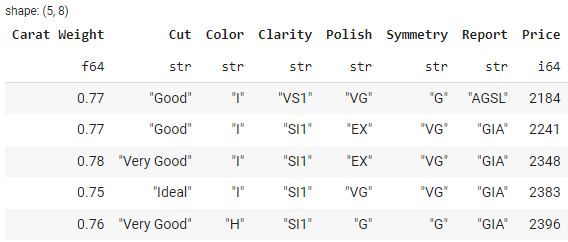
3. Handling missing values
Polars provides convenient methods to handle missing values. The drop_nulls() method allows you to drop rows that contain any missing values:
import polars as pl


# Load diamond data from a CSV file
df = pl.read_csv('https://raw.githubusercontent.com/pycaret/pycaret/master/datasets/diamond.csv')


# drop missing values
cleaned_df = df.drop_nulls()


# show cleaned_df head
cleaned_df.head()
Output:
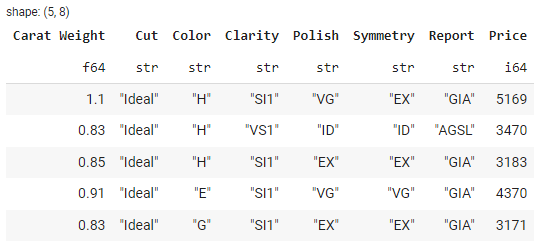
Alternatively, you can use the fill_nulls() method to replace missing values with a specified default value or fill method.
4. Grouping data based on specific columns
To group data based on specific columns, you can use the groupby() method. Here's an example that groups the data by the Cut column and calculates the average Price for each group:
import polars as pl


# Load diamond data from a CSV file
df = pl.read_csv('https://raw.githubusercontent.com/pycaret/pycaret/master/datasets/diamond.csv')


# group by cut and calc mean of price
grouped_df = df.groupby(by='Cut').agg(pl.col('Price').mean())


# show grouped_df head
grouped_df.head()
Output:
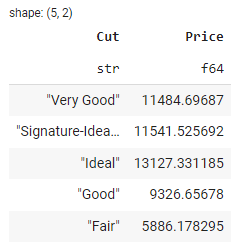
In the output above, you can see the average price of diamonds by Cut dimension.
5. Joining and combining DataFrames
Polars provides flexible options for joining and combining DataFrames, allowing you to merge and concatenate data from different sources. To perform a join operation, you can use the join() method. Here's an example that demonstrates an inner join between two DataFrames based on a common key column:
import polars as pl


# Create the first DataFrame
df1 = pl.DataFrame({
    'id': [1, 2, 3, 4],
    'name': ['Alice', 'Bob', 'Charlie', 'David']
})


# Create the second DataFrame
df2 = pl.DataFrame({
    'id': [2, 3, 5],
    'age': [25, 30, 35]
})


# Perform an inner join on the 'id' column
joined_df = df1.join(df2, on='id')


# Display the joined DataFrame
joined_df
Output:
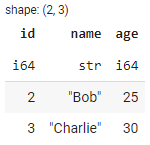
In this example, we create two DataFrames (df1 and df2) using the pl.DataFrame constructor. The first DataFrame df1 contains columns id and name, and the second DataFrame df2 contains columns id and age. We then perform an inner join on the id column using the join() method, specifying the id column as the join key.
Integration and Interoperability
Polars offers seamless integration with other popular Python libraries, enabling data analysts to leverage a wide range of tools and functionalities. Let's explore two key aspects of integration: working with other libraries and interoperability with Pandas.
Integrating Polars with other Python libraries
Polars integrates conveniently with libraries like NumPy and PyArrow, enabling users to combine the strengths of multiple tools in their data analysis workflows. With NumPy integration, Polars effortlessly converts between Polars DataFrames and NumPy arrays, leveraging NumPy's powerful scientific computing capabilities. This integration ensures smooth data transitions and allows analysts to directly apply NumPy functions to Polars data.
Similarly, by leveraging PyArrow, Polars optimizes data transfer between Polars and Arrow-based systems. This integration enables seamless work with data stored in Arrow format and harnesses Polars' high-performance data manipulation capabilities.
Converting Polars DataFrames to pandas DataFrames
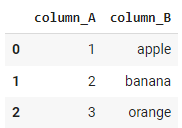
Polars provides a seamless conversion of Polars DataFrames to Pandas DataFrames. Here's an example illustrating the conversion from Polars to pandas.
import polars as pl
import pandas as pd


# Create a Polars DataFrame
df_polars = pl.DataFrame({
    'column_A': [1, 2, 3],
    'column_B': ['apple', 'banana', 'orange']
})


# Convert Polars DataFrame to Pandas DataFrame
df_pandas = df_polars.to_pandas()


# Display the Pandas DataFrame
df_pandas
Output:
Conclusion
Polars is a powerful library for high-performance data manipulation and analysis in Python. Its speed and performance optimizations make it an ideal choice for handling large datasets efficiently.
With its expressive syntax and DataFrame structures, Polars offers a familiar and intuitive interface for data manipulation tasks. Furthermore, Polars integrates seamlessly with other Python libraries such as NumPy and PyArrow, expanding its capabilities and allowing users to leverage a diverse ecosystem of tools.
The ability to convert Polars DataFrames to pandas DataFrames ensures interoperability and facilitates the integration of Polars into existing workflows. Whether you are working with complex data types, handling large datasets, or seeking performance improvements, Polars provides a comprehensive toolkit to unlock the full potential of your data analysis endeavors.


