Course
Intermediate Python
4 hr
1.4M

Let's start by looking at some of the general competency questions you might face in your interview. These test some of the soft skills you'll need as a data scientist:
This question assesses your communication skills and ability to simplify complex topics. Here's an example answer:
In my previous role, I had to explain the concept of machine learning to our marketing team. I used the analogy of teaching a child to recognize different types of fruit. Just as you would show a child many examples to help them learn, a machine learning model is trained with data. This analogy helped make a complex concept more relatable and easier to understand.
This explores your team collaboration skills and conflict resolution abilities. You could answer this with something like:
In one project, I worked with a colleague who had a very different working style. To resolve our differences, I scheduled a meeting to understand his perspective. We found common ground in our project goals and agreed on a shared approach. This experience taught me the value of open communication and empathy in teamwork.
This question is about time management and prioritization. Here's an example answer:
Once, I had to deliver an analysis within a very tight deadline. I prioritized the most critical parts of the project, communicated my plan to the team, and focused on efficient execution. By breaking down the task and setting mini-deadlines, I managed to complete the project on time without compromising quality.
Here, the interviewer is looking at your ability to own up to mistakes and learn from them. You could respond with:
In one instance, I misinterpreted the results of a data model. Upon realizing my error, I immediately informed my team and reanalyzed the data. This experience taught me the importance of double-checking results and the value of transparency in the workplace.
This shows your commitment to continuous learning and staying relevant in your field. Here's a sample answer:
I stay updated by reading industry journals, attending webinars, and participating in online forums. I also set aside time each week to experiment with new tools and techniques. This not only helps me stay current but also continuously improves my skills.
This question assesses adaptability and problem-solving skills. As an example, you could say:
In a previous project, the requirements changed frequently. I adapted by maintaining open communication with stakeholders to understand their needs. I also used agile methodologies to be more flexible in my approach, which helped in accommodating changes effectively.
This evaluates your ability to consider various aspects beyond just the data. An example answer could be:
In my last role, I had to balance the need for data-driven decisions with ethical considerations. I ensured that all data usage complied with ethical standards and privacy laws, and I presented alternatives when necessary. This approach helped in making informed decisions while respecting ethical boundaries.
The four assumptions from a linear regression are:
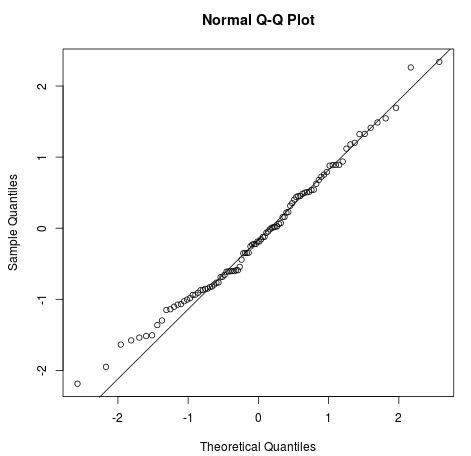
Image from Statology
You can explore the concepts and applications of linear models by taking our Introduction to Linear Modeling in Python course.
There are various ways to handle missing data. You can:
Learn how to diagnose, visualize and treat missing data by completing Handling Missing Data with Imputations in R course.
First, you need to learn more about the stakeholder’s background and use this information to modify your wording. If he has a finance background, learn about commonly used terms in finance and use them to explain the complex methodology.
Second, you need to use a lot of visuals and graphs. People are visual learners, as they learn immensely better with the use of creative communication tools.
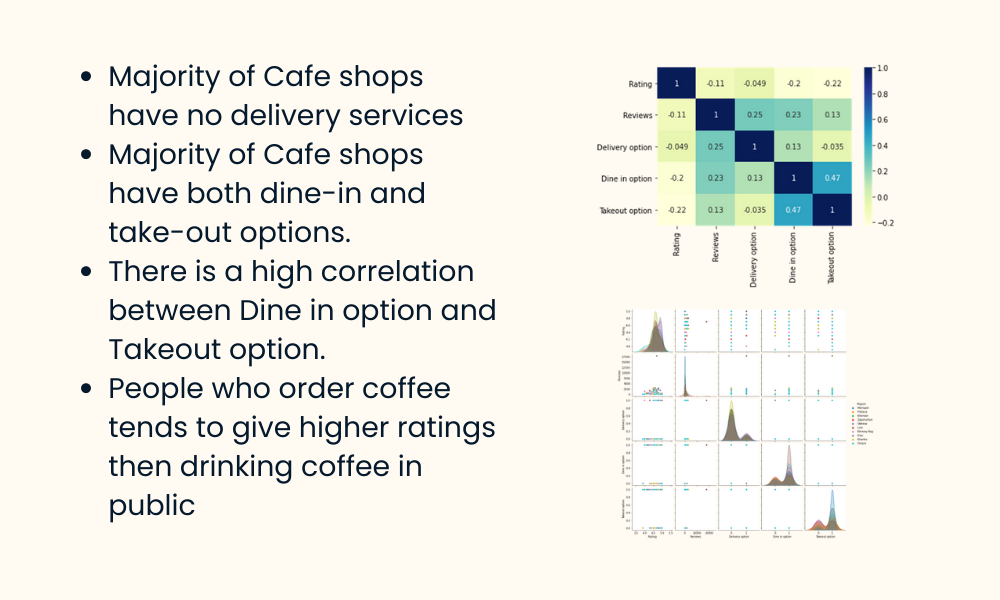
Image by Author
Third, speak in terms of results. Don’t try to explain the methodologies or statistics. Try to focus on how they can use the information from the analysis to improve the business or workflow.
Finally, encourage them to ask you questions. People are scared or even embarrassed to ask questions on unknown subjects. Create a two-way communication channel by engaging them in the discussion.
Learn to build your own SQL reports and dashboards by taking our Reporting in SQL course.
A p-value measures the probability of observing results at least as extreme as the data collected, assuming the null hypothesis is true.
A p-value below your significance level (typically 0.05) gives you evidence to reject the null hypothesis. For example, in an A/B test with a p-value of 0.03, there is only a 3% chance of seeing this outcome under the null hypothesis, which suggests the variant had a real effect.
A common misconception: a p-value does not measure the probability that the null hypothesis is true, only how compatible the data is with it.
These are two types of mistakes in hypothesis testing:
Lowering α reduces Type I errors but increases Type II errors. The right tradeoff depends on the cost of each mistake in your specific use case—critical in fraud detection, medical diagnosis, or A/B testing decisions.
Learn more in our Hypothesis Testing Made Easy tutorial.
There are three main methods for feature selection: filter, wrapper, and embedded methods.
Filter Methods
Filter methods are generally used in preprocessing steps. These methods select features from a dataset independent of any machine learning algorithms. They are fast, require fewer resources, and remove duplicated, correlated, and redundant features.

Image by Author
Some techniques used are:
Wrapper Methods
In wrapper methods, we train the model iteratively using a subset of features. Based on the results of the trained model, more features are added or removed. They are computationally more expensive than filter methods but provide better model accuracy.
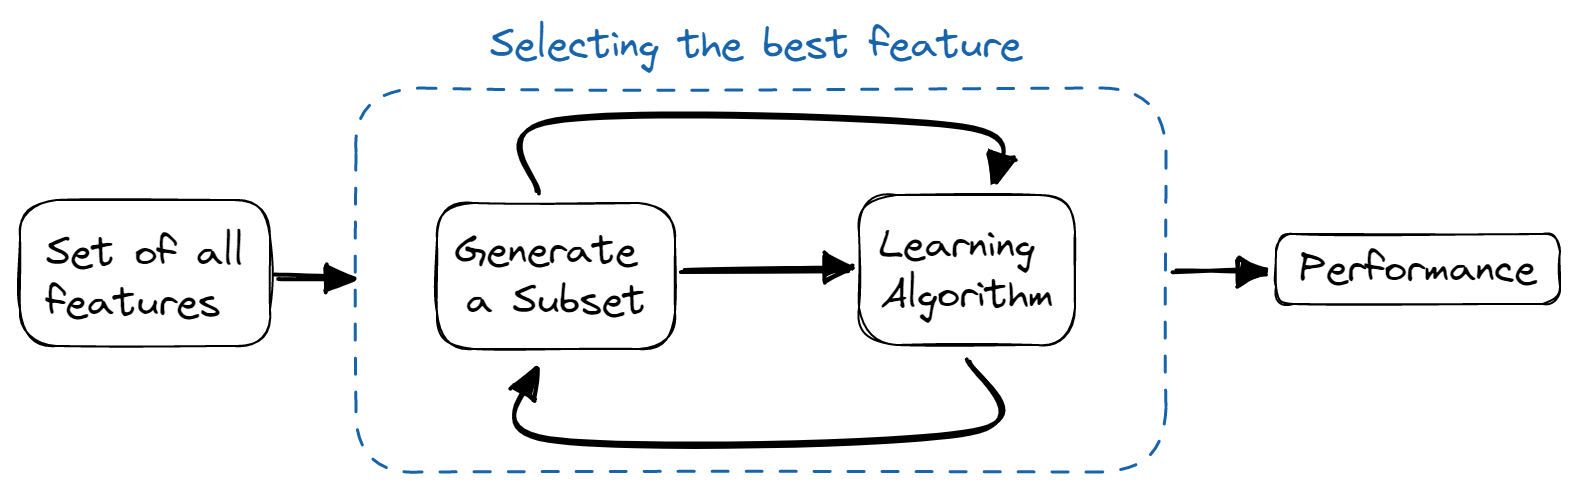
Image by Author
Some techniques used are:
Embedded Methods
Embedded methods combine the qualities of filter and wrapper methods. The feature selection algorithm is blended as a part of the learning algorithm, providing the model with a built-in feature selection method. These methods are faster, like the filter methods, accurate like the wrapper methods, and take into consideration a combination of features as well.
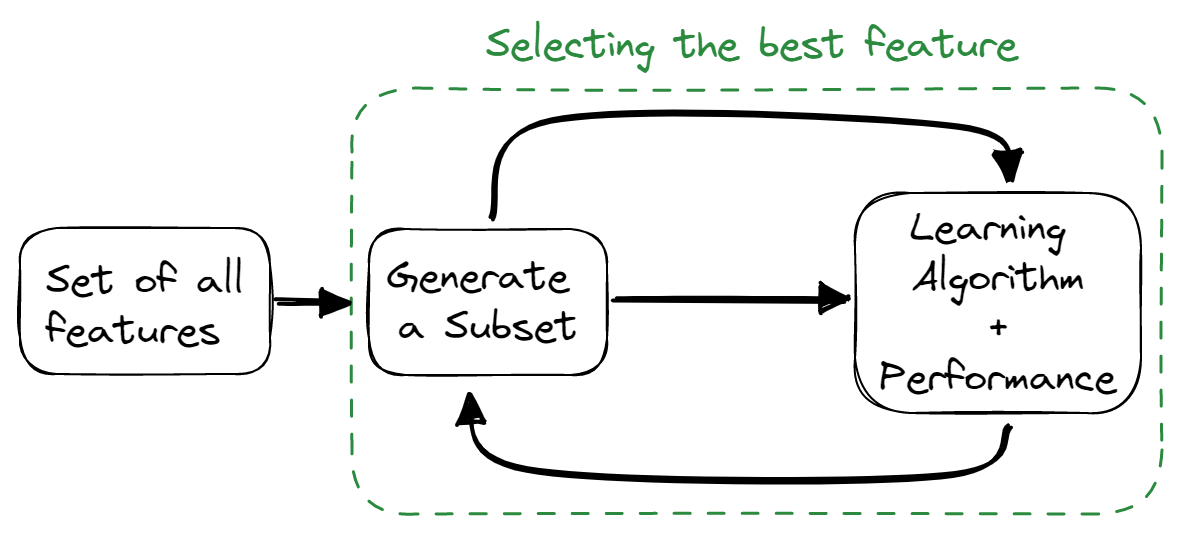
Image by Author
Some techniques used are:
Learn the most commonly tested feature selection techniques in our Python Feature Selection Tutorial.
Overfitting refers to a model that is trained too well on a training dataset but fails on the test and validation dataset.
You can avoid overfitting by:
For a deeper guide on preventing overfitting, read What is Overfitting? and our tutorial on Regularization in Machine Learning.
There are four main types of SQL relationships:
Learn how to explore the tables, the relationships between them, and the data stored in them by completing ourExploratory Data Analysis in SQLcourse.
Dimensionality reduction is a process that converts the dataset from several dimensions into fewer dimensions while maintaining similar information.

Image by Author | Graphs by howecoresearch
Benefits of dimensionality reduction:
Understand the concept of reducing dimensionality and master the techniques by practicing using Dimensionality Reduction in Python course.

Image by Author
A/B testing eliminates the guesswork and helps us make data-driven decisions to optimize the product or website. It is also known as split testing, where randomized experiments are conducted to analyze two or more versions of variables (web page, app feature, etc.) and determine which version drives maximum traffic and business metric.
Learn how to create, run, and analyze A/B tests by taking our Customer Analytics and A/B Testing in Python course.
Stemming is commonly used in text and sentiment analysis. In this question, you will write a Python function that will convert certain words from the list to their root form - Interview Query.
Input:
The function will take two arguments: list of root words and sentence.
roots = ["cat", "bat", "rat"]
sentence = "the cattle was rattled by the battery"Output:
It will return the sentence with root words.
"the cat was rat by the bat"Before you jump into writing code, you need to understand that we will perform two tasks: check if the word has a root and replace it.
roots = ["cat", "bat", "rat"]
sentence = "the cattle was rattled by the battery"


def replace_words(roots, sentence):
    words = sentence.split(" ")

    # looping over each word
    for index, word in enumerate(words):
        # looping over each root
        for root in roots:
            # checking if words start with root
            if word.startswith(root):
                # replacing the word with its root
                words[index] = root
    return " ".join(words)


replace_words(roots, sentence)


# 'the cat was rat by the bat'Given the string text, return True if it’s a palindrome, else False.
After lowering all letters and removing all non-alphanumeric characters, the word should read the same forward and backward.
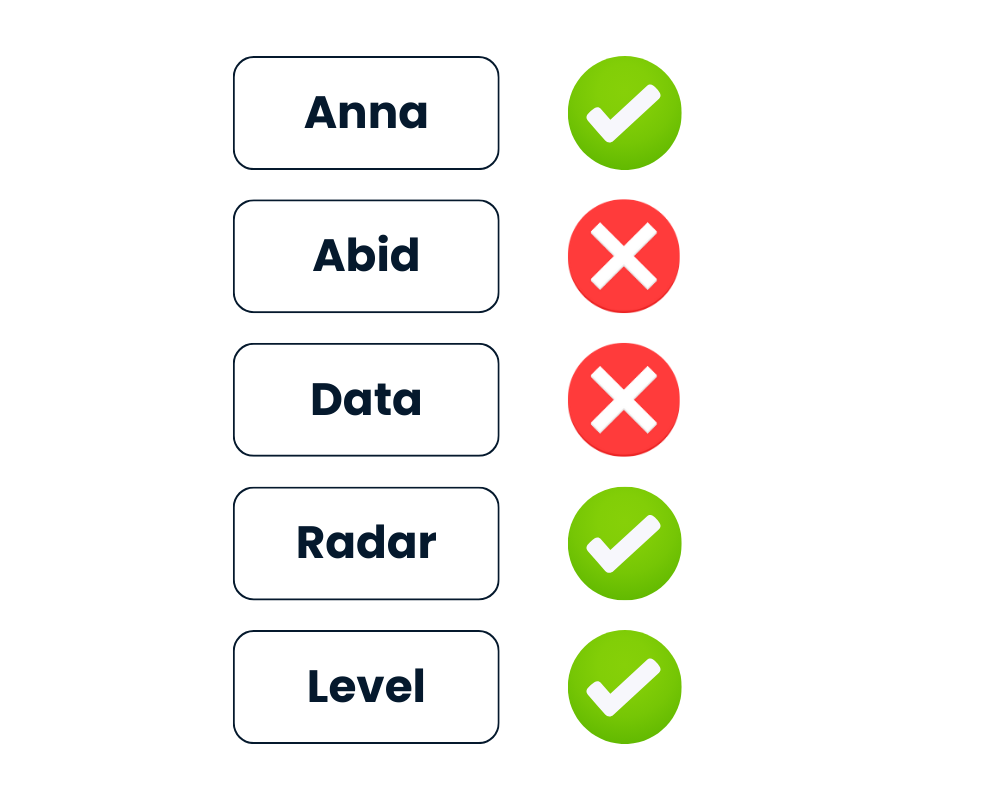
Image by Author
Python provides easy ways to solve this challenge. You can either treat the string as iterable and reverse it using text[::-1] or use the built-in reversed(text) method.
[::-1].import re
def is_palindrome(text):
# lowering the string
text = text.lower()
# Cleaning the string
rx = re.compile('\W+')
text = rx.sub('',text).strip()
# Reversing and comparing the string
return text == text[::-1]In the second method, you will just replace reversing the text with ''.join(reversed(text)) and compare it with cleaned text.
Both methods are straightforward.
def is_palindrome(text):
    # lowering the string
    text = text.lower()

    # Cleaning the string
    rx = re.compile('\W+')
    text = rx.sub('',text).strip()

    # Reversing the string
    rev = ''.join(reversed(text))
return text == revResults:
We will provide the list of the word to the is_palindrome() function and print the results. As you can see, even with special characters, the function has identified “Level” and “Radar” as palindromes.
# Test cases
test_words = ['Anna', '**Radar****', 'Abid', '(Level)', 'Data']

for text in test_words:
    print(f"Is {text} a palindrome? {is_palindrome(text)}")


# Is Anna a palindrome? True
# Is **Radar**** a palindrome? True
# Is Abid a palindrome? False
# Is (Level) a palindrome? True
# Is Data a palindrome? False
Prepare for your next coding interviews by Practicing Coding Interview Questions in Python with our interactive course. For deeper Python coding prep, see our 41 Top Python Interview Questions & Answers For 2026.
It is easy to find the highest and lowest value, but hard to find the second-highest or nth highest value.
In the question, you are provided with the database table that consists of id and base_salary. You will be writing the SQL query to find the second-highest salary.
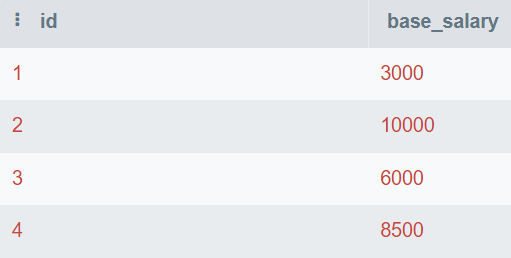
Image by Author
In this query, you will find the unique values and order them from highest to lowest. Then, you will use LIMIT 1 to display only the highest value. In the end, you will offset the value by 1 to display the second-highest number.
You can also change the OFFSET value to get nth highest salary.
SELECT DISTINCT base_salary AS "Second Highest Salary"
FROM employee
ORDER BY base_salary DESC
LIMIT 1
OFFSET 1;
The second highest base salary is 8,500.
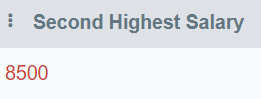
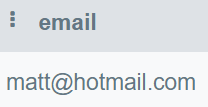
In this question, you will write a query to display all of the duplicate emails.
Image by Author
In this query, you will display an email column and group the table by email. After that, we will use the HAVING clause to find emails that are mentioned more than once.
HAVING is used as a replacement for the WHERE statement in conjunction with aggregations.
SELECT email
FROM employee_email
GROUP BY email
HAVING COUNT(email) > 1;
Only “matt@hotmail.com” occurs more than once.
Write maintainable SQL code to answer business questions by taking theApplying SQL to Real-World Problemscourse.
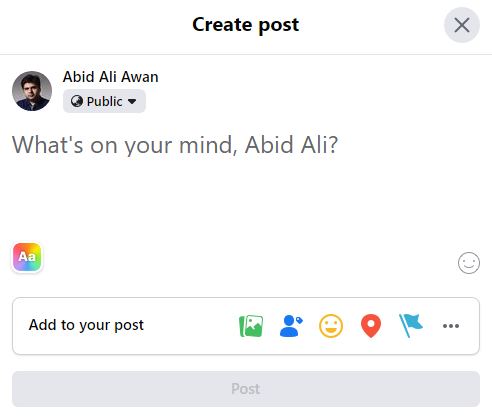
Image by Author
The post from a month ago dropped from 3% to 2.5% today. Before you jump to a conclusion, you need to clarify the context around the problem.
You need to ask questions:
In the second part, you need to elaborate on what drove the decrease. Has the number of users increased, or the number of posts has decreased? After that, the interviewer will ask to initiate a discussion using one or both reasoning.
In terms of the distribution of time spent per day on Facebook, one can assume that there might be two groups:
For the second part, you have to use statistical vocabulary to describe the distribution, such as:
In this question, you will write pandas code to first divide the score into various buckets and then calculate the percentage of the students getting the score in those brackets.
Input:
Our dataset has user_id, grade, and test_score columns.
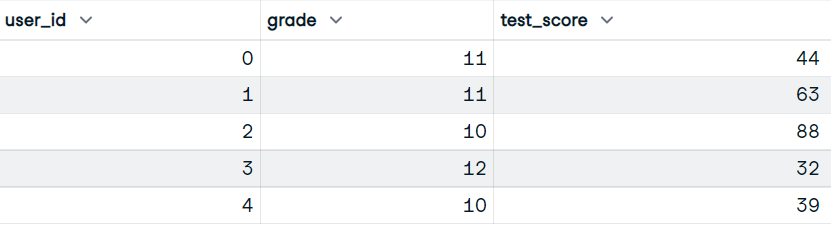
Image by Author
Output:
You will be writing the function that will use grade and test_score columns. And display the dataframe with grades, bucket scores, and cumulative percentage of students getting bucket scores.
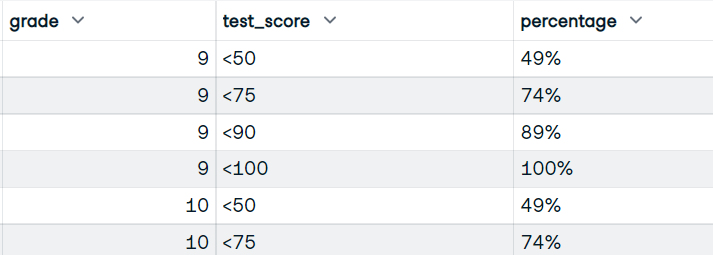
Image by Author
pandas.cut() function to convert scores into bucket scores using bins and labels of buckets. def bucket_test_scores(df):
bins = [0, 50, 75, 90, 100]
labels = ["<50", "<75", "<90", "<100"]
# converting the scores into buckets
df["test_score"] = pd.cut(df["test_score"], bins, labels=labels, right=False)
# Calculate size of each group, by grade and test score
df = df.groupby(["grade", "test_score"]).size()
# Calculate numerator and denominator for percentage
NUM = df.groupby("grade").cumsum()
DEN = df.groupby("grade").sum()
# Calculate percentage, multiply by 100, and add %
percentage = (NUM / DEN).map(lambda x: f"{int(100*x):d}%")
# reset the index
percentage = percentage.reset_index(name="percentage")
return percentage
bucket_test_scores(df)You got the perfect result with a bucket test score and the percentage.
Learn how to clean data, calculate statistics, and create visualizations with Data Manipulation with pandas course. For a deeper dive, see our guide to the Top 35 Machine Learning Interview Questions For 2026.
The confidence interval is a range of estimates for an unknown parameter that you expect to fall between a certain percentage of the time when you run the experiment again or similarly re-sample the population.
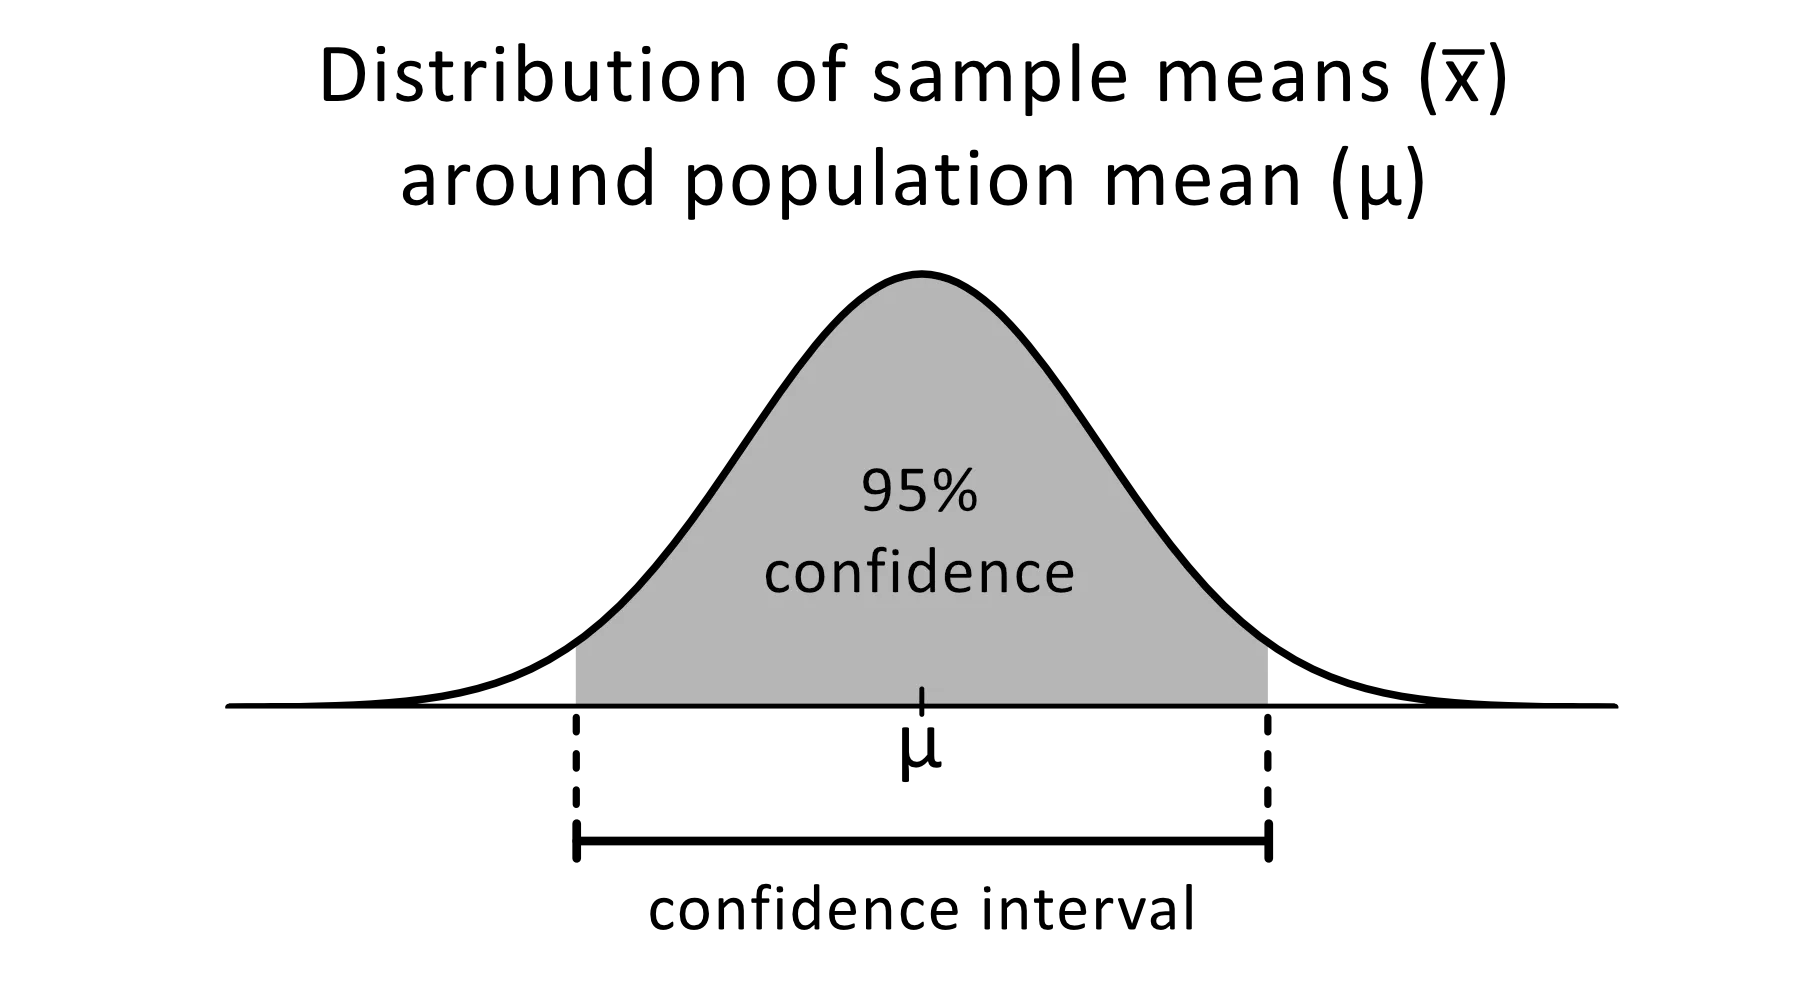
Image from omnicalculator
The 95% confidence level is commonly used in statistical experiments, and it is the percentage of times you expect to reproduce an estimated parameter. The confidence intervals have an upper and lower bound that is set by the alpha value.
You can use confidence intervals for various statistical estimates, such as proportions, population means, differences between population means or proportions, and estimates of variation among groups.
Build the statistics foundation by completing our Statistical Thinking in Python (Part 1) course.
In the unbalanced dataset, the classes are distributed unequally. For example, in the fraud detection dataset, there are only 400 fraud cases compared to 300,000 non-fraud cases. The unbalanced data will make the model perform worse in detecting fraud.
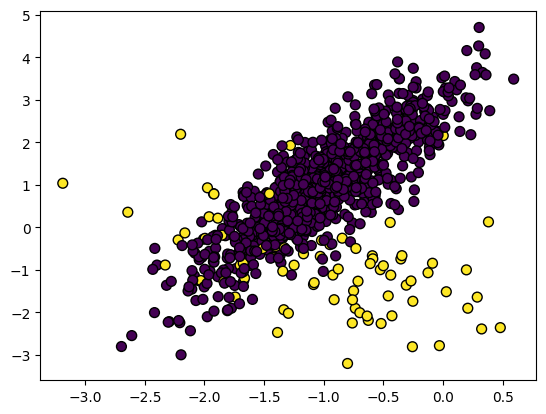
Image by Author
To handle imbalanced data, you can use:
Undersampling
It resamples majority class features to make them equal to the minority class features.
In the fraud detection dataset, both classes will be equal to 400 samples. You can use imblearn.under_sampling to resample your dataset with ease.
from imblearn.under_sampling import RandomUnderSampler
RUS = RandomUnderSampler(random_state=1)
X_US, y_US = RUS.fit_resample(X_train, y_train)
Oversampling
It resamples minority class features to make them equal to the majority class features. Repetition or weightage repetition of the minority class features are some of the common methods used in balancing the data. In short, both classes will have 300K samples.
from imblearn.over_sampling import RandomOverSampler

ROS = RandomOverSampler(random_state=0)
X_OS, y_OS = ROS.fit_resample(X_train, y_train)
Creating synthetic data
The problem with repetition is that it does not provide extra information, which will result in the models' poor performance. To counter it, we can use SMOTE (Synthetic Minority Oversampling technique) to create synthetic data points.
from imblearn.over_sampling import SMOTE

SM = SMOTE(random_state=1)
X_OS, y_OS = SM.fit_resample(X_train, y_train)
Combination of under and over sampling
To improve model biases and performance, you can use a combination of over and under-sampling. We will use SMOTE for over-sampling and EEN (Edited Nearest Neighbours) for cleaning.
The imblearn.combine provides us with various functions that automatically perform both sampling functions.
from imblearn.combine import SMOTEENN

SMTN = SMOTEENN(random_state=0)
X_OUS, y_OUS = SMTN.fit_resample(X_train, y_train)As a data scientist, you will be writing a similar type of query to extract the data and perform data analysis. In this challenge, you will either use the WHERE clause with comparison signs or WHERE with BETWEEN clause to perform filtering.
Table: orders
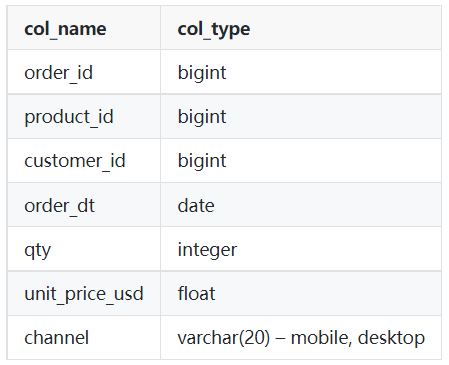
Image by Author
Sample output:
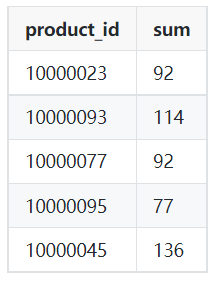
Image by Author
SELECT product_id,
      SUM(qty)
FROM orders
WHERE order_dt >= '2022-03-01'
  AND order_dt < '2022-04-01'
GROUP BY product_id;In unsupervised learning, finding the performance of the clustering project can be tricky. The criteria of good clustering are distinct groups with little similarity.
There is no accuracy metric in clustering models, so we will be using either similarity or distinctness between the groups to evaluate the model performance.
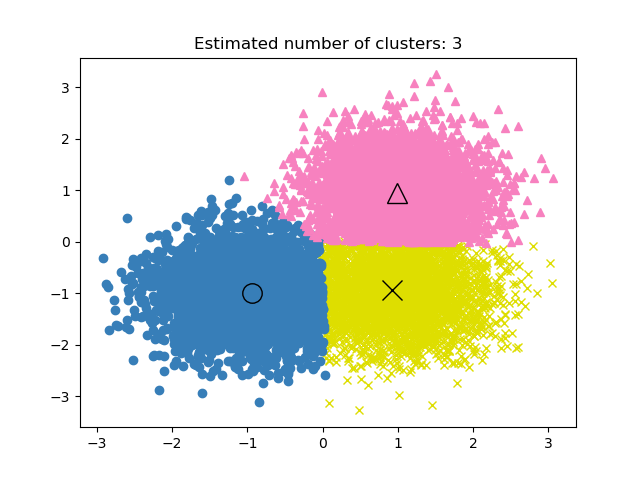
Image from scikit-learn documentation
The three commonly used metrics are:
Silhouette Score
It is calculated using the mean intra-cluster distance and the mean nearest-cluster distance.
We can use scikit-learn to calculate the metric. The Silhouette Score is between -1 to 1, where higher scores mean lower similarity between groups and distinct clusters.
from sklearn import metrics


model = KMeans().fit(X)
labels = model.labels_

metrics.silhouette_score(X, labels)
Calinski-Harabaz Index
It calculates distinctiveness between groups using between-cluster dispersion and within-cluster dispersion. The metric has no bound, and just like Silhouette Score, a higher score means better model performance.
metrics.calinski_harabasz_score(X, labels)Davies-Bouldin Index
It calculates the average similarity of each cluster with its most similar cluster. Unlike other metrics, a lower score means better model performance and better separation between clusters.
metrics.davies_bouldin_score(X, labels)
Learn how to apply hierarchical and k-means clustering by taking our Cluster Analysis in R course.

Image by Author
We will use:
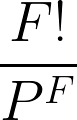
To solve this problem, we need to first find the total number of ways to get off the floors: 44 = 4x4x4x4 = 256 ways.
After that, calculate the number of ways each person can get off on a different floor: 4! = 24.
To calculate the probability that each person gets off on a different floor, we need to divide the number of ways each person gets off on a different floor with the total number of ways to get off the floors.
24/256 = 3/32
Learn strategies for answering tricky probability questions with R by taking our Probability Puzzles in R course.
To generate N samples from the normal distribution, you can either use Numpy (np.random.randn(N)) or SciPy (sp.stats.norm.rvs(size=N)).
To plot a histogram, you can either use Matplotlib or Seaborn.
import numpy as np
import seaborn as sns

N = 10_000

def norm_dist_hist(N):
    # Generating Random normal distribution samples
    x = np.random.randn(N)
    # Plotting histogram
    sns.histplot(x, bins = 20, kde=True);
    return x

X = norm_dist_hist(N)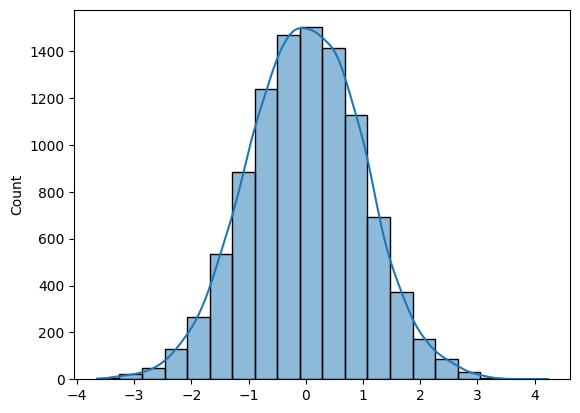
Learn how to create informative and attractive visualizations in seconds by completing Introduction to Data Visualization with Seaborn course.
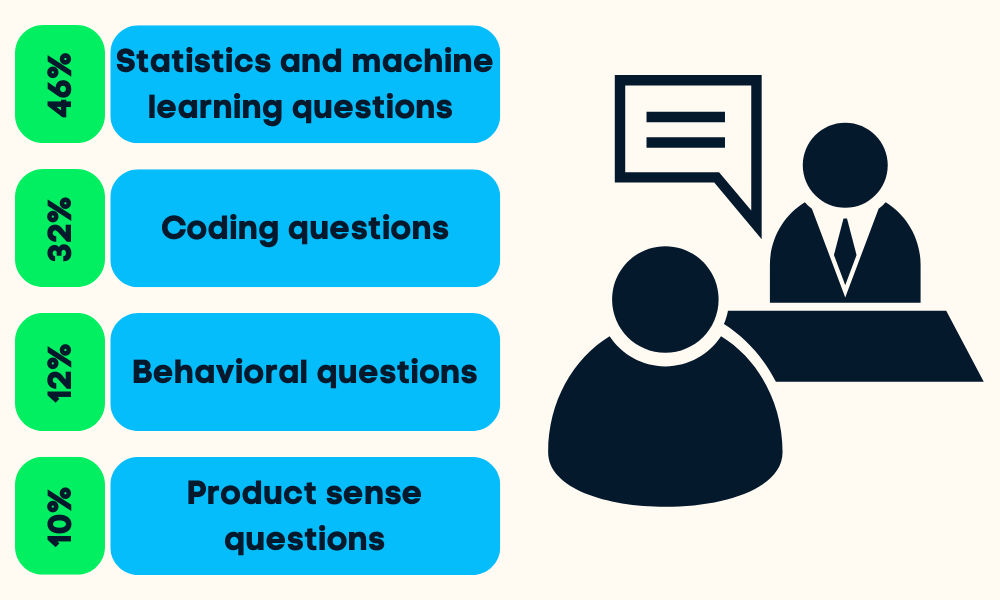
Image by Author
The data science interviews are divided into four to five stages. You will be asked about statistical and machine learning, coding (Python, R, SQL), behavioral, product sense, and sometimes leadership questions.
You can prepare for all stages by:
Read theData Science Interview Preparationblog to learn what to expect and how to approach the interview.
Data Science Courses
Course
Course
Course
blog
Abid Ali Awan
15 min
blog
Vikash Singh
15 min
blog
Islam Salahuddin
15 min
blog
Maria Eugenia Inzaugarat
15 min
blog
Artur Sannikov
12 min
blog
Gus Frazer
12 min