
Track
Tableau Fundamentals
23 hr
Data visualization tools allow businesses to effectively analyze and interpret large amounts of data in an intuitive way. They provide a visual representation of complex data, making it easier for users to identify patterns, trends, and outliers.
This ultimately helps businesses make data-driven decisions and gain valuable insights into their operations.
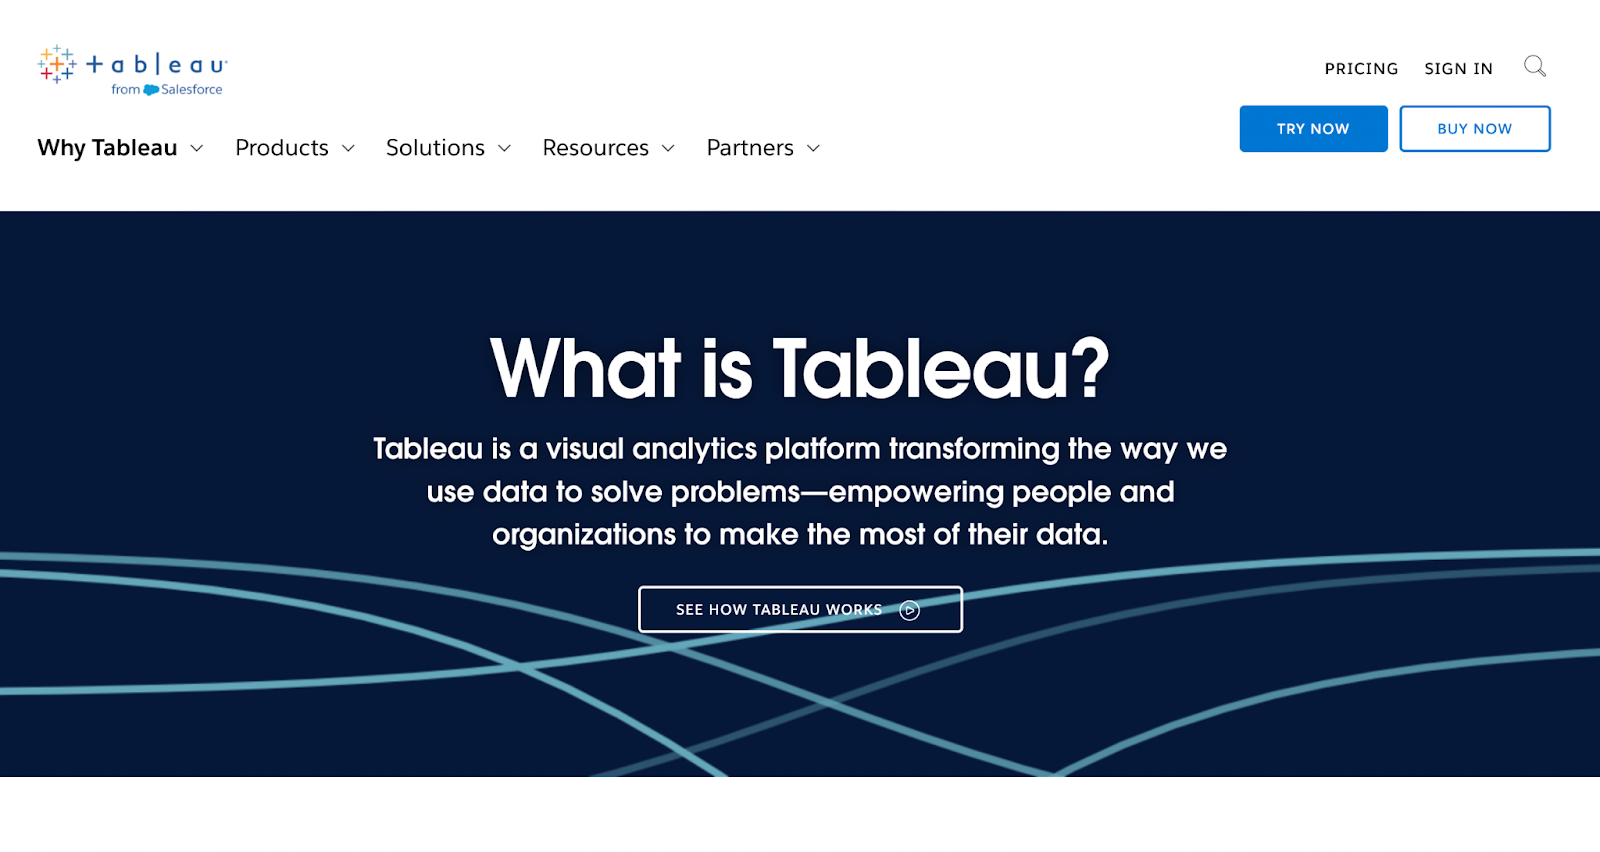
Tableau is also a popular data visualization and analytics tool that was recently acquired by Salesforce. It offers a wide range of features for data analysis, including interactive dashboards, visualizations, and reporting.
Tableau offers several products:
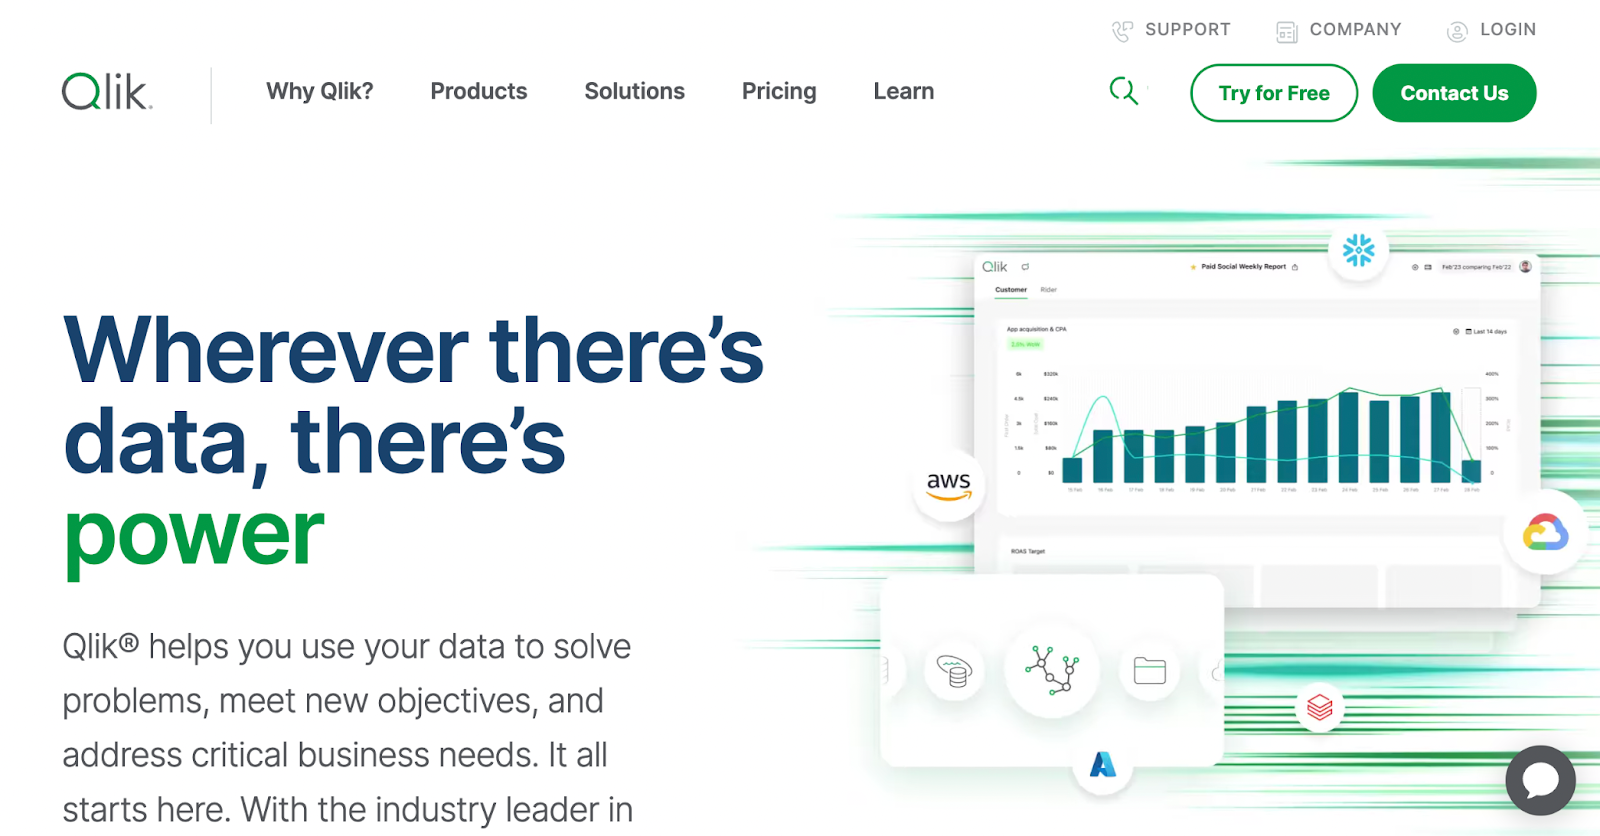
QlikView is a data discovery and visualization tool developed by Qlik. It allows users to easily analyze and visualize their data through interactive dashboards and reports. QlikView uses an in-memory data processing technology, meaning it can quickly load and manipulate large datasets for real-time analysis.
It is also a first-generation analytics product, which was succeeded by Qlik Sense. However, QlikView is still widely used and offers a strong set of features for data analysis.
Let’s start with some similarities between the two tools.
Here are some of them:
With both tools being the pioneers of data visualization tools, both are well developed and have many similarities in features.
Next, here are the differences between the two tools:
As you can see, these differences make both QlikView and Tableau suitable for different use cases. QlikView is better suited for complex and large datasets, while Tableau excels in creating customized and mobile-friendly visualizations.
However, both tools offer powerful data analytics capabilities and can help organizations make informed decisions based on their data.
To give you a clearer picture of the two tools, let’s look at these points in further detail.
QlikView's data integration is based on their proprietary in-memory engine, which allows for faster data processing and analysis. This means that all data is loaded into the computer's memory, eliminating the need for time-consuming database queries.
This may demand a steeper learning curve for scripting for ETL (Extract, Transform, Load) processes.
On the other hand, Tableau's automatic data model inference simplifies integration, making it a compelling choice for users who want to dive straight into analysis without getting bogged down by extensive data modeling.
Tableau also offers a variety of data integration options, including direct connections to databases and cloud-based solutions such as Amazon Redshift and Google BigQuery. This gives users the flexibility to connect to various data sources and work with real-time data.
In terms of data integration, the overall better tool would be Tableau. However, your choice may be dependent on your specific needs as a user.
If you require a more hands-on approach and have complex data modeling needs, QlikView would be the better choice. However, if you want a user-friendly interface with simplified data integration, Tableau would be the preferred option.
When it comes to picking out a good BI tool, the experience of creating data visualizations and dashboards plays an important part. Let's have a look at how the two compare below.
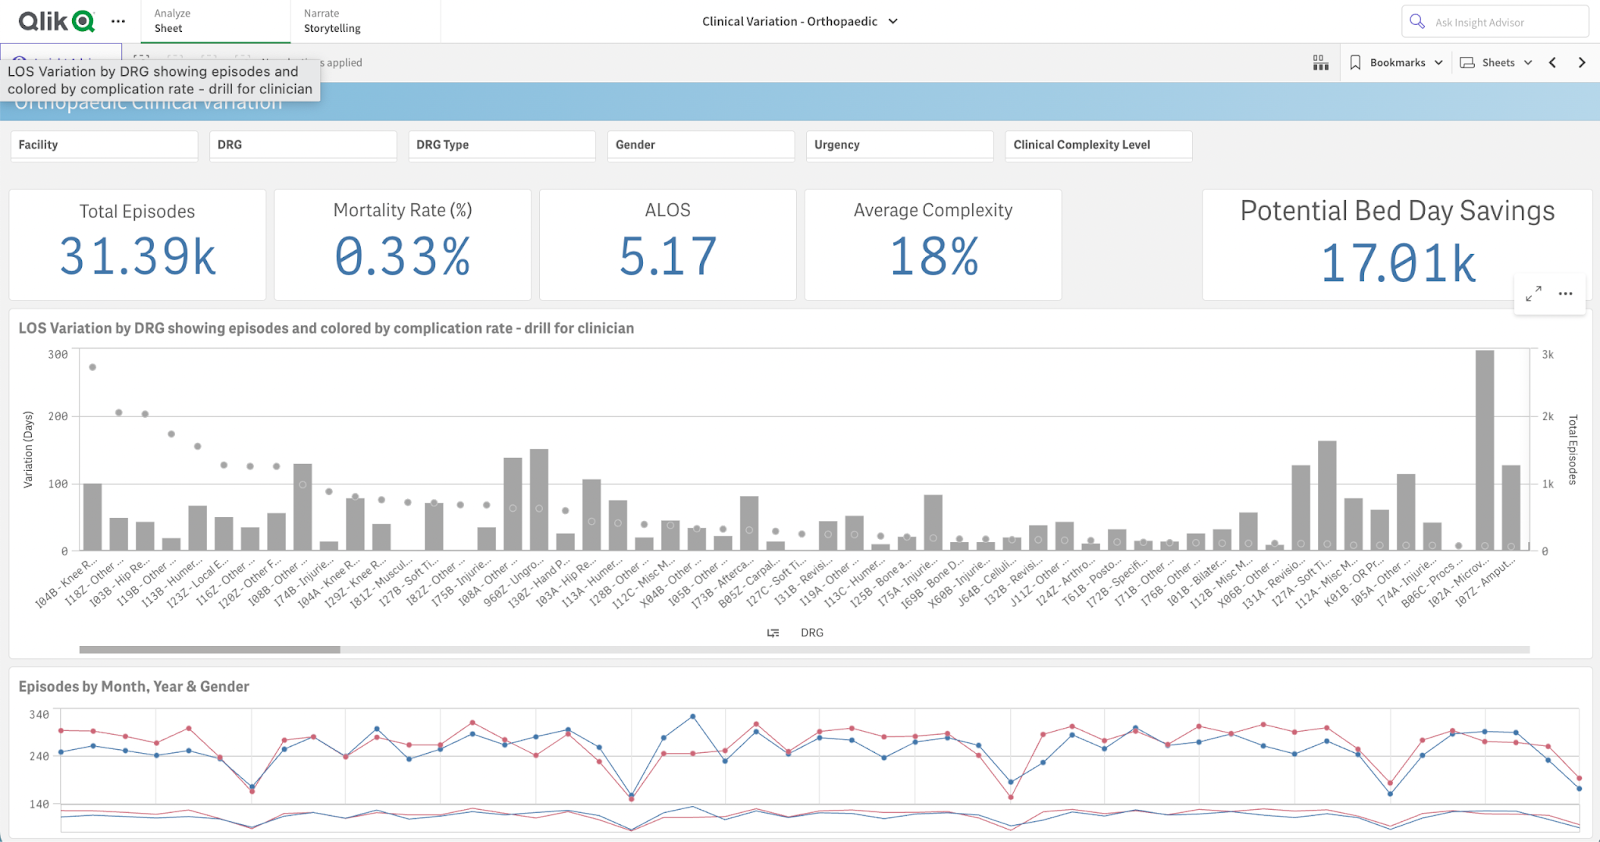
QlikView's dashboard design is more of an intuitive drag-and-drop approach where elements are dropped onto the canvas. I personally found this much easier to get started with than Tableau since their container system can be confusing.
Here’s an example of the dashboards found in QlikView:
Source: Qlik
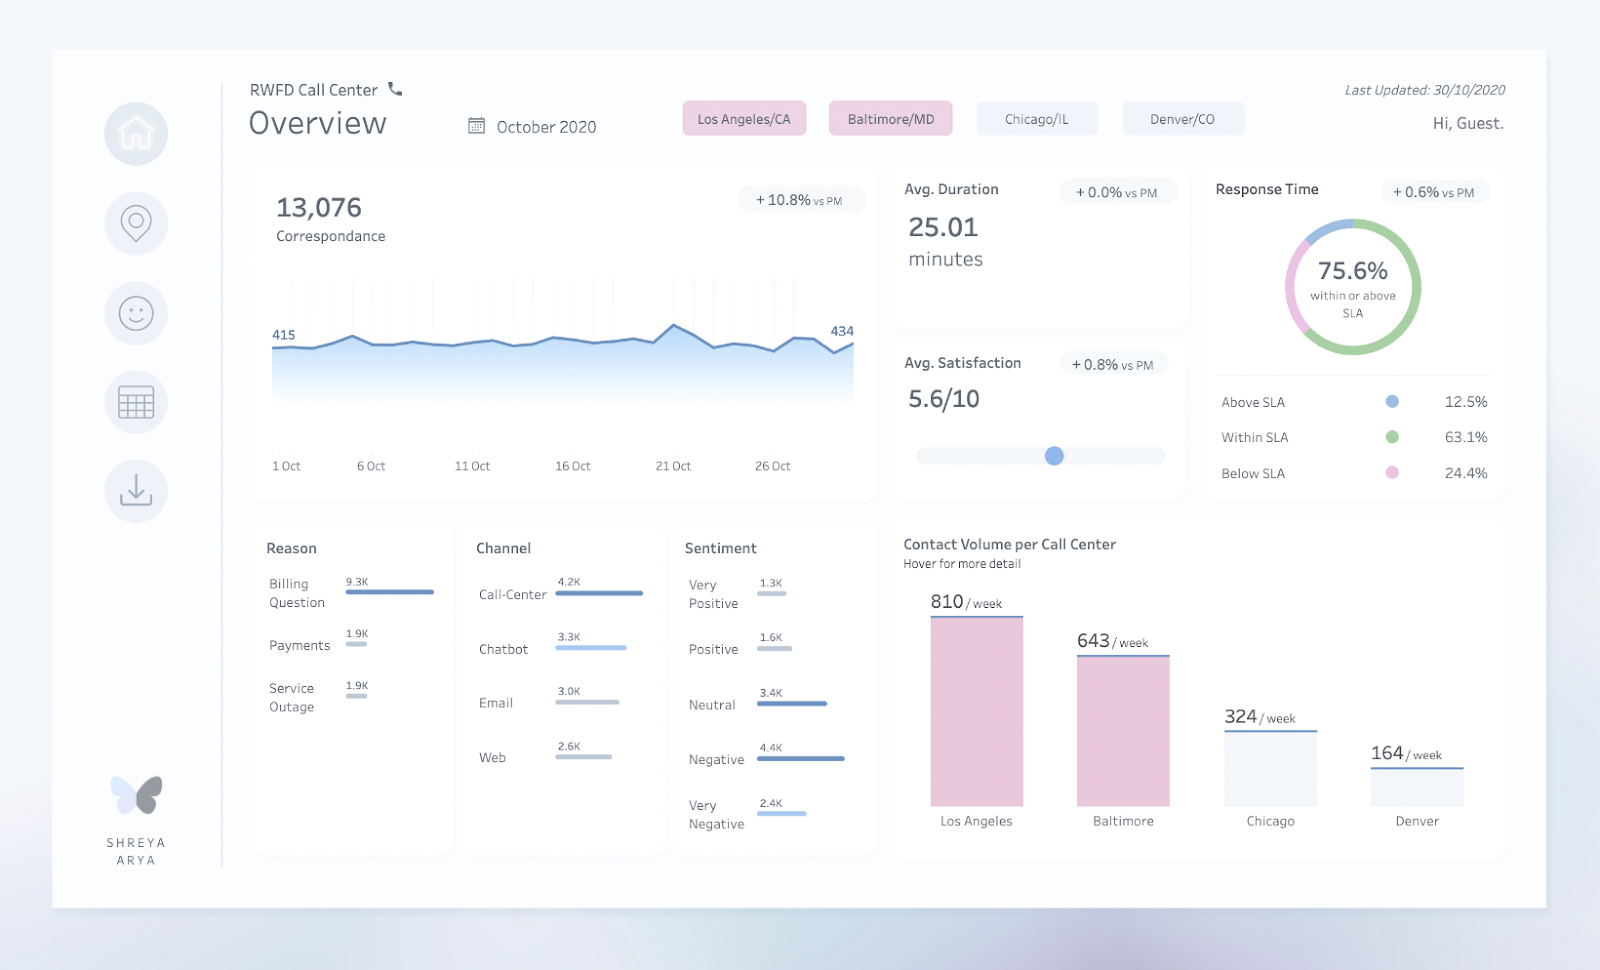
Tableau's intuitive drag-and-drop interface facilitates rapid and sophisticated visual analytics, while its flexibility in design enables the creation of tailored, insightful visualizations that resonate with the audience.
Source: Call Center Dashboard by Shreya Arya
Tableau dashboards are created using layout containers, which can feel clunky and rigid at times. However, there are flexible containers for more advanced users so the layout can be easily customized to fit specific needs.
Learn more about using dashboards in our Creating Dashboards in Tableau course.
When comparing the data visualization capabilities of both tools, it is clear that Tableau takes the lead. Its drag-and-drop approach allows for a more user-friendly and intuitive experience while still offering advanced customization options for more experienced users.
QlikView has a steeper learning curve due to its complex scripting language and data modeling process.
However, it offers a more flexible user interface that allows for more customization and control over the data visualization process. Users can also take advantage of QlikView’s drag and drop features to create interactive dashboards and reports.
Here’s a QlikView script example:
// Load data from an Excel file
LOAD
    CustomerID,
    CustomerName,
    Address,
    City,
    State,
    ZipCode,
    Country,
    OrderID,
    OrderDate,
    Amount
FROM
    [C:\Data\SalesData.xlsx]
(ooxml, embedded labels, table is Sheet1);
// Perform some transformations
// Convert OrderDate to a date format
Orders:
LOAD
    CustomerID,
    OrderID,
    Date(OrderDate, 'YYYY-MM-DD') as OrderDate,
    Amount
RESIDENT [Sheet1];
// Create a new field for Year and Month
OrdersWithDate:
LOAD
    *,
    Year(OrderDate) as OrderYear,
    Month(OrderDate) as OrderMonth
RESIDENT Orders;
// Drop the Orders table as it is no longer needed
DROP TABLE Orders;
// Join OrdersWithDate back with the customer data
LEFT JOIN (Sheet1)
LOAD
    CustomerID,
    OrderID,
    OrderDate,
    OrderYear,
    OrderMonth,
    Amount
RESIDENT OrdersWithDate;
// Drop the OrdersWithDate table as it is no longer needed
DROP TABLE OrdersWithDate;
// Create a simple pivot table
PivotTable:
LOAD
    Country,
    OrderYear,
    Sum(Amount) as TotalSales
RESIDENT [Sheet1]
GROUP BY Country, OrderYear;
// Save the transformed data to a QVD file
STORE PivotTable INTO [C:\Data\TransformedSalesData.qvd] (qvd);
Explanation:
Tableau has a simpler learning curve compared to QlikView, with a more intuitive drag and drop interface. This makes it easier for users to quickly create visualizations without needing extensive knowledge of coding or data modeling. Tableau also offers various templates and pre-built visualizations that further simplify the process for beginners.
The clear winner for the learning curve has to be Tableau, as it requires less technical knowledge and offers a more user-friendly interface. However, QlikView may be better suited for those with more advanced technical skills who want more control over the data visualization process.
Customization and extension are crucial facets where QlikView and Tableau diverge, presenting distinct offerings for tailored analytics experiences.
QlikView's scripting allows for intricate customization at the data model level. QlikView's extension objects also enable highly customized analytics applications, catering to unique business requirements.
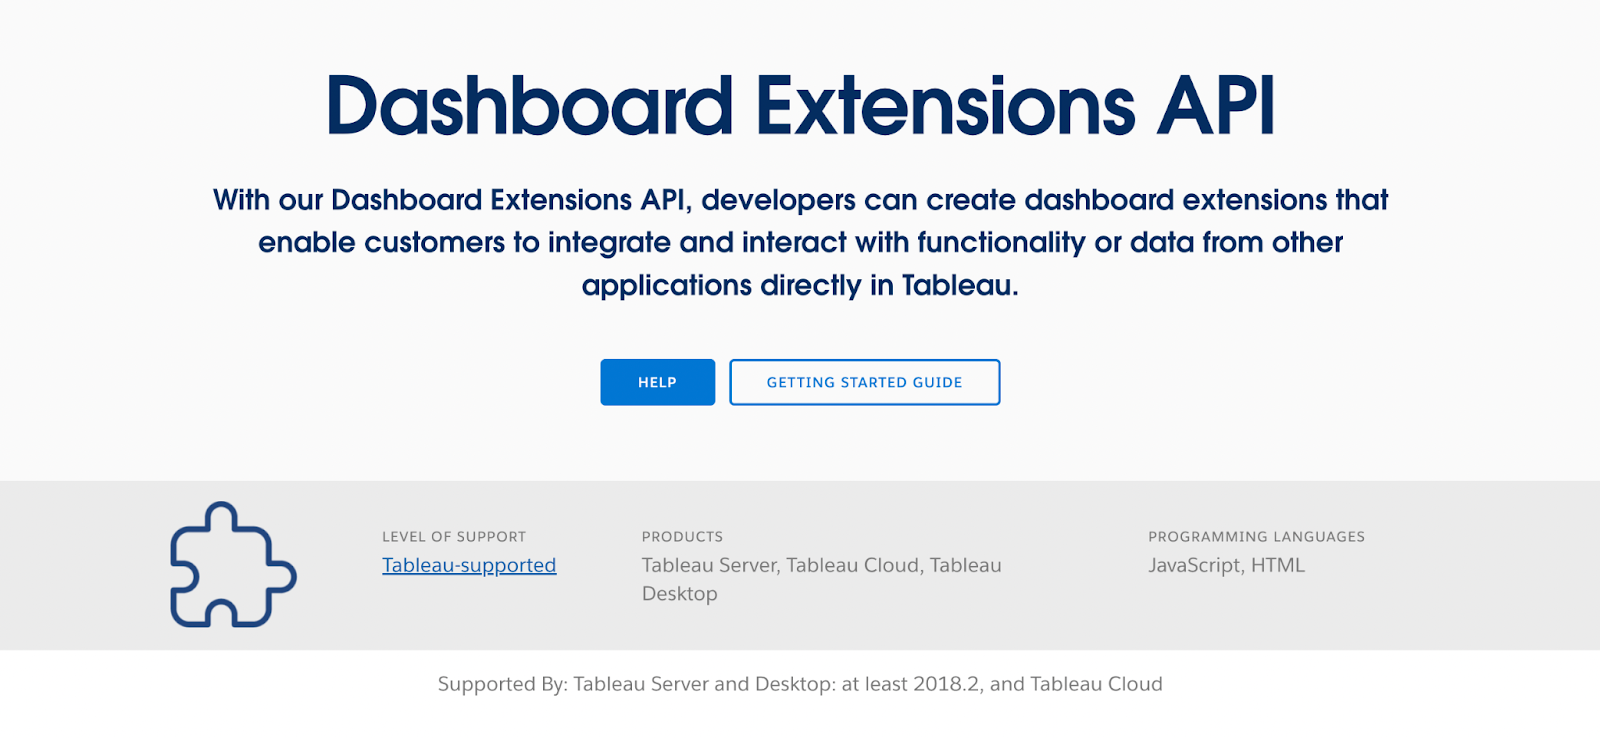
Tableau's Dashboard Extensions API unlocks the possibility of integrating and interacting with external applications directly within Tableau dashboards, expanding its functionality.
Source: Dashboard Extensions API
This expands upon Tableau's already flexible dashboarding capabilities.
Tableau is the clear winner in terms of extensibility, with its robust Dashboards Extensions API and wide range of community-driven resources. Its focus on integrating external applications directly within dashboards allows for a seamless user experience and provides endless possibilities for customization.
QlikView also offers some extensibility options through its Extension Objects, but they are not as advanced or widely adopted as Tableau's offerings.
QlikView offers a variety of resources to help users stay abreast with the platform's latest developments. Qlik Community, its online forum, is hub for Qlik data enthusiasts who share their experiences and insights.
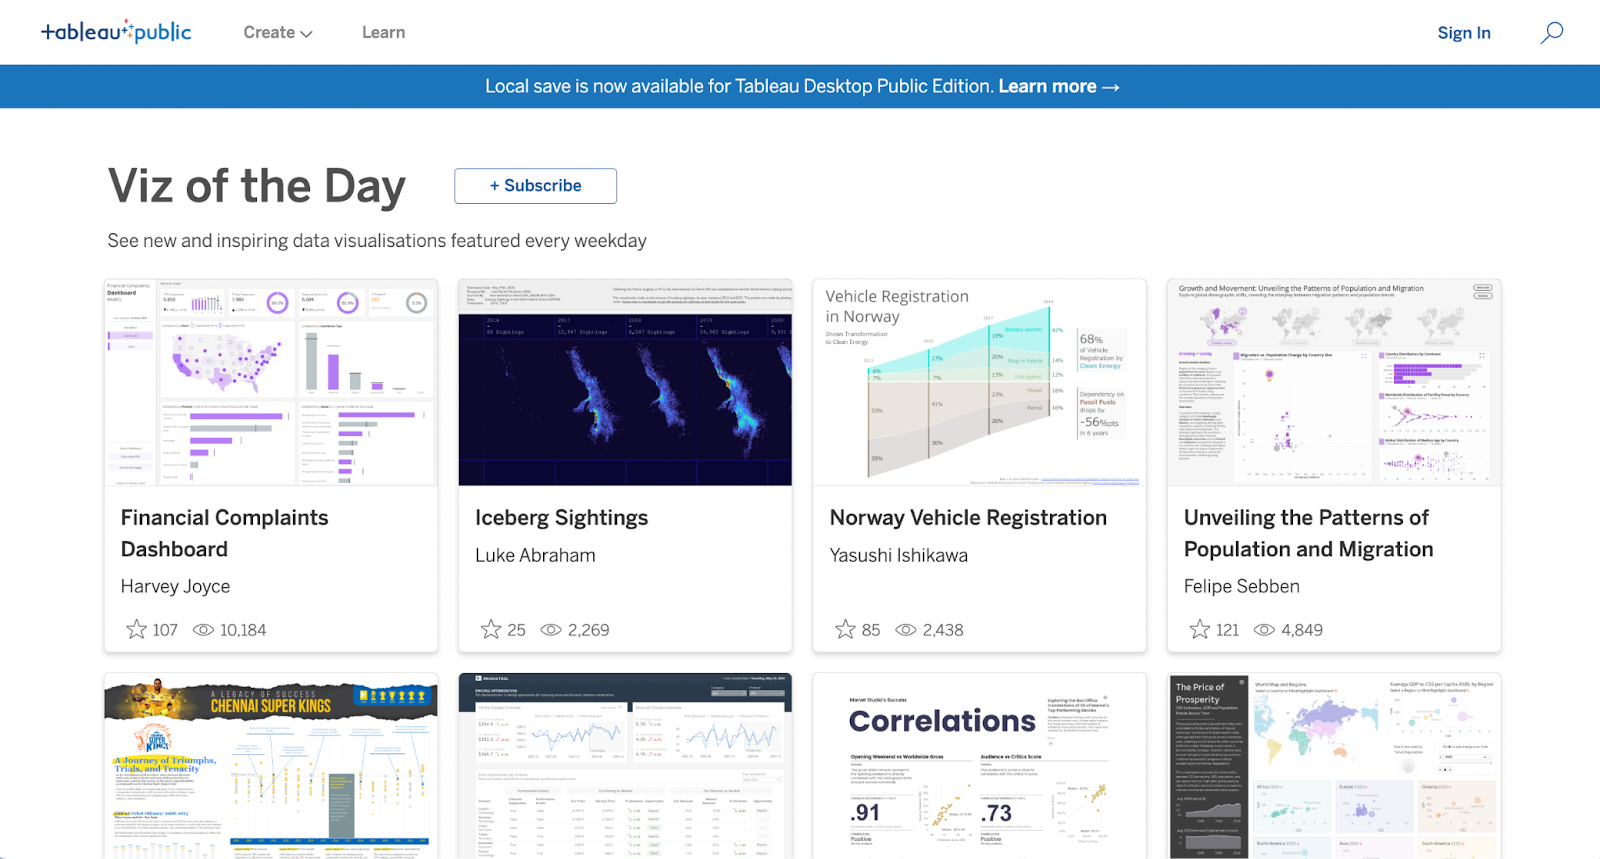
Tableau’s community is especially renowned for its Tableau Viz Gallery and Viz of the Day, which encourages a vibrant and collaborative nature.
Source: Tableau Viz of the Day
Tableau's online community, also known as the Tableau Community Forums, is an extensive resource with active participation from users across all skill levels. Here, professionals can find solutions, share best practices, and inspire one another with creative visualizations.
Among these two, the community support for Tableau seems to stand out as the winner. With a larger and more active user base, Tableau's community provides a wealth of resources and opportunities for collaboration.
However, that does not mean QlikView falls short in terms of support and resources. The Qlik Community is an invaluable source of knowledge and expertise, with dedicated forums for different topics such as scripting, data modeling, and visualizations.
Here’s a summary of both tools:
|
Category |
QlikView |
Tableau |
Winner |
|
1. Data Integration Capabilities |
|
|
|
|
2. Visualization and Dashboard Design |
|
|
|
|
3. Learning Curve and User Interface |
|
|
|
|
4. Customization and Extension |
|
|
|
|
5. Community Support and Resources |
|
|
|
Wrapping up, both Tableau and QlikView are viable tools in the data visualization and BI field. Both have their unique strengths and weaknesses, and choosing between them ultimately comes down to the specific needs and preferences of an organization.
Overall, Tableau shines in its user-friendly interface and robust community support, while QlikView offers powerful data manipulation capabilities and a more traditional approach to BI.
Keen to explore more among the other data visualization tools? You might like our other free resources, such as a learning Tableau guide, a Power BI vs Tableau comparison, or a Looker vs Tableau comparison.
If you’re interested in learning about Tableau, check out our Tableau Fundamentals Skills Track or the Data Analyst in Tableau Track.
Get your team access to the full DataCamp library, with centralized reporting, assignments, projects and more

Top Tableau Courses
Track
Track
Course
blog
Wendy Gittleson
15 min
blog
Nisha Arya Ahmed
9 min
blog
Laiba Siddiqui
11 min
blog
Kenneth Leung
6 min
Tutorial
Austin Chia
Tutorial
Abid Ali Awan