

इस ट्यूटोरियल का कोड ऑनलाइन चलाएं और संपादित करें
कोड चलाएंसभी मास्क इमेज एक जैसे फ़ॉर्मेट में नहीं होतीं, जिससे अलग-अलग परिणाम आ सकते हैं और WordCloud फ़ंक्शन सही तरह काम नहीं कर पाता। यह सुनिश्चित करने के लिए कि आपका मास्क काम करे, आइए उसे numpy ऐरे रूप में देखें:
wine_mask = np.array(Image.open("img/wine_mask.png"))
wine_mask
array([[0, 0, 0, ..., 0, 0, 0],
[0, 0, 0, ..., 0, 0, 0],
[0, 0, 0, ..., 0, 0, 0],
...,
[0, 0, 0, ..., 0, 0, 0],
[0, 0, 0, ..., 0, 0, 0],
[0, 0, 0, ..., 0, 0, 0]], dtype=uint8)
मास्किंग फ़ंक्शन का काम करने का तरीका यह है कि मास्क के सभी सफ़ेद हिस्से 0 नहीं बल्कि 255 (इन्टीजर) होने चाहिए। यह मान पिक्सेल की "intensity" दर्शाता है। 255 शुद्ध सफ़ेद और 1 काला होता है। यहाँ आप नीचे दिए गए फ़ंक्शन का उपयोग करके अपने मास्क को ट्रांसफ़ॉर्म कर सकते हैं यदि आपका मास्क ऊपर जैसा ही फ़ॉर्मेट रखता है। ध्यान दें, यदि आपके मास्क में बैकग्राउंड 0 नहीं बल्कि 1 या 2 है, तो फ़ंक्शन को उसी अनुसार समायोजित करें।
पहले, आप transform_format() फ़ंक्शन से 0 को 255 में स्वैप करें।
def transform_format(val):
if val == 0:
return 255
else:
return val
फिर, अपने पास मौजूद मास्क के समान आकार का नया मास्क बनाएँ और पिछले मास्क की प्रत्येक पंक्ति के हर मान पर transform_format() लागू करें।
# Transform your mask into a new one that will work with the function:
transformed_wine_mask = np.ndarray((wine_mask.shape[0],wine_mask.shape[1]), np.int32)
for i in range(len(wine_mask)):
transformed_wine_mask[i] = list(map(transform_format, wine_mask[i]))
अब आपके पास सही फ़ॉर्म में नया मास्क है। फ़ंक्शन सही काम कर रहा है या नहीं, यह जाँचने का सबसे अच्छा तरीका ट्रांसफ़ॉर्म किए गए मास्क को प्रिंट करना है।
# Check the expected result of your mask
transformed_wine_mask
array([[255, 255, 255, ..., 255, 255, 255],
[255, 255, 255, ..., 255, 255, 255],
[255, 255, 255, ..., 255, 255, 255],
...,
[255, 255, 255, ..., 255, 255, 255],
[255, 255, 255, ..., 255, 255, 255],
[255, 255, 255, ..., 255, 255, 255]])
सही मास्क के साथ, आप अपनी चुनी हुई आकृति में वर्ड क्लाउड बनाना शुरू कर सकते हैं। ध्यान दें कि WordCloud फ़ंक्शन में mask आर्ग्युमेंट होता है जो ऊपर बनाए गए ट्रांसफ़ॉर्म्ड मास्क को लेता है। contour_width और contour_color—जैसा कि उनके नाम से स्पष्ट है—क्लाउड की आउटलाइन की विशेषताएँ समायोजित करने के आर्ग्युमेंट्स हैं। जो वाइन बोतल यहाँ है वह रेड वाइन बोतल है, तो firebrick कॉन्टूर रंग के लिए अच्छा चुनाव लगता है। और रंग विकल्पों के लिए यह कलर कोड टेबल देखें।
# Create a word cloud image
wc = WordCloud(background_color="white", max_words=1000, mask=transformed_wine_mask,
stopwords=stopwords, contour_width=3, contour_color='firebrick')
# Generate a wordcloud
wc.generate(text)
# store to file
wc.to_file("img/wine.png")
# show
plt.figure(figsize=[20,10])
plt.imshow(wc, interpolation='bilinear')
plt.axis("off")
plt.show()
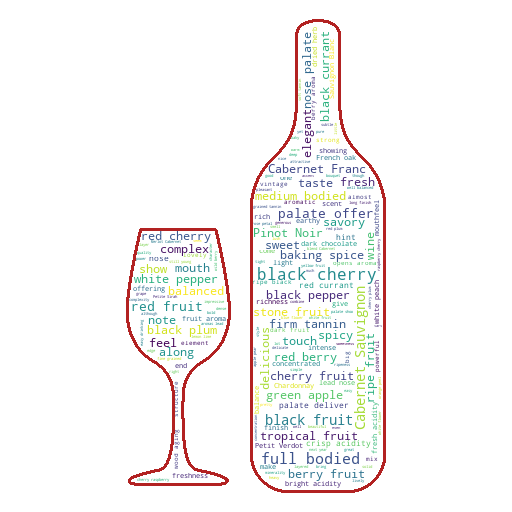
वाह! आपने वाइन बोतल के आकार में वर्ड क्लाउड बना लिया! लगता है वाइन विवरणों में अक्सर ब्लैक चेरी, फ्रूट फ्लेवर्स और फुल-बॉडीड विशेषताओं का उल्लेख होता है। अब प्रत्येक देश की समीक्षाओं पर क़रीब से नज़र डालते हैं और हर देश के झंडे का उपयोग करके वर्ड क्लाउड प्लॉट करते हैं। नीचे एक उदाहरण है जिसे आप अभी बनाएँगे:
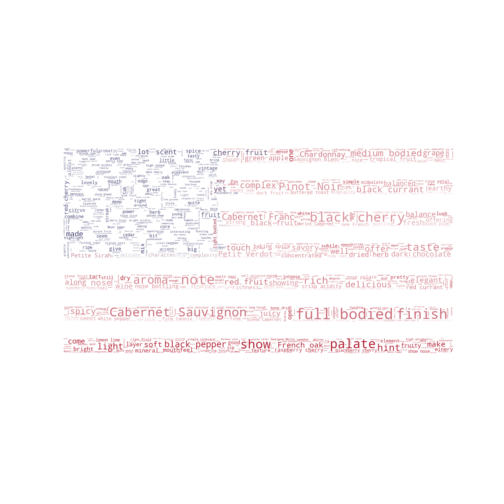
कलर पैटर्न का अनुसरण करते हुए वर्ड क्लाउड बनाना
आप उन पाँच देशों की सभी समीक्षाएँ जोड़ सकते हैं जिनकी वाइन सबसे अधिक हैं। उन देशों को खोजने के लिए, आप ऊपर दिए गए देश बनाम वाइनों की संख्या वाले प्लॉट को देख सकते हैं या ऊपर बनाए गए समूह से प्रत्येक देश (प्रत्येक समूह) के लिए ऑब्ज़र्वेशन्स की संख्या निकालकर sort_values() में ascending=False देकर अवरोही क्रम में सॉर्ट कर सकते हैं।
country.size().sort_values(ascending=False).head()
country
US 54504
France 22093
Italy 19540
Spain 6645
Portugal 5691
dtype: int64
तो अब आपके पास 5 शीर्ष देश हैं: US, फ्रांस, इटली, स्पेन और पुर्तगाल। आप नीचे दिए अनुसार head() के अंदर अपनी चुनी संख्या रखकर देशों की संख्या बदल सकते हैं
country.size().sort_values(ascending=False).head(10)
country
US 54504
France 22093
Italy 19540
Spain 6645
Portugal 5691
Chile 4472
Argentina 3800
Austria 3345
Australia 2329
Germany 2165
dtype: int64
फ़िलहाल, पाँच देश पर्याप्त हैं।
प्रत्येक देश की सभी समीक्षाएँ पाने के लिए, आप " ".join(list) सिन्टैक्स से सभी समीक्षाएँ जोड़ सकते हैं, जो सूची के सभी तत्वों को स्पेस से अलग करके जोड़ देता है।
# Join all reviews of each country:
usa = " ".join(review for review in df[df["country"]=="US"].description)
fra = " ".join(review for review in df[df["country"]=="France"].description)
ita = " ".join(review for review in df[df["country"]=="Italy"].description)
spa = " ".join(review for review in df[df["country"]=="Spain"].description)
por = " ".join(review for review in df[df["country"]=="Portugal"].description)
इसके बाद, आप ऊपर बताई विधि के अनुसार वर्ड क्लाउड बना सकते हैं। आप बनाने और जनरेट करने के दोनों चरणों को नीचे की तरह एक साथ भी कर सकते हैं। कलर मैपिंग प्लॉट करने से ठीक पहले ImageColorGenerator फ़ंक्शन से की जाती है।
# Generate a word cloud image
mask = np.array(Image.open("img/us.png"))
wordcloud_usa = WordCloud(stopwords=stopwords, background_color="white", mode="RGBA", max_words=1000, mask=mask).generate(usa)
# create coloring from image
image_colors = ImageColorGenerator(mask)
plt.figure(figsize=[7,7])
plt.imshow(wordcloud_usa.recolor(color_func=image_colors), interpolation="bilinear")
plt.axis("off")
# store to file
plt.savefig("img/us_wine.png", format="png")
plt.show()
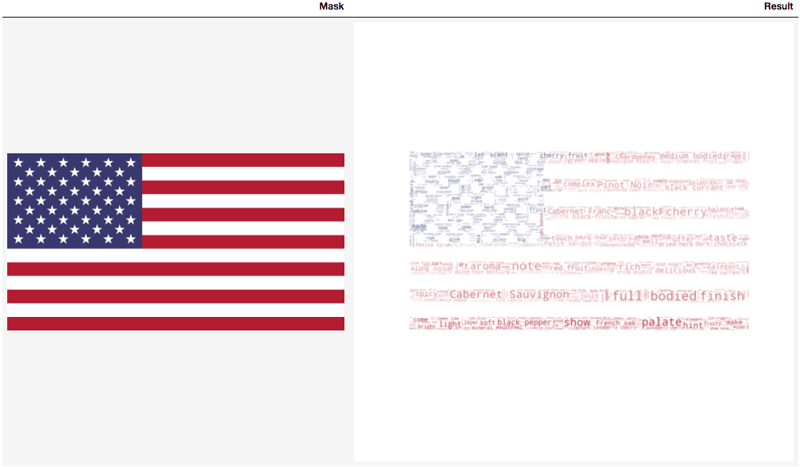
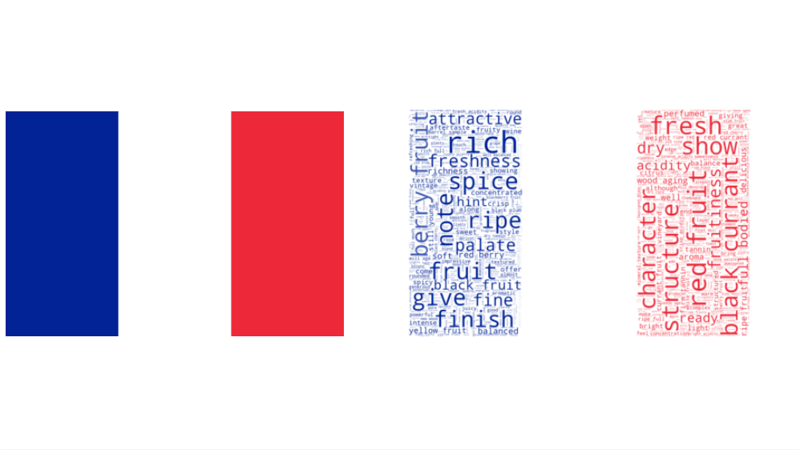
अच्छा लग रहा है! अब फ्रांस की समीक्षा के साथ यही दोहराते हैं।
# Generate a word cloud image
mask = np.array(Image.open("img/france.png"))
wordcloud_fra = WordCloud(stopwords=stopwords, background_color="white", mode="RGBA", max_words=1000, mask=mask).generate(fra)
# create coloring from image
image_colors = ImageColorGenerator(mask)
plt.figure(figsize=[7,7])
plt.imshow(wordcloud_fra.recolor(color_func=image_colors), interpolation="bilinear")
plt.axis("off")
# store to file
plt.savefig("img/fra_wine.png", format="png")
#plt.show()
कृपया ध्यान दें कि वांछित रंग-पैटर्न वाला वर्ड क्लाउड प्राप्त करने के लिए आपको प्लॉट करने के बाद इमेज सेव करनी चाहिए।
# Generate a word cloud image
mask = np.array(Image.open("img/italy.png"))
wordcloud_ita = WordCloud(stopwords=stopwords, background_color="white", max_words=1000, mask=mask).generate(ita)
# create coloring from image
image_colors = ImageColorGenerator(mask)
plt.figure(figsize=[7,7])
plt.imshow(wordcloud_ita.recolor(color_func=image_colors), interpolation="bilinear")
plt.axis("off")
# store to file
plt.savefig("img/ita_wine.png", format="png")
#plt.show()
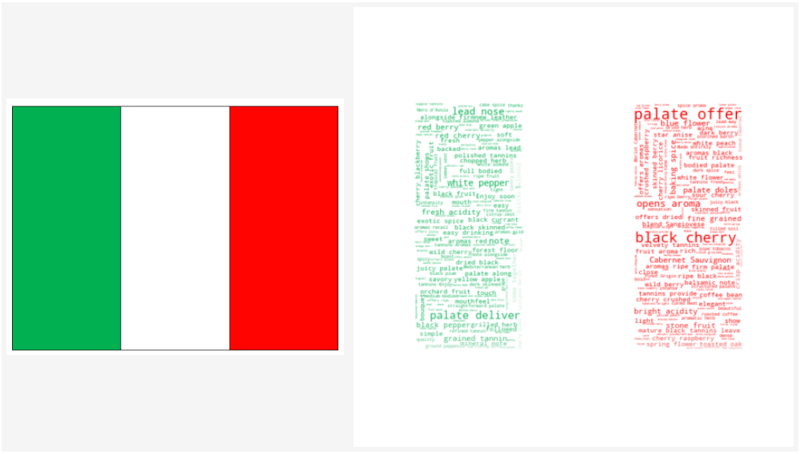
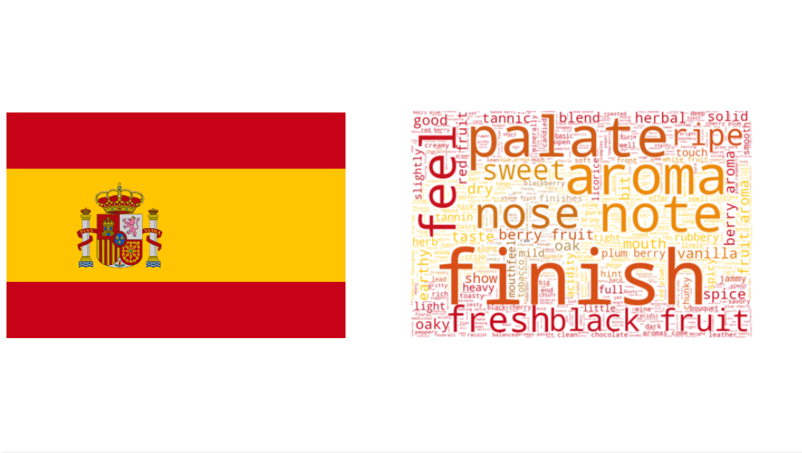
इटली के बाद स्पेन:
# Generate a word cloud image
mask = np.array(Image.open("img/spain.png"))
wordcloud_spa = WordCloud(stopwords=stopwords, background_color="white", max_words=1000, mask=mask).generate(spa)
# create coloring from image
image_colors = ImageColorGenerator(mask)
plt.figure(figsize=[7,7])
plt.imshow(wordcloud_spa.recolor(color_func=image_colors), interpolation="bilinear")
plt.axis("off")
# store to file
plt.savefig("img/spa_wine.png", format="png")
#plt.show()
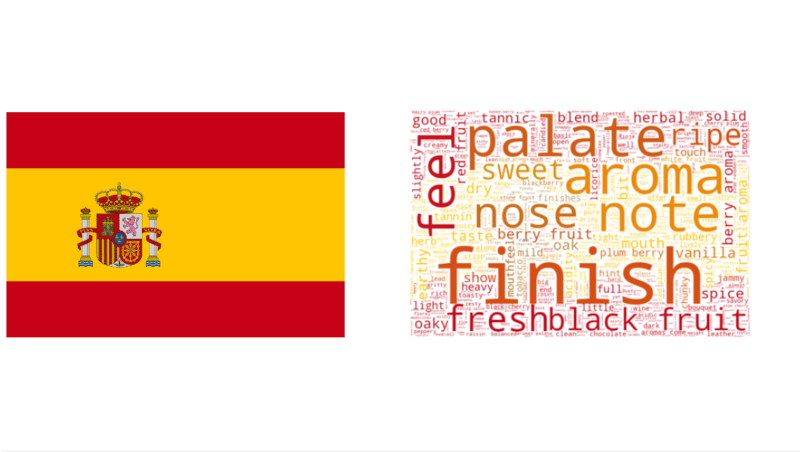
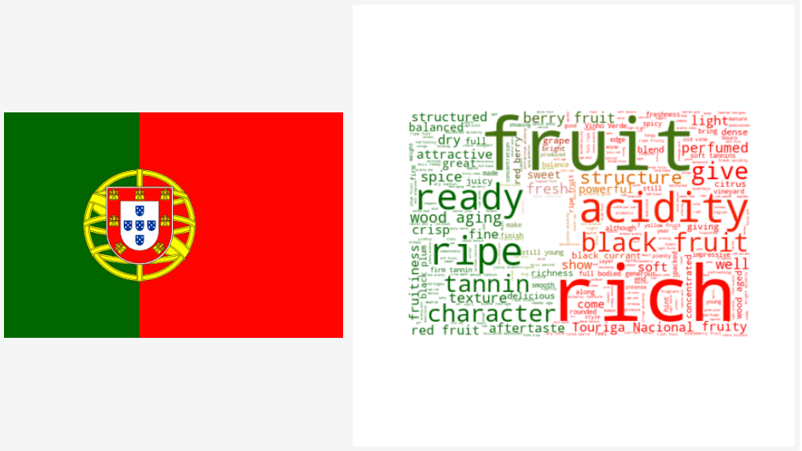
अंत में, पुर्तगाल:
# Generate a word cloud image
mask = np.array(Image.open("img/portugal.png"))
wordcloud_por = WordCloud(stopwords=stopwords, background_color="white", max_words=1000, mask=mask).generate(por)
# create coloring from image
image_colors = ImageColorGenerator(mask)
plt.figure(figsize=[7,7])
plt.imshow(wordcloud_por.recolor(color_func=image_colors), interpolation="bilinear")
plt.axis("off")
# store to file
plt.savefig("img/por_wine.png", format="png")
#plt.show()
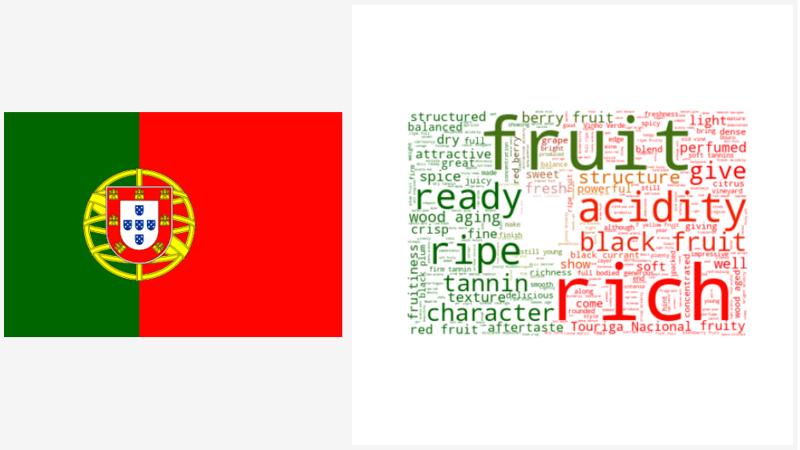
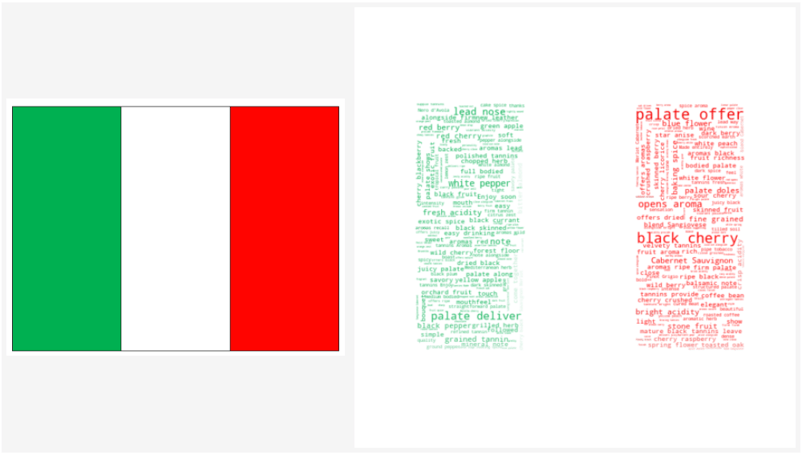
अंतिम परिणाम नीचे दी गई तालिका में है जिससे मास्क और वर्ड क्लाउड्स की तुलना हो सके। आपका पसंदीदा कौन-सा है?
वर्ड क्लाउड की व्याख्या कैसे करें
तो, अब हमने कई वर्ड क्लाउड उदाहरण देखे और उन्हें Python में बनाना सीखा। हालाँकि, इन डेटा विज़ुअलाइज़ेशन्स की व्याख्या कैसे करें, यह समझना भी ज़रूरी है। सामान्यतः, क्लाउड में हर शब्द का आकार टेक्स्ट में उसकी आवृत्ति या महत्त्व का प्रतिनिधित्व करता है। आमतौर पर, जो शब्द टेक्स्ट में अधिक बार आता है, वह वर्ड क्लाउड में बड़ा दिखेगा।
वर्ड क्लाउड की व्याख्या करते समय कुछ बातों का ध्यान रखें:
- शब्दों के आकार पर ध्यान दें: जैसा कहा गया, क्लाउड में हर शब्द का आकार टेक्स्ट में उसकी आवृत्ति या महत्त्व से संबंधित होता है। इसलिए, बड़े शब्द आमतौर पर टेक्स्ट के समग्र संदेश में अधिक महत्वपूर्ण होते हैं।
- पैटर्न खोजें: क्या कोई ऐसे शब्द-समूह हैं जो अक्सर साथ दिखते हैं? यह टेक्स्ट में किसी थीम या टॉपिक का संकेत दे सकता है।
- संदर्भ पर विचार करें: याद रखें कि वर्ड क्लाउड केवल टेक्स्ट में आने वाले शब्दों को दर्शाता है—यह उनके अर्थ या उपयोग के तरीके की जानकारी नहीं देता। इसलिए टेक्स्ट के संदर्भ और इस्तेमाल किए गए शब्दों के विशिष्ट अर्थों के बारे में सोचना महत्वपूर्ण है।
- आउटलायर से सावधान रहें: कभी-कभी कोई शब्द केवल बार-बार आने के कारण क्लाउड में बहुत बड़ा दिख सकता है, भले ही वह टेक्स्ट के समग्र संदेश के लिए खास मायने न रखता हो। ऐसे आउटलायर पर नज़र रखें और सबसे महत्वपूर्ण शब्दों व पैटर्न्स पर ध्यान केंद्रित करें।
कुल मिलाकर, वर्ड क्लाउड किसी टेक्स्ट की प्रमुख थीम्स और विचारों को जल्दी से विज़ुअलाइज़ करने का उपयोगी टूल हो सकता है। हालाँकि, यह कई टूल्स में से बस एक है, और गहन विश्लेषण और समझ के लिए इसे अन्य विधियों के साथ मिलाकर उपयोग करना चाहिए।
बधाई हो!
आपने कर दिखाया! आपने WordCloud लाइब्रेरी का उपयोग करके Python में वर्ड क्लाउड बनाने के कई तरीके सीख लिए, जो किसी भी टेक्स्ट विश्लेषण के विज़ुअलाइज़ेशन में सहायक होंगे। आपने यह भी सीखा कि किसी भी आकार में क्लाउड को मास्क कैसे करें और अपनी पसंद के किसी भी रंग का उपयोग कैसे करें। यदि आप अपने कौशल का अभ्यास करना चाहते हैं, तो DataCamp का प्रोजेक्ट देखें: The Hottest Topics in Machine Learning
यदि आप नैचुरल लैंग्वेज प्रोसेसिंग के बारे में और सीखना चाहते हैं, तो हमारा Natural Language Processing Fundamentals in Python ट्रैक लें।
वर्ड क्लाउड क्या है?
अक्सर आपने अलग-अलग आकारों में बहुत-से शब्दों से भरा एक बादल-सा देखा होगा, जो हर शब्द की आवृत्ति या महत्त्व को दर्शाता है। इसे टैग क्लाउड या वर्ड क्लाउड कहते हैं। इस ट्यूटोरियल में, आप सीखेंगे कि Python में वर्ड क्लाउड कैसे बनाया जाए और अपनी सुविधा के अनुसार उसे कैसे कस्टमाइज़ किया जाए। यह टूल टेक्स्ट डेटा की जाँच-परख के लिए उपयोगी है और आपकी रिपोर्ट को अधिक जीवंत बनाता है।
इस हैंड्स-ऑन एक्सरसाइज़ के साथ Python में WordCloud बनाना प्रैक्टिस करें।
इस ट्यूटोरियल में हम Wine Enthusiast वेबसाइट के वाइन रिव्यू डेटासेट का उपयोग करेंगे और जानेंगे:
वर्ड क्लाउड कब उपयोग करें
यह याद रखना ज़रूरी है कि वर्ड क्लाउड किसी टेक्स्ट या डेटा सेट में सामान्य शब्दों को विज़ुअलाइज़ करने के लिए उपयोगी होते हैं, लेकिन आमतौर पर वे सिर्फ उच्च-स्तरीय थीम्स का अवलोकन देते हैं। ये बार प्लॉट्स के समान हैं, लेकिन अक्सर अधिक आकर्षक दिखते हैं (हालाँकि कभी-कभी उनकी व्याख्या कठिन हो सकती है)। वर्ड क्लाउड खास तौर पर तब मददगार होते हैं जब आप:
हालाँकि, ध्यान रखें कि वर्ड क्लाउड इस्तेमाल किए गए शब्दों और वाक्यांशों का संदर्भ या गहन समझ नहीं देते। इसलिए, उन्हें टेक्स्ट डेटा का विश्लेषण और व्याख्या करने के लिए अन्य विधियों के साथ मिलकर उपयोग करना चाहिए।
पूर्वापेक्षाएँ
Python में वर्ड क्लाउड बनाना शुरू करने के लिए, आपको नीचे दिए गए कुछ पैकेज इंस्टॉल करने होंगे:
numpyलाइब्रेरी बहु-आयामी ऐरे और मैट्रिसेस संभालने के लिए सबसे लोकप्रिय और उपयोगी लाइब्रेरी में से एक है। यहpandasलाइब्रेरी के साथ मिलकर डेटा विश्लेषण करने में भी काम आती है।Python का
osमॉड्यूल बिल्ट-इन है, इसलिए इसे इंस्टॉल करने की ज़रूरत नहीं। os मॉड्यूल से फ़ाइलें संभालने के बारे में और पढ़ने के लिए, DataCamp का Python में फ़ाइलें पढ़ना और लिखना ट्यूटोरियल सहायक होगा।विज़ुअलाइज़ेशन के लिए
matplotlibएक बेसिक लाइब्रेरी है, जिस पर कई अन्य लाइब्रेरीज़ चलती और प्लॉट करती हैं, जैसे कि इस ट्यूटोरियल में उपयोग होने वालाseabornयाwordcloud।pillowलाइब्रेरी इमेज पढ़ने में सक्षम बनाती है। Pillow, PIL - Python Imaging Library का रैपर है। आपको वर्ड क्लाउड के लिए मास्क के रूप में इमेज पढ़ने हेतु इस लाइब्रेरी की आवश्यकता होगी।wordcloudइंस्टॉल करना थोड़ा पेचीदा हो सकता है। यदि आपको केवल बेसिक वर्ड क्लाउड प्लॉट करना है, तोpip install wordcloudयाconda install -c conda-forge wordcloudपर्याप्त होगा। लेकिन नवीनतम संस्करण, जो किसी भी आकार में क्लाउड को मास्क करने की क्षमता देता है, नीचे दिए गए अलग इंस्टॉलेशन तरीके की मांग करता है:डेटासेट:
इस ट्यूटोरियल में Kaggle का wine review डेटासेट उपयोग किया गया है। यह संग्रह सीखने के लिए बेहतरीन है—इसमें मिसिंग वैल्यूज़ नहीं हैं (जिन्हें सँभालने में समय लगता) और इसमें बहुत-सा टेक्स्ट (वाइन रिव्यू), श्रेणीबद्ध और संख्यात्मक डेटा है।
Python में वर्ड क्लाउड बनाना: तैयारी
ज़रूरी लाइब्रेरी इंस्टॉल करें
सबसे पहले, सभी आवश्यक लाइब्रेरी लोड करें:
यदि आपके पास 10 से अधिक लाइब्रेरी हैं, तो उन्हें सेक्शंस (जैसे basic libs, visualization, models आदि) में व्यवस्थित करें। कोड में कमेंट्स का उपयोग उसे साफ़ और फ़ॉलो करना आसान बनाता है।
डेटा को डेटाफ़्रेम में लोड करें
अब pandas के
read_csvसे डेटाफ़्रेम लोड करें।index_col=0का उपयोग ध्यान दें—इसका मतलब है कि हम पंक्ति नाम (इंडेक्स) को अलग कॉलम के रूप में नहीं पढ़ते।print()के साथ.format()मिलाकर आप डेटासेट की कुछ बुनियादी जानकारी अच्छी तरह प्रिंट कर सकते हैं।फ़ीचर्स की तुलना के लिए समूह बनाएँ
किसी फ़ीचर के समूहों के बीच तुलना करने के लिए, आप
groupby()का उपयोग कर सार-सांख्यिकी निकाल सकते हैं।वाइन डेटासेट में, आप देश के आधार पर समूह बना सकते हैं और सभी देशों के points और price की सार-सांख्यिकी देख सकते हैं या सबसे लोकप्रिय और महंगी प्रविष्टियाँ चुन सकते हैं।
यह 44 देशों में से औसत points के हिसाब से शीर्ष 5 का चयन करता है:
डेटा प्लॉट करें
Pandas DataFrame और Matplotlib की plot विधि से आप देशवार वाइनों की संख्या प्लॉट कर सकते हैं। यदि आप Matplotlib से परिचित नहीं हैं, तो हमारा Matplotlib ट्यूटोरियल देखें।
44 देशों में जो वाइन बनाते हैं, उनमें US के पास वाइन रिव्यू डेटासेट में 50,000 से अधिक प्रकार हैं—रैंक में अगले देश फ्रांस (जो अपनी वाइन के लिए प्रसिद्ध है) से दोगुने। इटली भी काफी गुणवत्ता वाली वाइन बनाता है, जिसकी करीब 20,000 वाइनों की समीक्षा उपलब्ध है।
डेटा की जाँच करें
अब, ऊपर जैसी ही प्लॉटिंग तकनीक का उपयोग करके 44 देशों के सबसे उच्च-रेटेड वाइन का प्लॉट देखें:
ऑस्ट्रेलिया, US, पुर्तगाल, इटली और फ्रांस—सभी के पास 100-प्वाइंट वाइन्स हैं। यदि आप ध्यान दें, तो पुर्तगाल वाइनों की संख्या के मामले में 5वें और ऑस्ट्रेलिया 9वें स्थान पर है, और दोनों देशों में 8000 से कम प्रकार हैं।
यह आज आप जिस डेटासेट का उपयोग कर रहे हैं उसे समझने के लिए थोड़ी-सी डेटा एक्सप्लोरेशन थी। अब मुख्य भाग—वर्ड क्लाउड—की ओर बढ़ते हैं।
Python में बेसिक वर्ड क्लाउड सेट करना
शुरूआत
वर्ड क्लाउड किसी दिए गए टेक्स्ट में सबसे अधिक बार आने वाले शब्दों को दिखाने की तकनीक है। इसमें मदद के लिए हम एक Python लाइब्रेरी का उपयोग कर सकते हैं। किसी भी फ़ंक्शन का उपयोग करने से पहले, उसका डॉक्स्ट्रिंग देखना और आवश्यक व वैकल्पिक आर्ग्युमेंट्स समझना उपयोगी होता है। ऐसा करने के लिए
?functionटाइप करें और चलाएँ ताकि सारी जानकारी मिले।आप देख सकते हैं कि WordCloud ऑब्जेक्ट के लिए एकमात्र अनिवार्य आर्ग्युमेंट text है, जबकि बाकी सब वैकल्पिक हैं।
सरल इनपुट से शुरुआत करें
तो एक सरल उदाहरण से शुरू करते हैं: पहले ऑब्ज़र्वेशन के description को वर्ड क्लाउड के इनपुट के रूप में उपयोग करें। तीन चरण हैं:
बहुत बढ़िया! आप देख सकते हैं कि पहली समीक्षा में सूखे फ्लेवर्स और वाइन की अरोमा के बारे में बहुत उल्लेख है।
वैकल्पिक वर्ड क्लाउड आर्ग्युमेंट्स बदलना
अब,
max_font_size,max_word, औरbackground_colorजैसे कुछ वैकल्पिक आर्ग्युमेंट्स बदलें।ऐसा लगता है कि यहाँ
max_font_sizeका उपयोग अच्छा विचार नहीं है। यह शब्द आवृत्तियों के बीच के अंतर देखना कठिन बनाता है। हालाँकि, बैकग्राउंड को उजला करना क्लाउड को पढ़ना आसान बनाता है।यदि आप इमेज सेव करना चाहते हैं, तो WordCloud
to_fileफ़ंक्शन देता हैपरिणाम को लोड करने पर यह कुछ ऐसा दिखेगा:
आपने शायद
plt.imshow()मेंinterpolation="bilinear"आर्ग्युमेंट नोट किया होगा। यह प्रदर्शित इमेज को अधिक स्मूद दिखाने के लिए है। चुनाव के बारे में अधिक जानकारी के लिए, यह imshow के लिए इंटरपोलेशन मेथड्स ट्यूटोरियल उपयोगी है।डेटा को संयोजित करना
अब आप सभी वाइन रिव्यूज़ को एक बड़े टेक्स्ट में मिलाएँगे और एक बड़ा क्लाउड बनाएँगे ताकि दिखे कि इन वाइनों में कौन-सी विशेषताएँ सबसे सामान्य हैं।
लगता है ब्लैक चेरी और फुल-बॉडीड सबसे अधिक उल्लिखित विशेषताएँ हैं, और Cabernet Sauvignon इन सबमें सबसे लोकप्रिय है। यह इस तथ्य के अनुरूप है कि Cabernet Sauvignon "दुनिया की सबसे व्यापक रूप से पहचानी जाने वाली रेड वाइन अंगूर किस्मों में से एक है। इसे कनाडा की Okanagan Valley से लेकर लेबनान की Beqaa Valley तक विविध जलवायु वाले लगभग हर प्रमुख वाइन-उत्पादक देश में उगाया जाता है"।[1]
Python में वर्ड क्लाउड विज़ुअलाइज़ेशन
अब, इन शब्दों को वाइन के एक कप (या बोतल) में उड़ेलते हैं!
अपने वर्ड क्लाउड के लिए आकार बनाने हेतु, सबसे पहले आपको एक PNG फ़ाइल ढूँढनी होगी जो मास्क बने। नीचे इंटरनेट पर उपलब्ध एक अच्छी फ़ाइल दी गई है: