
Course
Understanding Data Science
2 hr
860K
Ever wondered why a few websites get most of the internet traffic? Or why a small fraction of individuals control the majority of the world’s wealth? The answer lies in a fascinating statistical phenomenon known as the power law.
Power laws govern many natural and man-made systems. These distributions are special because they don't change with scale and have heavy tails. These traits make them perfect for modeling data where small events happen a lot, but big, important events, even if they are rare, can't be ignored.
This tutorial will provide a comprehensive overview of power laws, including their theory, math, uses, and how to estimate them. We'll look at how they are scale invariant and why they show up in diverse fields such as geophysics, finance, biology, and the internet.
Let’s start with what makes power laws special—and where they are different from the distributions you might have used till now.
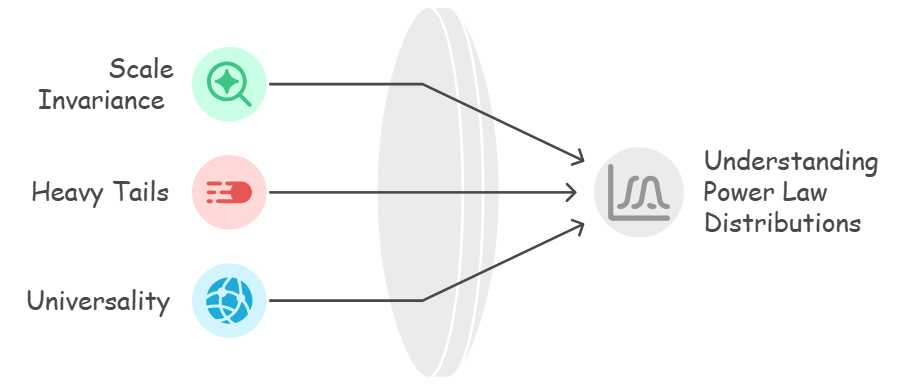
Characteristics of Power Laws. Source: Napkin AI
Simply put, scale invariance implies that if you zoom in or out, the pattern in the distribution remains the same.
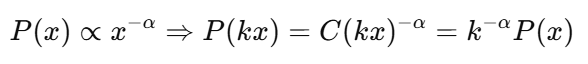
In statistical terms, a power law distribution has the same functional form no matter what scale you look at it on. If a variable follows a power law, multiplying it by a constant doesn't change the way it is distributed; it just changes the scale.
Mathematically, this means:
This is very different from other common distributions, like the normal distribution, where the shape is defined based on certain key parameters like the mean and standard deviation.
This property is also similar to self-similarity, which is a key attribute of fractals. Fractals are structures that look the same no matter how much you zoom in on them. For example, if you zoom in on any part of a snowflake, fern leaf, or tree branch, you'll see a smaller version of the whole thing.
A coastline looks the same from 10 meters away as it does from 10 kilometers away.
Power laws do a great job of showing this repeating structure. That's why they're helpful when looking at systems where size, frequency, or intensity changes a lot but always follows the same pattern.
Most classical distributions (like Gaussian or exponential) taper off quickly in the tails. Not so with power laws. They have heavy tails, meaning the probability of extreme events is higher.
In real life, big earthquakes, viral tweets, and billionaires are all examples of rare events that still have a chance of happening. In fact, for some values of alpha, moments like mean or variance may not even exist, and that’s why we say that power law distributions don't have a scale.
One amazing thing about power laws is that they are universal; they can be found in systems that don't seem to have any correlation with each other. Some of these examples include: earthquake magnitudes, spikes in neural activity, company size, and word frequencies.
The flip side is that they are also statistically incomplete. This means even though we can model how the tail behaves, it's hard to estimate a full set of summary statistics, especially from small data samples.
Let’s dive deeper into the math that makes power laws both powerful and tricky.
The standard form of a power law is:
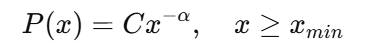
Where:
As alpha increases, the tail becomes thinner. A small alpha means that events are more extreme. This scaling exponent governs everything from inequality to ecosystem sizes.
The first step is to use a log-log plot to detect a power law in real datasets.
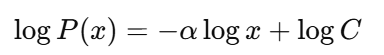
If the data really follows a power law, this will give you a straight line with a slope of −α. But be careful as a lot of distributions look linear on a log-log plot.
There are several important statistical distributions that are similar to power laws.
Sometimes, the real world data does not follow a "pure" power law forever. In these situations, we see exponential cutoffs (where very large values become less likely), curved power laws, or log-normal tails. These are better for modeling systems with physical or practical limits. These hybrids know that scale invariance might work for some of the range, but it will eventually stop working.
Power laws aren't just ideas in math; they show up in the real world and help us make sense of systems that seem random or chaotic at first.
Power laws help us understand extreme events in nature. For example, the Gutenberg-Richter law states that earthquake magnitudes follow a power law distribution. This means that small tremors happen a lot, but as the magnitude of the quake gets bigger, the number of quakes drops off quickly. That's why a 2.0 quake might happen every day, but a 7.0 quake might not happen for years. Both are part of the same statistical story.
In the same way, river networks, coastlines, and even lightning strikes show self-similar, fractal patterns that follow power law scaling in the sizes of their segments.
Power laws are also applicable to the universe. In astrophysics, we see that the size of stars, the distribution of black holes, and even the clusters of galaxies all have heavy tails. There are billions of small stars, but only a few huge ones stand out in the galaxy. It may seem like this unevenness is random, but once we understand the power law that lies beneath the surface, we can see that it follows certain statistical rules.
When looking at inequality and scale in human societies, power laws are especially useful. We already discussed the Pareto distribution in the previous section, which isn't just a theory about the economy; you can see it in tax records, corporate profits, and donation patterns.
The top 1% of people with wealth follow Pareto's law, not Gaussian averages. These distributions don't fit into a neat bell curve; instead, they stretch far to the right, showing a few extreme values (like billionaires) that throw off the average.
Power laws also show hidden patterns in biology. For example, Kleiber's law says that an animal's metabolic rate goes up as its body mass goes up to the 3/4 power, not in a straight line. This helps us understand why an elephant doesn't eat a thousand times more than a rabbit, even though it weighs a thousand times more.
Power laws also apply to city populations, company growth rates, voting behavior, and even deaths in conflicts, where a few big things or events have an outsized effect.
Power laws are what keep the digital world running and thriving. Think about how traffic on the internet works: only a few sites (like Google, Facebook, and YouTube) get most of the visits, while millions of other pages go mostly unnoticed. This is typical long-tail behavior, and it's especially important in areas like SEO, recommendation engines, and digital marketing.
In AI, the sizes and performance of models tend to go in the same direction. There are a few big models, like GPT-4, that are the best in the field, but hundreds of smaller models can't keep up. This concentration is partly because of feedback loops: better models get more users, data, and money, which makes them even more powerful.
So, it looks like your dataset follows a power law. The histogram might have a long tail, or the log-log plot might show a line that is mostly straight. That's a good start, but just looking at it isn't enough as it’s not too hard to be misled by power laws. That's why we need good statistical tools to figure out the parameters and check the fit.
The scaling exponent, which is usually written as 𝛼, is the first thing you need to model a power law distribution correctly.
Maximum Likelihood Estimation (MLE) is one of the most common ways to get an estimate of 𝛼. It is a way to find the parameter values that make the observed data most likely in all of statistics.
For continuous data with a known minimum value 𝑥min, this is how it works:
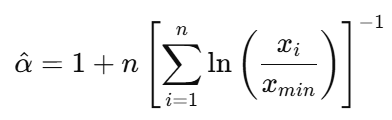
But here's the hard part: picking the right 𝑥 min is very important. If it's too low, your model has data that doesn't really follow the power law. And if it’s too high, you will end up wasting too much data. Also, when sample sizes are small, MLE estimates can be unreliable.
After you estimate the exponent, the next question is: how well does it fit? You can't just say, "It kind of looks like a power law." You need statistical evidence that the power law does a better job of explaining your data than other possible distributions. This is where the Kolmogorov–Smirnov (KS) test comes into picture. This test finds the biggest gap between the cumulative distribution function (CDF) of your observed data and the theoretical power law model.
The closer this number is to zero, the better your model fits the data. The KS test doesn't use binning or histograms like many other tests do. Instead, it works directly with the raw data, which makes it very useful for heavy-tailed distributions.But sometimes, a power law isn't the only plausible explanation. A log-normal or exponential distribution might also be able to model your data. This is when likelihood ratio tests are useful. The idea is easy: use MLE to fit both models to the same data, find the likelihoods, and then compare them. You have statistical support for the power law model if its likelihood is much higher.
The Clauset-Shalizi-Newman (2009) framework is one of many tools that combine MLE, KS testing, and likelihood ratio tests into a strong way to look at power law behavior.
Now that we know where power laws show up in the real world and how to find them statistically, the next question is: why do these distributions show up in the first place? Let’s look at how power laws might emerge from system dynamics.
The Barabási–Albert model (1999) introduced preferential attachment, which is often summed up as "the rich get richer" phenomenon. It is one of the most well-known and easy-to-understand ways that power laws work.
Think about making a network, like the internet or a social media site. When a new user joins, they are more likely to connect to popular nodes like Facebook or Google because those nodes are already well-known.
Over time, this creates a feedback loop: popular nodes get even more connections, while newer or less connected ones stay small. This makes a scale-free network where the degrees of the nodes follow a power law.
Similarly, the Yule processes model the growth of biological genera, is an extension to this idea. In this model, species that already have more members are more likely to give birth to new species. This leads to a skewed distribution where a few genera are in charge.
Random growth processes are another way that power laws can show up. The main idea is that things get bigger over time by multiplying random amounts instead of adding them.
Gibrat's law states that the growth rate is independent of size. Most things stay small, but a few grow very quickly and get very big, making the heavy tail of a power law.
Markov processes, especially those involving multiplicative noise, can also converge to power law-like stationary distributions—especially under reflecting boundaries.
There is also a probabilistic side to this. Markov processes can also show power law behavior in some situations. These processes model systems where the next state only depends on the current one, not the past. People have used this to model things like how people move around in a population and how queues work.
These models aren't just interesting ideas. They help us understand how complex systems change over time, why inequality stays the same, and how network effects affect everything from biology to blockchain. Not only can we use power laws to describe the world, but we can also use them to explain it.
Understanding the dynamics of power laws is super critical and can have a big effect on your predictions and choices, whether you're making a financial risk model, running an internet infrastructure, or studying social behavior.
Power law models are helpful for systems where rare but important events happen. For instance, in finance, prices may change at a normal rate on most days, but the "black swans"—the rare crashes or booms—may have the biggest effect.
Power law models can better capture this tail risk than traditional models, which often underestimate how likely these events are to happen. For risk management, insurance, cybersecurity, and disaster planning, that's a big deal.
There is also the benefit of understanding nonlinear growth and compounding effects. Power laws help explain why some people, companies, or nodes in a network can become the most powerful over time and why these "winner-takes-most" situations are not just unusual but normal in these kinds of systems.
But there are some trade-offs with power law models. One problem is that they defy intuition - as in they don't always have clear averages or variances, which makes it hard to figure out common metrics like "expected value" or "standard deviation."
These models usually only work on the tail of the distribution, so they might not fit the bulk of the data well or at all. This can be a problem if you're not careful about where the power law behavior actually starts.
Not all datasets with long tails follow a real power law. Few distributions, such as log-normal or stretched exponential, can look like power law behavior in a small range, especially on a log-log plot. This often leads to false positives, where we take it as a power law just because the plot "looks linear."Overgeneralization is another problem. People often think that power laws explain everything about a system, but they might only explain a small part of it, usually the extreme end. For example, the top 1% of people may have a power law for their income distribution, but the rest of the population may have a very different one.
The law of diminishing returns is another problem that real-world systems face. Power laws state that extreme outcomes are possible, but in some areas, like physical limits or regulatory environments, there are limits beyond which the model doesn't work anymore. If you think that the tail behavior goes on forever, you might think that the risks or rewards are bigger than they really are, especially in systems with limits.
Power laws help us understand systems where a few extreme events or entities have a big effect, like earthquakes, internet traffic, or the way income is spread out. In this tutorial, we learned about what makes power laws different, their mathematical properties and empirical fingerprints, how to find and check them, and where they can be found in the real world.
Power law analysis will have interesting future uses in areas like AI, economics, network science, and risk management. We can use them to better understand a complicated, nonlinear world if we have the right tools and knowledge.
As you dive deeper into real-world data, always question: is the rare really rare—or is it just powerfully distributed?
If you want to learn more about some of the concepts, please check out the following resources:
Learn with DataCamp
Course
Course
Course
Tutorial
Laiba Siddiqui
Tutorial
Amberle McKee
Tutorial
Vinod Chugani
Tutorial
Vinod Chugani
Tutorial
Vinod Chugani
Tutorial
Vahab Khademi