
Data Analyst Roadmap: A 12-Month Step-by-Step Learning Plan

Follow this practical 12-month data analyst roadmap to build essential skills, master analytics tools, complete real-world projects, and launch your data analysis career with confidence.
Apr 30, 2025  · 9 min read

Data is the backbone of every modern organization. Data analysts who can turn numbers into insights are in high demand across industries like healthcare, finance, marketing, climate science, and beyond. If you’re eager to build a career in data analysis, you might feel overwhelmed by the sheer volume of skills, tools, and resources out there. You’re not alone: many aspiring analysts struggle to find a clear, actionable path to success.

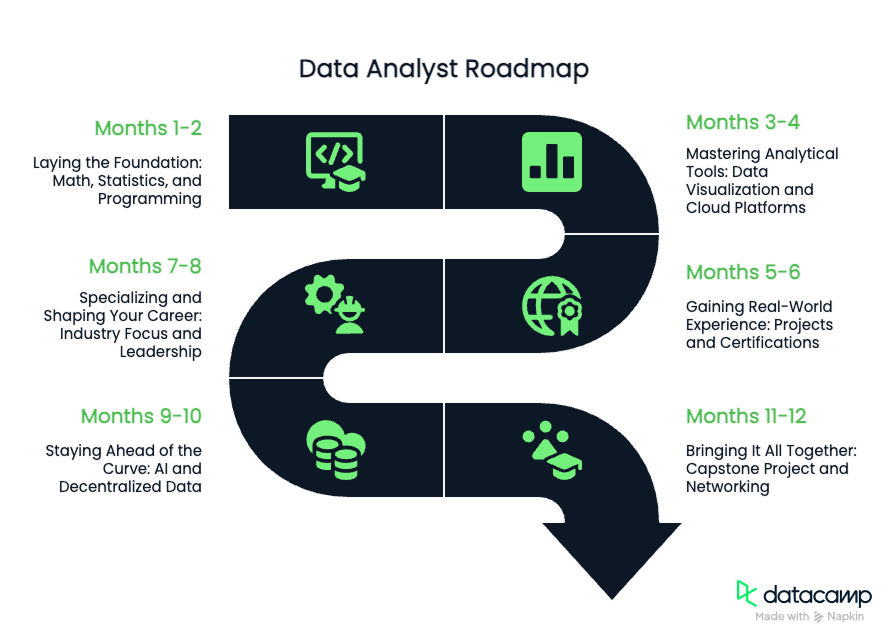
That’s why we’ve created this 12-month data analyst roadmap. It’s designed to guide you step by step from building essential foundations to mastering advanced tools and carving out your own niche. Along the way, you’ll gain hands-on experience, work on real projects, and develop the confidence needed for a data-driven career. 

For a more detailed guide, you can check out our article on how to become a data analyst. This roadmap gives a more succinct, milestone-driven approach. 

TL;DR: 12-Month Roadmap Milestones

  • Months 1-2: Build strong foundations in math, statistics, and programming (Python, R, SQL).
  • Months 3-4: Master data visualization (Tableau, Power BI) and explore cloud/big data tools.
  • Months 5-6: Apply your skills through real projects and earn key certifications.
  • Months 7-8: Deepen industry knowledge and explore leadership opportunities.
  • Months 9-10: Stay ahead with AI-powered analytics and decentralized data trends.
  • Months 11-12: Synthesize your skills in a portfolio project, grow your network, and plan next steps.

Data Analyst Roadmap

Months 1-2: Laying the Foundation

To succeed as a data analyst, you need a solid foundation in core concepts. The first stage of your journey focuses on building essential skills in mathematics, statistics, and programming, including programming languages such as Python, R, and SQL.

Building math and statistics essentials

A working knowledge of math and statistics helps you understand data patterns and make sound decisions. At this stage, focus on:

  • Core statistics: Learn about means, medians, modes, variance, standard deviation, and the basics of probability.
  • Hypothesis testing: Understand how to set up and test hypotheses, a skll vital for drawing valid conclusions.
  • Regression analysis: Get comfortable with linear and logistic regression to identify relationships between variables.

These concepts will help you think analytically and interpret data with confidence.

Learning programming and databases

Programming is at the heart of data analysis. Early on, focus on the three must-have tools:

  • Python: A top choice for its simplicity and huge range of data libraries (like pandas and scikit-learn).
  • R: Powerful for statistical analysis and making attractive visualizations.
  • SQL: The standard language for querying and managing data in databases.

Knowing these tools lets you access, clean, and analyze real-world data efficiently.

Top resources for months 1-2:

Months 3-4: Mastering Analytical Tools

With a strong foundation, it’s time to build proficiency in the tools that bring your analysis to life. This stage is about turning raw data into insights and stories that drive decisions.

Sharpening your data visualization skills

Great analysts don’t just find insights, they communicate them clearly. Focus on:

  • Visualization principles: Learn how to tell a story with data, from choosing the right chart to highlighting patterns.
  • Tableau and Power BI: Mastering these tools enables you to create interactive dashboards and reports for any audience.

As a bonus, you can start to explore how AI is changing the game when it comes to analytics, getting familiar with everything from enhanced data storytelling, automated visualizations, and personalized narratives

Exploring cloud and big data platforms

Modern organizations often store and analyze data in the cloud. At this stage, get familiar with:

  • Cloud analytics platforms: AWS, Azure, and Google Cloud offer scalable solutions for storing and analyzing large datasets.
  • Big data technologies: Tools like Spark SQL and time-series databases help handle massive or streaming datasets.

These skills prepare you for the realities of working in data-driven organizations.

Top resources for months 3-4

Months 5-6: Gaining Real-World Experience

Learning theory and tools is only half the journey. Now, it’s time to put your skills into practice and start building a portfolio that showcases your abilities to employers.

Working on real projects

Hands-on experience makes your learning stick. Challenge yourself with:

  • Competitions and open datasets: Join data competitions on platforms like Kaggle to solve real business problems.
  • End-to-end projects: Try building a complete project, from data collection and cleaning to analysis, modeling, and reporting. Use GitHub for version control and to share your work.
  • Start building your portfolio: Use DataLab to work on your own projects and collate them in your DataCamp Portfolio. 

A strong portfolio with documented projects helps you stand out in the job market.

Earning certifications and building credibility

Certifications validate your skills and show employers you’re serious about your career. Consider:

  • Industry certifications: DataCamp offers a range of certifications, from data analyst-specific ones to particular technologies and career paths.
  • Continuous learning: Stay sharp with courses and regular refreshers to keep up with new trends.

Top resources for months 5-6

Months 7-8: Specializing and Shaping Your Career

By now, you’ll have a strong skill set and some practical experience. This is the time to carve out your own path by specializing in an industry and building your soft skills.

Diving into industry specialization

Data analysts are in demand everywhere, but deep domain knowledge sets you apart. Consider focusing on:

  • Healthcare: Learn about EHRs, privacy laws, and healthcare analytics.
  • Fintech: Specialize in fraud detection, risk modeling, or financial data analysis.
  • Sustainability and climate: Work with geospatial data, carbon tracking, or environmental metrics.

Exploring soft skills

Develop soft skills like communication, stakeholder management, and understanding business needs to excel in these roles. Consider working on areas including: 

  • Data storytelling: The ability to weave data into a compelling narrative that drives business decisions.
  • Presentation skills: Mastery of presentation tools and the ability to present data visually and verbally are key.
  • Interpersonal skills: Building relationships with team members and stakeholders is crucial for collaborative projects.

Top resources for months 7-8

Months 9-10: Staying Ahead of the Curve

The data field keeps changing; new tools and trends emerge all the time. Staying curious and adaptable is what keeps you at the top of your game.

Embracing AI-powered analytics

Artificial intelligence is changing how we analyze data. Today’s analysts need to be comfortable with:

Generative AI tools:

Use natural language queries, automated insights, and AI-powered suggestions to speed up your work.

  • ChatGPT & Claude for data work: Learn prompt engineering to generate SQL queries, troubleshoot code, and automate repetitive analysis tasks 
  • GitHub Copilot: Speed up your coding with AI-assisted completions for Python, R, and SQL.

Explainable AI (XAI):

Interpret and validate complex models with tools like LIME or SHAP, especially for regulated industries.

AI for data workflows:

Accelerate data preparation with AI-assisted tools and build data-aware applications using LlamaIndex and LangChain.

These skills make you a forward-thinking, responsible analyst.

Top resources for months 9-10

Months 11-12: Bringing It All Together

As you complete your first year, your goal is to integrate everything you’ve learned, showcasing your skills and building meaningful connections for your next career move.

Completing a capstone project

A comprehensive project is your best showcase. Choose a real business question and walk through every step, from data sourcing and cleaning to analysis, modeling, and visualization. Clearly document your process and results.

Share your project on GitHub or with your DataCamp portfolio. Great portfolios focus on both technical skills and clear communication.

Building your professional network

Your network is a powerful career tool. Get involved by:

  • Joining associations: Organizations like the Digital Analytics Association offer mentorship, events, and resources.
  • Seeking mentorship: Learn from experienced analysts or give back by mentoring newcomers.
  • Attending events: Conferences, webinars, and workshops connect you with peers, employers, and the latest industry trends.

Staying active in the data community keeps you inspired and informed.

Top resources for months 11-12

Conclusion

Your journey to becoming a data analyst is a marathon, not a sprint. Over 12 months, you’ll master the fundamentals, explore the latest technologies, and build a portfolio that proves your value. This data analyst roadmap sets you up to:

  • Analyze and interpret data confidently
  • Use the latest tools for visualization and analysis
  • Build real-world projects and a standout portfolio
  • Earn certifications and pursue ongoing learning
  • Specialize in an industry or grow into leadership
  • Stay ahead of emerging trends like AI and decentralized analytics
  • Connect, share, and grow within the data community

Remember: learning never stops. The best analysts keep exploring, asking questions, and embracing change. With focus and curiosity, you can shape a rewarding, future-proof career in data analysis.

Data Analyst Roadmap FAQs

What are the most important soft skills for a data analyst?

Strong communication skills are crucial for a data analyst as they need to convey complex data insights to non-technical stakeholders effectively. Problem-solving abilities and critical thinking are also essential to identify trends and anomalies in data. Additionally, teamwork and collaboration are important since data analysts often work with cross-functional teams.

How can I gain practical experience in data analysis?

You can gain practical experience by working on real-world projects, which can be sourced from online platforms offering datasets, such as DataCamp and Kaggle. Internships and entry-level positions can also provide hands-on experience. Additionally, contributing to open-source projects or taking part in data analysis competitions can help you sharpen your skills.

What are the best tools for data visualization?

Some of the best tools for data visualization include Tableau, Power BI, and Google Data Studio, known for their user-friendly interfaces and powerful visualization capabilities. For those familiar with programming, libraries such as Matplotlib and Seaborn in Python or ggplot2 in R offer extensive customization options. The choice of tool often depends on the complexity of the data and the specific needs of the project.

How do I transition from a data analyst to a data scientist?

To transition from a data analyst to a data scientist, you should focus on enhancing your skills in machine learning, statistical modeling, and programming languages like Python or R. Pursuing advanced certifications or a master's degree in data science can be beneficial. Additionally, gaining experience in handling large datasets and working on projects that involve predictive analytics can help bridge the gap.

What are the key differences between data analyst and data engineer roles?

Data analysts primarily focus on interpreting data and providing actionable insights through analysis and visualization. In contrast, data engineers are responsible for building and maintaining the infrastructure that allows for the efficient storage, processing, and retrieval of data. While analysts work more with data interpretation, engineers focus on the technical aspects of data handling and pipeline creation.


Matt Crabtree's photo
Author
Matt Crabtree
LinkedIn

A senior editor in the AI and edtech space. Committed to exploring data and AI trends.  

Topics

Top DataCamp Courses

Track

Data Analyst in R

36hrs hr
From exploratory data analysis with dplyr to data visualization with ggplot2—gain the career-building R skills you need to succeed as a data analyst!
See DetailsRight Arrow
Start Course
See MoreRight Arrow
Related

blog

How to Become a Data Analyst in 2025: 5 Steps to Start Your Career

Learn how to become a data analyst and discover everything you need to know about launching your career, including the skills you need and how to learn them.
Elena Kosourova's photo

Elena Kosourova

15 min

Data Analyst surfing on wave of data

blog

9 Essential Data Analyst Skills: A Comprehensive Career Guide

Learn essential data analyst skills, both technical and soft skills, from Python programming to effective communication, to advance your career.
Matt Crabtree's photo

Matt Crabtree

9 min

blog

A Data Science Roadmap for 2025

Do you want to start or grow in the field of data science? This data science roadmap helps you understand and get started in the data science landscape.
Mark Graus's photo

Mark Graus

15 min

blog

22 Data Analyst Interview Questions: How to Prepare for a Data Analyst Interview in 2024

If you are hunting for your first data analyst job or looking to move up in your career, use this guide to help prepare for your interview, practice some data analyst interview questions, and land your dream job.
Matt Crabtree's photo

Matt Crabtree

12 min

blog

A Guide to Corporate Data Analytics Training

Understand the importance of corporate data analytics training in driving business success. Learn about key building blocks and steps to launch an effective training initiative tailored to your organization's needs.

Kevin Babitz

6 min

Tutorial

Become a Data Scientist in 8 Steps: Infographic

This DataCamp infographic outlines how you can become a data scientist in 8 steps. This guide is for everyone interested in Data Science.
Karlijn Willems's photo

Karlijn Willems

3 min

See MoreSee More