Track
AI Fundamentals
10 hr
Have you ever heard that, according to data gathered in the U.S., ice cream consumption is linked to shark attacks?
As crazy as it sounds, this type of correlation occurs when two variables appear to be related but are actually both influenced by a third variable. In this case, temperature is the likely factor. During summer, ice cream consumption increases because of the heat. At the same time, shark attacks also rise because more people are swimming in the ocean.
Although this pattern shows a correlation in the data, it does not imply that one causes the other. This is where Causal AI comes in. It helps identify true cause-and-effect relationships in data, allowing us to avoid spurious correlations.
In this article, we will explore the concept of Causal AI, its significance, and how to apply it in practice.
Causal AI is a branch of Artificial Intelligence (AI) that focuses on understanding and modeling cause-and-effect relationships, rather than just identifying patterns or correlations as other traditional Machine Learning systems do.
Causal AI helps improve the reliability, explainability, and robustness of AI systems, particularly in real-world scenarios such as healthcare and economics, which are more complex by nature.
At this point, you might be asking yourself:
Why do traditional AI methods not take causality into account?
Traditional AI systems focus on identifying patterns, correlations, and making predictions based on data. To do so, they rely on statistical and Machine Learning (ML) techniques to find associations in data.
Indeed, during training, they are designed to optimize the accuracy in the prediction by using large datasets. Those datasets are the ones containing correlations and the algorithms will notice those correlations, but explicit causal information might not present.
In addition, traditional AI systems are often criticized for their limited explainability and are frequently referred to as a “black box”. In this context, Causal AI helps build more transparent and interpretable models by explicitly reasoning about causes and effects.
Finally, while traditional (non-causal) AI methods have many applications, the key takeaway from this section is: Correlation does not imply causation.
Returning to the ice cream versus shark attacks example from the introduction, we can see that ice cream sales and shark attack incidents are correlated (both increase in summer), but ice cream does not cause shark attacks.
As we have seen, at the core of Causal AI is the goal of establishing cause-and-effect relationships between variables. However, there are also two fundamental concepts essential for understanding and manipulating these relationships within a system:
Counterfactual reasoning involves considering hypothetical scenarios to understand how changes to certain variables can alter outcomes.
I like to see Counterfactual Reasoning as asking questions such as: “What would have happened if variable X had taken a different value?”. That is a “What If” question.
In our ice cream versus shark attacks example, we could ask ourselves:“What if ice cream sales had been lower? Would there have been fewer shark attacks?”
In this counterfactual scenario, we imagine an alternate version of reality where ice cream sales decrease while everything else remains the same. Since both ice cream sales and shark attacks increase in summer due to warmer weather (a common cause), reducing ice cream sales would not affect shark attacks. This demonstrates correlation, not causation.
Interventions refer to the deliberate manipulation of variables within a system to observe changes in other variables. In this case, interventions involve actively changing a variable to a specific value, allowing us to study its direct effects on the system.
In our example, an intervention could be:
“Let’s ban ice cream sales on hot days (setting ice cream sales to 0). Will this reduce shark attacks?”
Here, we are deliberately altering the system by removing ice cream sales. The most likely outcome is no change in shark attacks since banning ice cream does not stop people from swimming. This simple example illustrates that intervening in ice cream sales has no causal effect on shark attacks.
Before moving on, if you are interested in more foundational aspects of AI, the skill track AI Fundamentals is for you!
In this section, we will explore three causal AI models that will help us understand how to work with causality.
Let’s start with the simplest model and progress to more complex ones.
Directed Acyclic Graphs (DAGs) encode the directional relationships between variables without cycles, meaning there are no loops where a variable can indirectly cause itself. They are used to depict causal relations in a binary way: Either there is a cause-effect relation between two variables, in which case there is a directed edge from cause to effect in the graph, or there is none, and therefore there is also no edge.
For example, the DAG of our original example of ice cream consumption and shark attacks shows the following causal pathways:
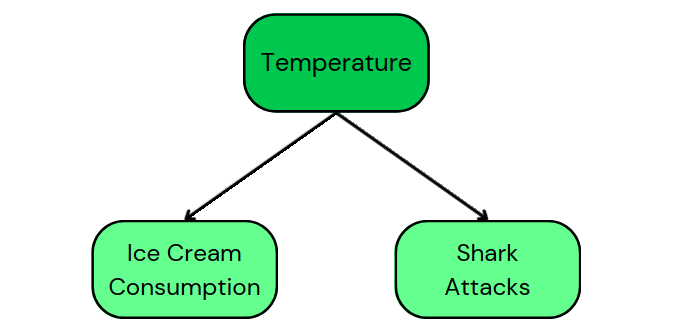
This DAG tells us that temperature is a common cause for both ice cream consumption and shark attacks. In addition, it shows that there is no causality between ice cream consumption and shark attacks.
DAGs are simple representations, but they can become more complex by adding more information to the pathways, as we will see in the following sections.
Structural Causal Models (SCMs) include equations that model how variables are influenced by others. To move from a DAG to an SCM, we need to specify a system of structural equations that quantitatively describe how each variable is generated.
Concretely, a structural equation in this context is a mathematical equation that expresses one variable (outcome) as a function of one or more other variables (causes) plus a disturbance term representing all other influences on that outcome. In our example:
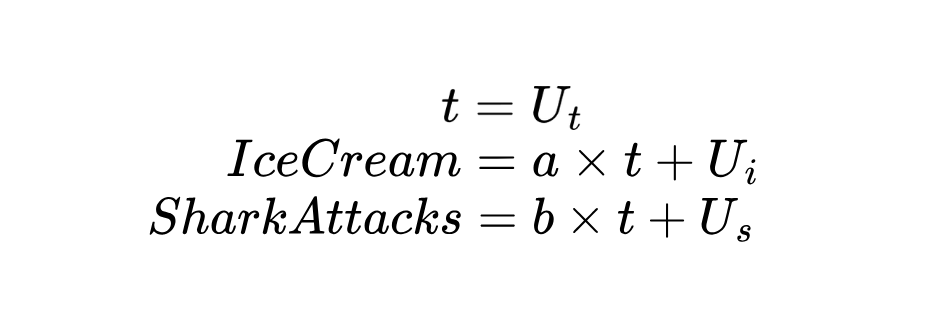
Since temperature (t) is an exogenous variable, meaning that it is not caused by the other two, we assume it is determined by external factors.
In the equations above, both ice cream consumption and shark attacks follow a linear model on the temperature, showing how a change in temperature propagates to both outcomes.
We can go even one step further and add probabilities to the game!
Bayesian Networks (BNs) can be viewed as a particular instantiation of SCMs in which the structural equations are expressed probabilistically.
A BN uses the same cause-and-effect structure, but instead of writing out exact formulas (such as a linear model), it describes the probabilities or chances of different outcomes. In other words, rather than having an equation, we express the probability of Y happening given that X has a certain value: P(Y | X). This conditional probability replaces a fixed equation in an SCM with a description of uncertainty.
In the context of Causal AI, Causal Inference refers to the techniques for figuring out cause-and-effect relationships from data. In this case, instead of focusing on the models to understand the relationships, we are starting already with a set of data and applying different methods to discern those relations. We will review them by applying each method to our original example:
Randomized Controlled Trials (RCTs) help determine causal relationships by randomly assigning participants to different groups and comparing the results.
For example, in answering our question, “Does eating ice cream cause more shark attacks?” we would randomly assign people into two groups:
Then, we would compare shark attack rates between the groups. Ideally, we should not find any significant difference in shark attack rates because ice cream consumption does not cause shark attacks. The real cause in this case is likely temperature, which was not manipulated in the experiment.
More formally, we would say that randomization isolates the effect of ice cream consumption, and since no causal link is found, this suggests that eating ice cream does not directly cause shark attacks.
In scenarios where randomization isn’t possible, we can rely on observational data and apply Propensity Score Matching (PSM).
In fact, in real-world situations, we can’t apply RCTs and randomize ice cream consumption because people decide whether or not to eat it. However, we can use observational data to infer causal relationships following the PSM steps:
Ideally, the shark attack rates should be similar for both groups, which would suggest that ice cream consumption is not the cause of shark attacks. Any observed difference would likely be due to other factors, such as temperature.
Let’s say we suspect that temperature is a hidden variable (a confounder) affecting both ice cream consumption and shark attacks. The Instrumental Variables (IV) technique helps solve this issue by using an additional variable (an instrument) — such as the ice cream truck’s schedule — that influences ice cream consumption but is unrelated to shark attacks.
If the truck’s schedule only affects ice cream sales and not people’s swimming behavior, then we can use it as an instrument to isolate the causal effect of ice cream consumption on shark attacks. When applying IV, we would likely find that after accounting for this instrument, ice cream consumption does not cause shark attacks, and the observed correlation was due to the hidden confounder: the temperature.
If you’re curious about other types of inferences, consider checking out the article “What is Machine Learning Inference? An Introduction to Inference Approaches”.
In this section, we will explore two different frameworks for working with Causal AI in practice using Python.
DoWhy is a very interesting tool because it provides an end-to-end framework for causal reasoning, emphasizing transparency and interpretability.
It is highly comprehensive and offers a wide variety of algorithms for effect estimation, root cause analysis, interventions, and counterfactuals. It is especially useful for graph-based causal inference workflows. I won’t go into too much detail about this tool, as there is already a complete tutorial available on DataCamp: Introduction to Causal AI using the DoWhy Library.
Pyro is a probabilistic programming framework whose core focus is on Structural and Bayesian modeling. One of the key benefits of Pyro is that it integrates seamlessly with PyTorch for GPU acceleration and deep learning applications.
If you are interested, Pyro has extensive documentation with many examples available.
If you are eager to start using AI frameworks such as the ones discussed in this section, I would recommend the DataCamp course on Developing AI Applications.
So far, we have reviewed the fundamentals of Causal AI, the models behind it, different approaches for Causal Inference, and two Python frameworks for working with it. Nevertheless, we all know that diving into a new discipline can be tough. Therefore, in this section, we will review the five key steps for implementing Causal AI:
The quality of the data we have is crucial since causal inference relies heavily on data that accurately represents the system being studied. It is important to keep in mind that any type of error, missing value or bias can distort causal relationships.
Causal inference also requires rich data, such as making sure that all relevant confounders are observed and included in the data, interventions are well-defined and consistent across observations and that groups are comparable when applying techniques that require this division.
As a final advice, if you get to choose your data, temporal data (time-series or longitudinal data) is often very useful for establishing causality, as it helps determine the order of events.
This step involves creating a conceptual model that represents the relationships between variables. Tools like DAGs or SCMs are often used at this point to formalize assumptions about causality.
We have seen that confounders are possible hidden variables that could be influencing our observed variables. There are also two other types of variables:
It is interesting to identify these three variable types and their potential interactions during modeling and clearly define the direction of causality.
The goal of identification is to determine whether the causal effect of interest can be estimated from the observed data, given the model. Therefore, this step involves checking if the causal effect is identifiable using Causal Inference methods such as Variable Identification.
Once the causal effect is identified, this step focuses on quantifying the causal effect using statistical methods. This is a good moment to apply Propensity Score Matching, for example.
This phase tests whether your causal conclusions hold up by challenging assumptions and exploring alternative explanations. Methods in this step include counterfactual reasoning and interventions. While counterfactuals examine whether the outcome would change under different conditions, interventions test the robustness of causal relationships by actively altering variables and observing the effects.
Now that we know how causal AI works, let’s look at some examples of domains where we can apply it.
A good example of a real-world causal AI system at work is in the healthcare domain, where it is used to determine the effectiveness of treatments by estimating, for example, the causal impact of medical interventions. In addition, causal relationships are used to adapt treatments to individual patients based on their specific situation.
Marketing is another area that benefits from Causal AI. For example, Causal AI helps measure the true impact of marketing campaigns by distinguishing between correlation and causation. It provides deeper insights into what drives customer decisions, enabling more targeted and effective marketing strategies. Similarly, fields such as economics, business, and supply chain management also rely on understanding causality.
In this article, we have explored how causal AI helps us move beyond simple correlations in data to uncover true cause-and-effect relationships. We have examined how Directed Acyclic Graphs, Structural Causal Models, and Bayesian Networks serve as causal modeling tools to represent and reason about complex systems.
Additionally, we have discussed how to apply causal AI to data, where Randomized Controlled Trials and Propensity Score Matching aid in causal effect estimation. When unmeasured confounding is suspected, Instrumental Variables help identify hidden influences.
Finally, we have outlined the steps for implementing causal AI in practice, with a particular emphasis on counterfactual reasoning and interventions as key tools in the refutation phase of causal analysis.
As causal AI continues to evolve, it will play an increasingly vital role not only in distinguishing between simple correlation and causation but also in leveraging causality for better decision-making.
If you want to learn more about causal AI and how it helps businesses make better decisions, check out our DataFramed episode on causal AI in business. You can also read our practica guide to Causal AI using the DoWhy Library to get a hands-on example.
Top DataCamp Courses
Track
Course
Course
blog
DataCamp Team
11 min
blog
Vinod Chugani
12 min
blog
Andrea Valenzuela
10 min
blog
Josep Ferrer
10 min
blog
Austin Chia
12 min
podcast