Course
Introduction to Tableau
6 hr
319.5K
Sigma BI is a cloud-native analytics and business intelligence (BI) platform that works directly with your cloud data warehouse. Unlike traditional tools, it doesn’t copy or move data.
Here’s how it works:
Let’s look at the key features of Sigma to understand what you can achieve with this:
Sigma gives you a familiar, spreadsheet-like interface to explore your data.
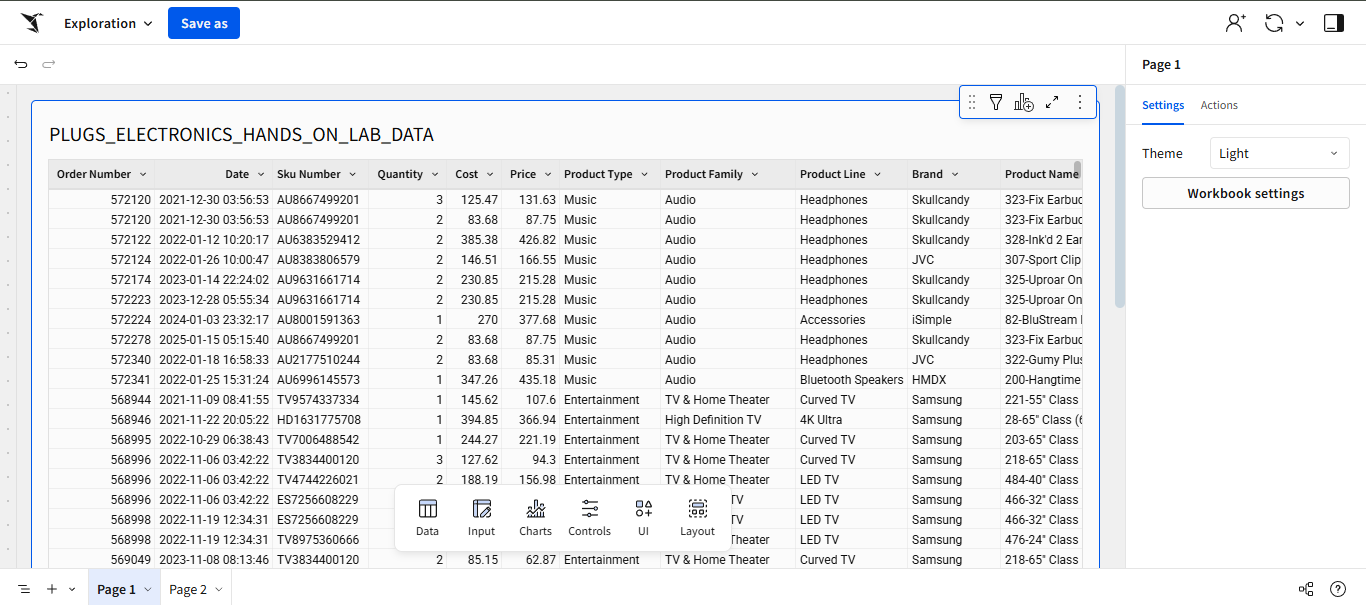
Sigma interface. Image by Author.
It feels like Excel, but it’s connected directly to your cloud data warehouse. You can build reports or explore metrics even without writing SQL. For more advanced analysis, you can even use custom SQL within Sigma.
You can also build interactive dashboards quickly.
All you have to do is drag and drop visualizations, schedule recurring reports, and set alerts so your team never misses important changes.
For example, if you’re tracking a product that’s trending daily, you can build a dashboard with a bar chart showing top-selling products by region. Schedule it to email your team each morning or set an alert if sales dip below a certain threshold.
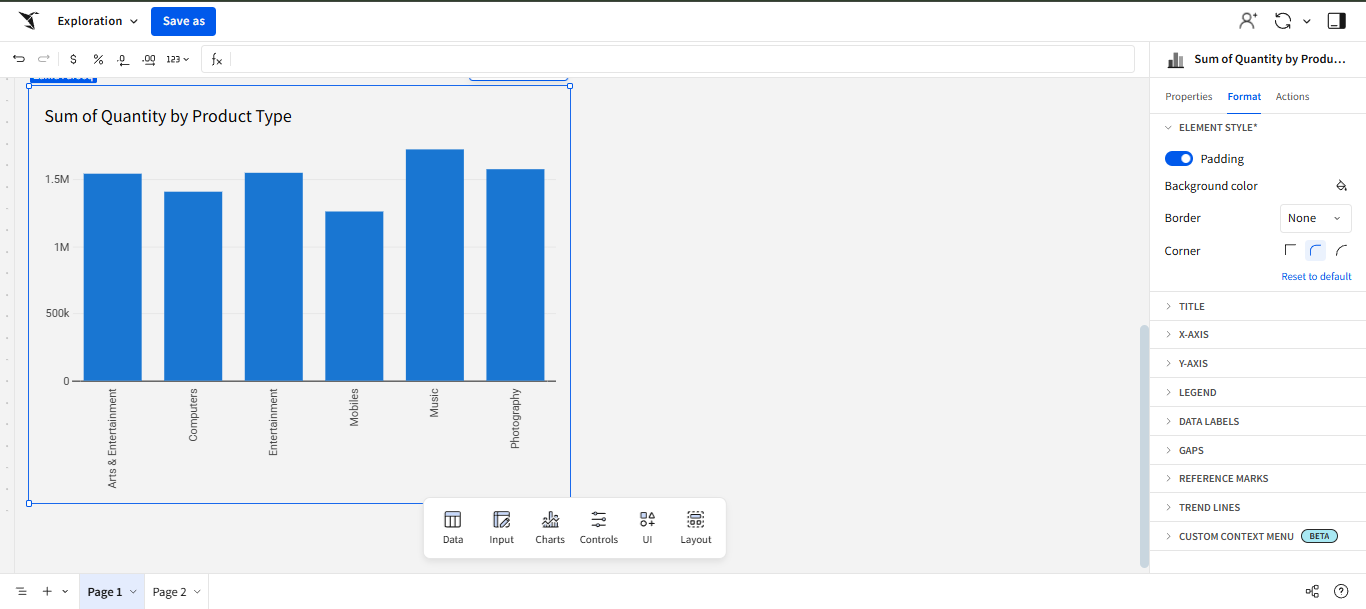
Bar chart in Sigma. Image by Author.
Sigma goes beyond static dashboards.
You can build interactive data apps with parameters and controls like sliders for “what if” scenarios and embed them into your internal tools.
For example, your sales team can adjust a discount slider by 5% and instantly see the impact on revenue, all without leaving your company’s portal.
Working on data together shouldn’t feel like passing around an Excel file.
With Sigma, multiple people can explore and edit the same dashboard or worksheet at the same time without overwriting each other’s changes.
You can filter by region, while a teammate can zoom in on product categories, all in the same session. If someone spots something worth sharing, they can drop a comment directly on a chart or table to flag it for the rest of the team.
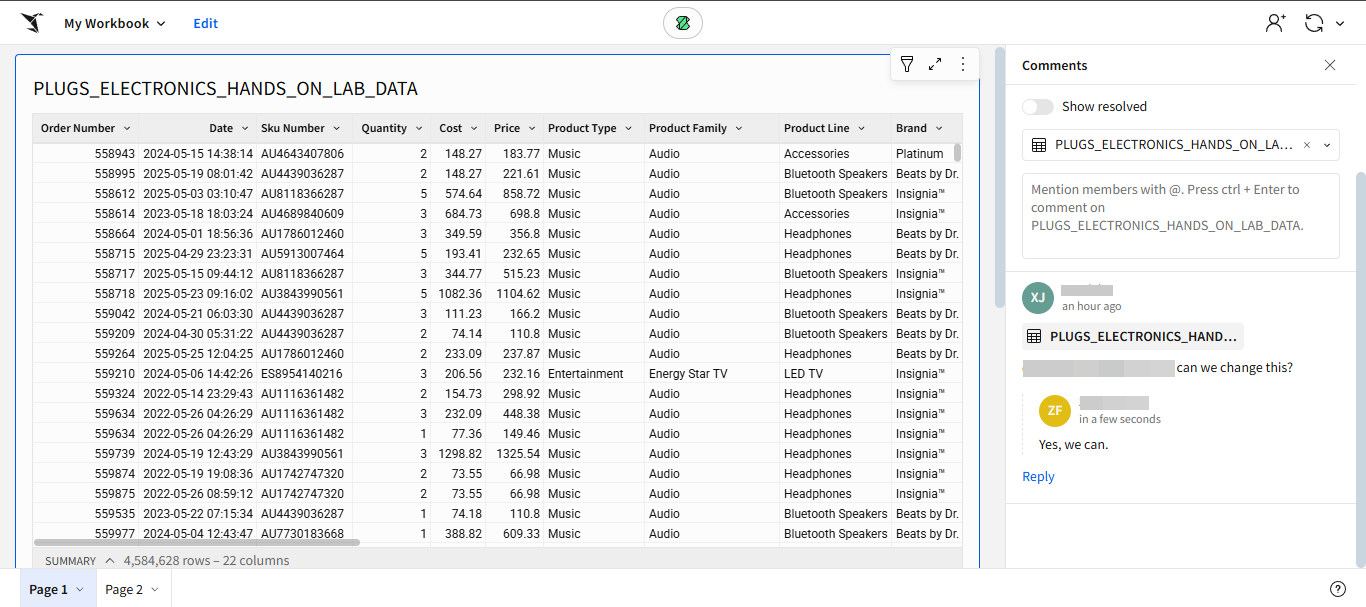
Comment added in Sigma. Image by Author.
Because everything runs on live data, you and your team members will see the same data at the same time. No more version conflicts, and no more asking, “Which report is the latest?”
Ask Sigma lets you query your data in plain language. You don’t need to know SQL to type a question.
For example, if you want to summarize data, prompt Sigma in simple English and it will summarize your text.
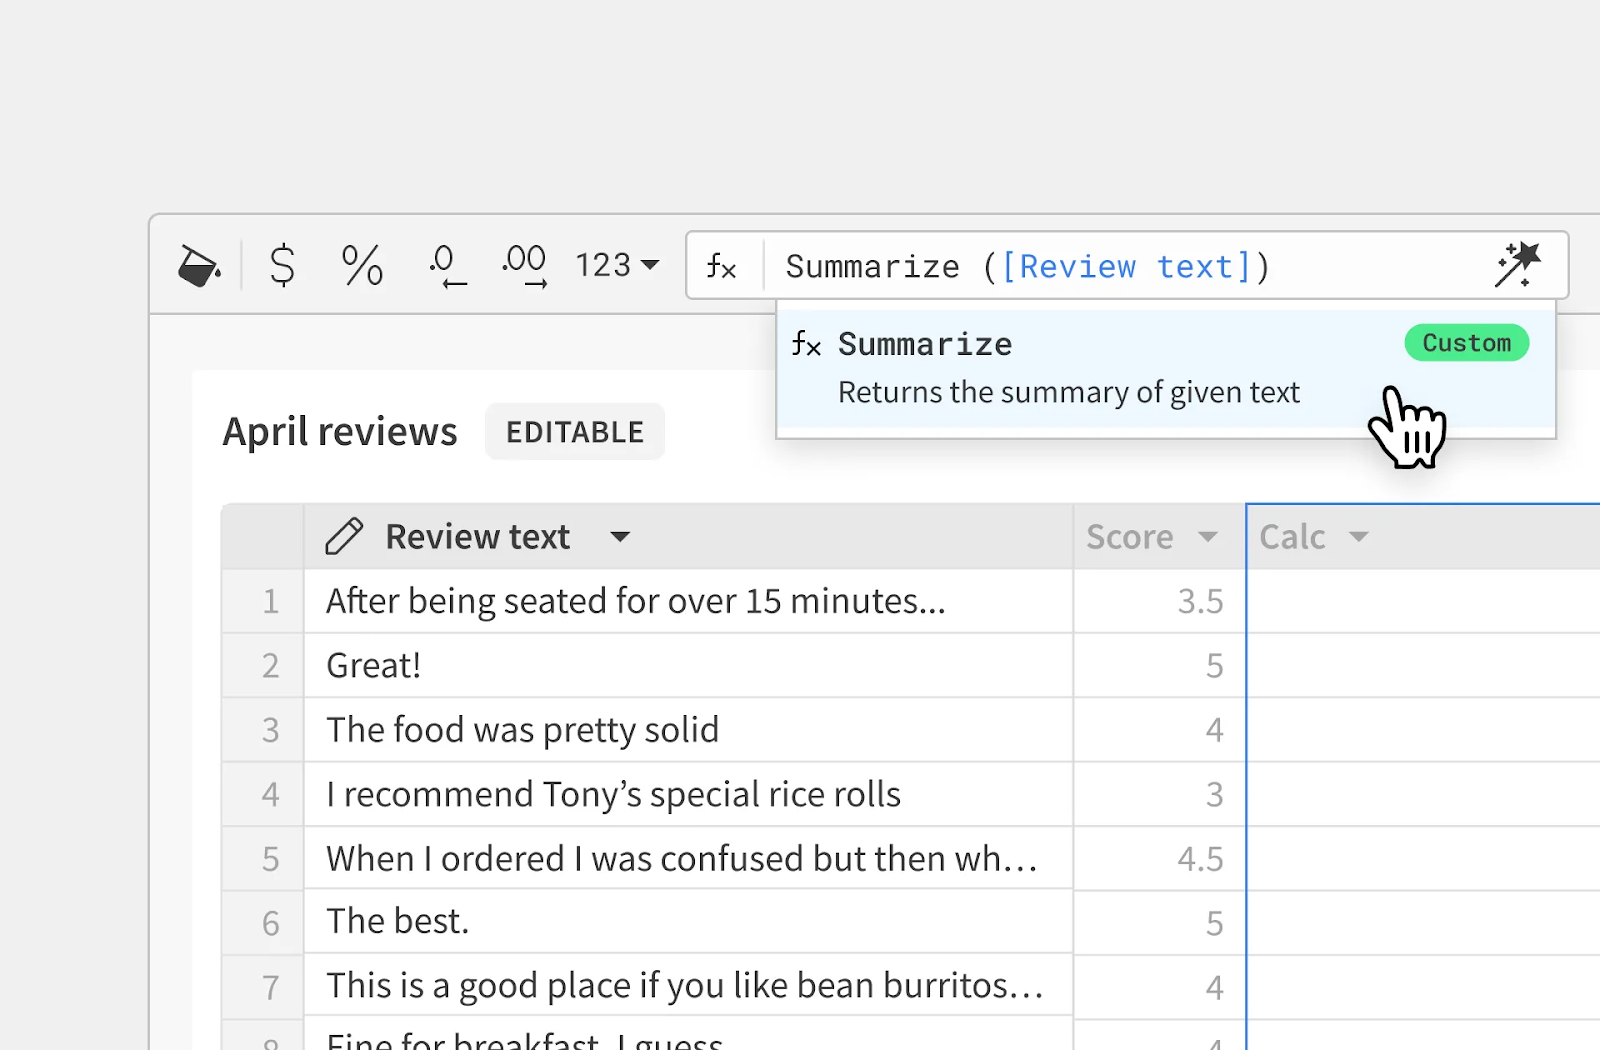
Use Sigma AI to summarize text. Image
It can also suggest related data and analysis paths to help you make better decisions.
Sigma doesn’t try to replace your data stack; it works with it. It connects directly to Snowflake, Databricks, BigQuery, Redshift, and other cloud platforms, so you can use live data without any issues.
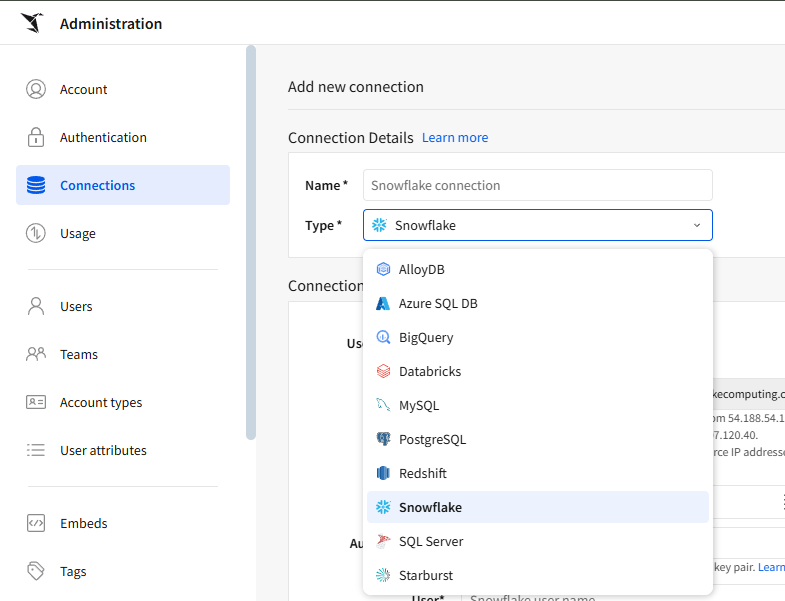
Sigma connects directly with other cloud tools. Image by Author.
If your data is spread across different systems, like your CRM and finance tools, Sigma can pull that together into one view, so you don’t have to flip between dashboards to see the whole picture.
And if your team needs a more custom solution, developers can use Sigma’s REST API. That makes it easy to embed dashboards into your own apps or automate repetitive reporting tasks.
Sigma lets anyone on your team explore data and share insights with little setup:
No one has to wait for a data request.
The data team still controls everything at the backend. They can set permissions, manage rules, and track where the data comes from so it stays accurate and secure.
For example, a retail team can check a live inventory dashboard to decide what to restock. And the data team makes sure they only see the products and stores they are supposed to. This way, everyone gets the information they need without slowing each other down.
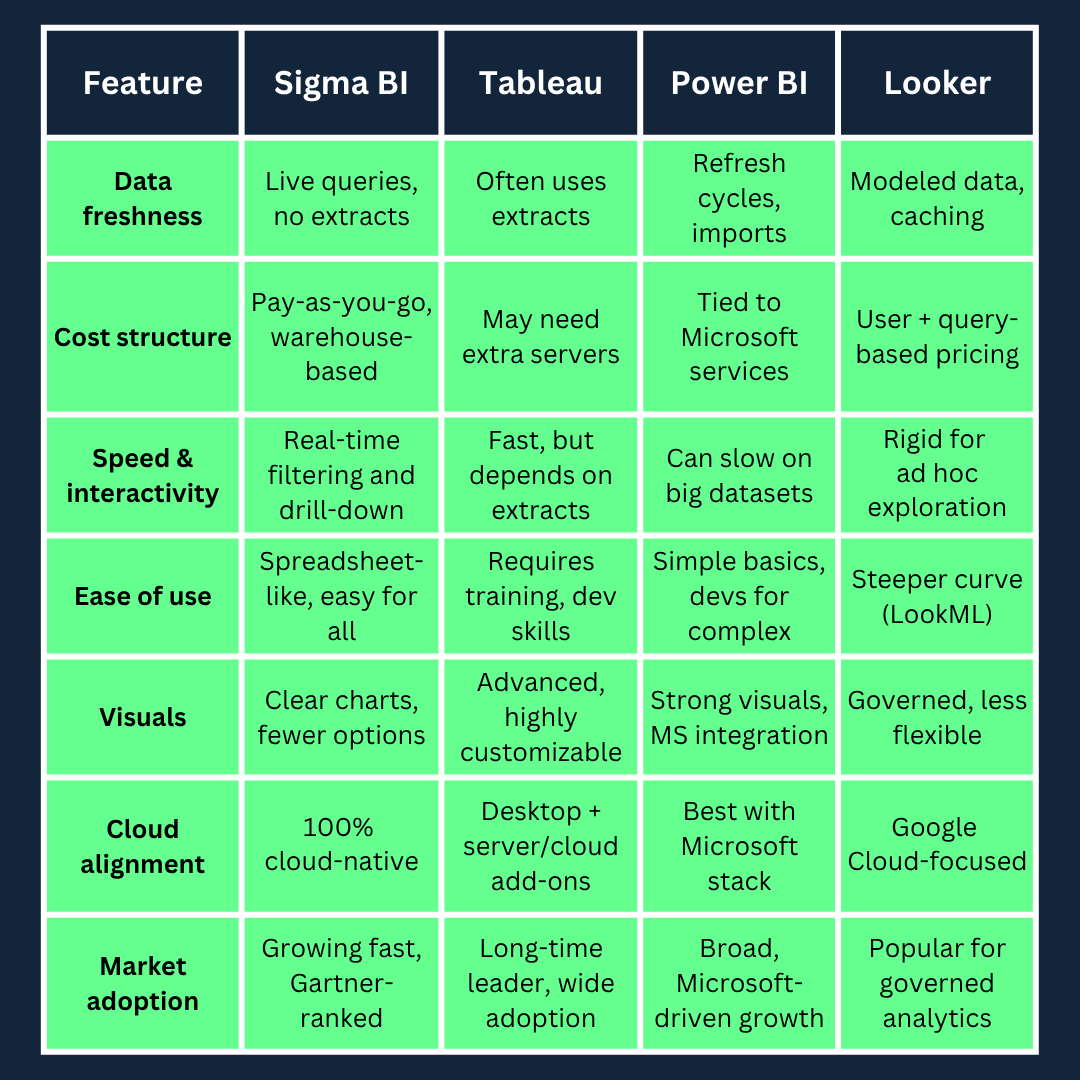
Sigma BI takes a different approach than tools like Tableau, Power BI, and Looker. Let’s see how it compares to the three most common BI platforms:
Sigma queries live data directly from your cloud warehouse. Dashboards are always up to date, with no need for extracts or scheduled refreshes.
Tableau, Power BI, and Looker often rely on data extracts or refresh cycles. That means you might be looking at snapshots, not the most current numbers.
Sigma runs on your existing data warehouse compute, so you only pay for what you use. This pay-as-you-go model is often cheaper for teams already working in a cloud setup.
Traditional BI tools can require separate servers, storage, or ETL pipelines. Power BI, for example, needs additional Microsoft infrastructure, while Tableau users have to pay for extra data engines to handle large datasets.
Sigma lets you filter and explore live data instantly. Everything runs in real time, even with large datasets.
Tools like Tableau and Power BI can feel slower because of refresh cycles or extract limits. Looker can also feel rigid if you want quick, ad hoc analysis without waiting on a developer.
Sigma has a spreadsheet-like interface that feels familiar. This makes it easier for non-technical users to explore data and create dashboards without heavy training.
Tableau and Power BI are helpful, but they need trained BI developers for complex reports. Looker, while strong on governance, requires users to learn LookML or rely on data teams to build models.
You can make clean, simple charts and dashboards in Sigma. But if you need highly customized or presentation-level dashboards, Tableau and Power BI still lead with their advanced visualization options. Looker offers consistent, governed visuals but is less flexible for creative layouts.
Sigma is gaining traction quickly. It’s recognized in the Gartner Magic Quadrant and is being adopted by more enterprises that are moving to cloud-first analytics.
Tableau, Power BI, and Looker all have larger, established user bases and ecosystems. But Sigma is positioned as a more modern, cloud-native alternative for teams that want speed and simplicity.
Here’s a quick summary of the comparison between Sigma and the other three business intelligence tools to help you understand their core differences:
Companies across industries are using Sigma to make data more accessible and usable. Let’s look at two real-world examples:
DoorDash gives its employees across departments direct access to live data with Sigma. They no longer wait on analysts to build reports.
Since adopting Sigma, they have increased queries by about 25–30% without raising Snowflake costs. They rolled it out to thousands of users and rebuilt over 5,000 dashboards.
Veronica Beard, a growing fashion brand, combined online and in-store data in Sigma to target its best customers.
Here are some noticeable results:
Sigma’s pricing is simple. You only pay for the people who build reports or run deep analysis. Viewers who look at dashboards can use Sigma for free, which reduces costs as you scale.
It also follows a pay-for-what-you-use model. This means you only pay for the computing power your queries need, which works well if your data is already in the cloud.
Because Sigma runs in the cloud, there’s no need to manage servers or install upgrades. It scales with your business without extra overhead.
Sigma is adding new features to help teams get more from their data.
It’s working on tools to analyze unstructured data, like documents and images, so you can pull insights from more than just tables.
Sigma is also improving how it works with semantic layers, like Snowflake’s, so data stays consistent and easy to govern across your company.
AI will be a bigger part of Sigma, too.
Unlike typical AI tools, every answer in Ask Sigma shows exactly where the data came from and how it was calculated, so teams can trust the insights and make confident decisions without waiting for help from experts.
Sigma BI gives your team live access to cloud data, a simple spreadsheet interface, and tools to explore insights at scale. It’s built for speed, collaboration, and governance without the complexity of traditional BI.
If you want to see how Sigma can fit into your reporting and analytics workflow, start with a free trial or request a demo. You can also check out our Introduction to Sigma course to learn the basics. Finally, if you are trying to bring a BI tool into your organization and your thinking about Sigma, connect with DataCamp for Business, and our expert team can help your team and your company with data and AI transformation.
Learn with DataCamp
Course
Course
Course
blog
Kenneth Leung
6 min
blog
Wendy Gittleson
15 min
cheat-sheet
Joyce Chiu
Tutorial
Don Kaluarachchi
Tutorial
Parul Pandey
Tutorial
Laiba Siddiqui