Track
Data Analyst in Power BI
50 hr
Whether you're diving into data analysis for the first time or looking to sharpen your analytics toolkit, learning Power BI is a smart move. In 2026, Power BI continues to be one of the most popular and powerful data visualization tools on the market, known for turning raw data into meaningful insights.
In this article, we'll share all the steps you'll need to take to learn Power BI from scratch, as well as answer some common questions you might have. If you’re eager to get started with hands-on practice, check out our Power BI Fundamentals skill track to master the essential skills.
If you're short on time, here's a quick summary of the steps to learn Power BI from scratch:
Now, let's dive into each step in more detail.
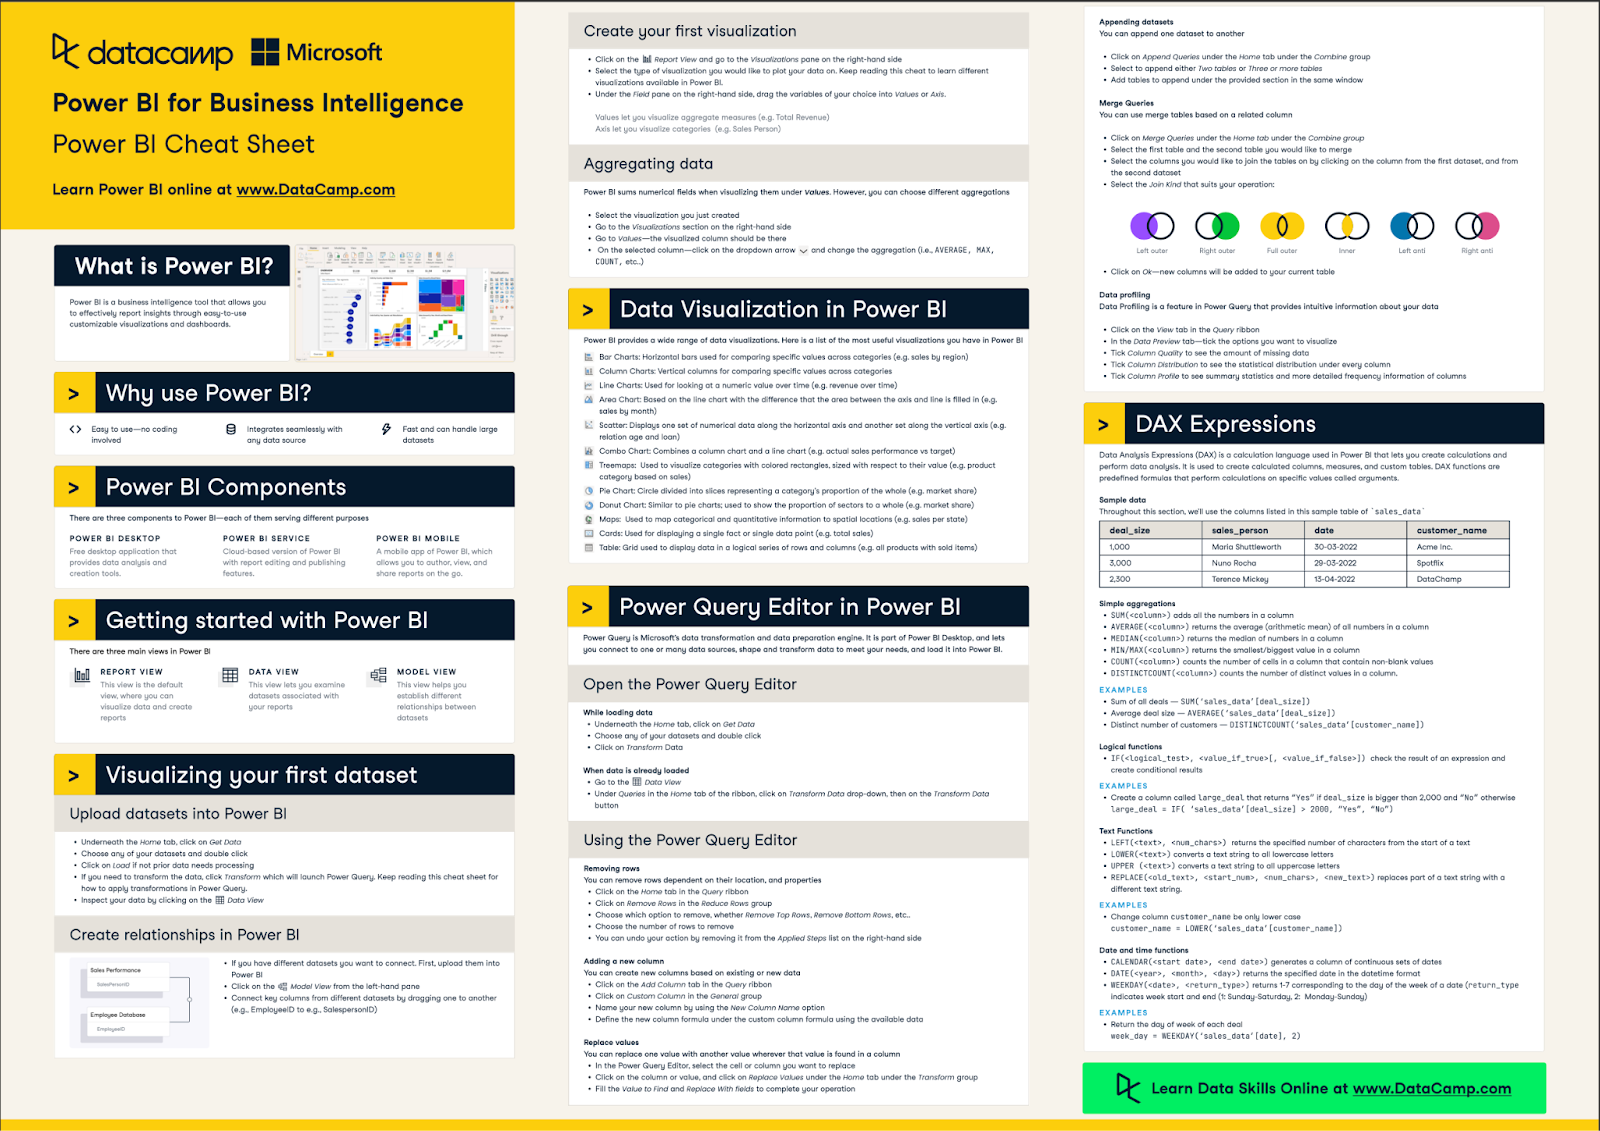
Power BI is a powerful data analytics and visualization tool that enables users to connect, transform, and visualize their data.
For a quick summary of Power BI, have a look at our Power BI Cheat Sheet below.
Learning it for the first time can be confusing, so you should consider following these 6 steps for the best chance of success:
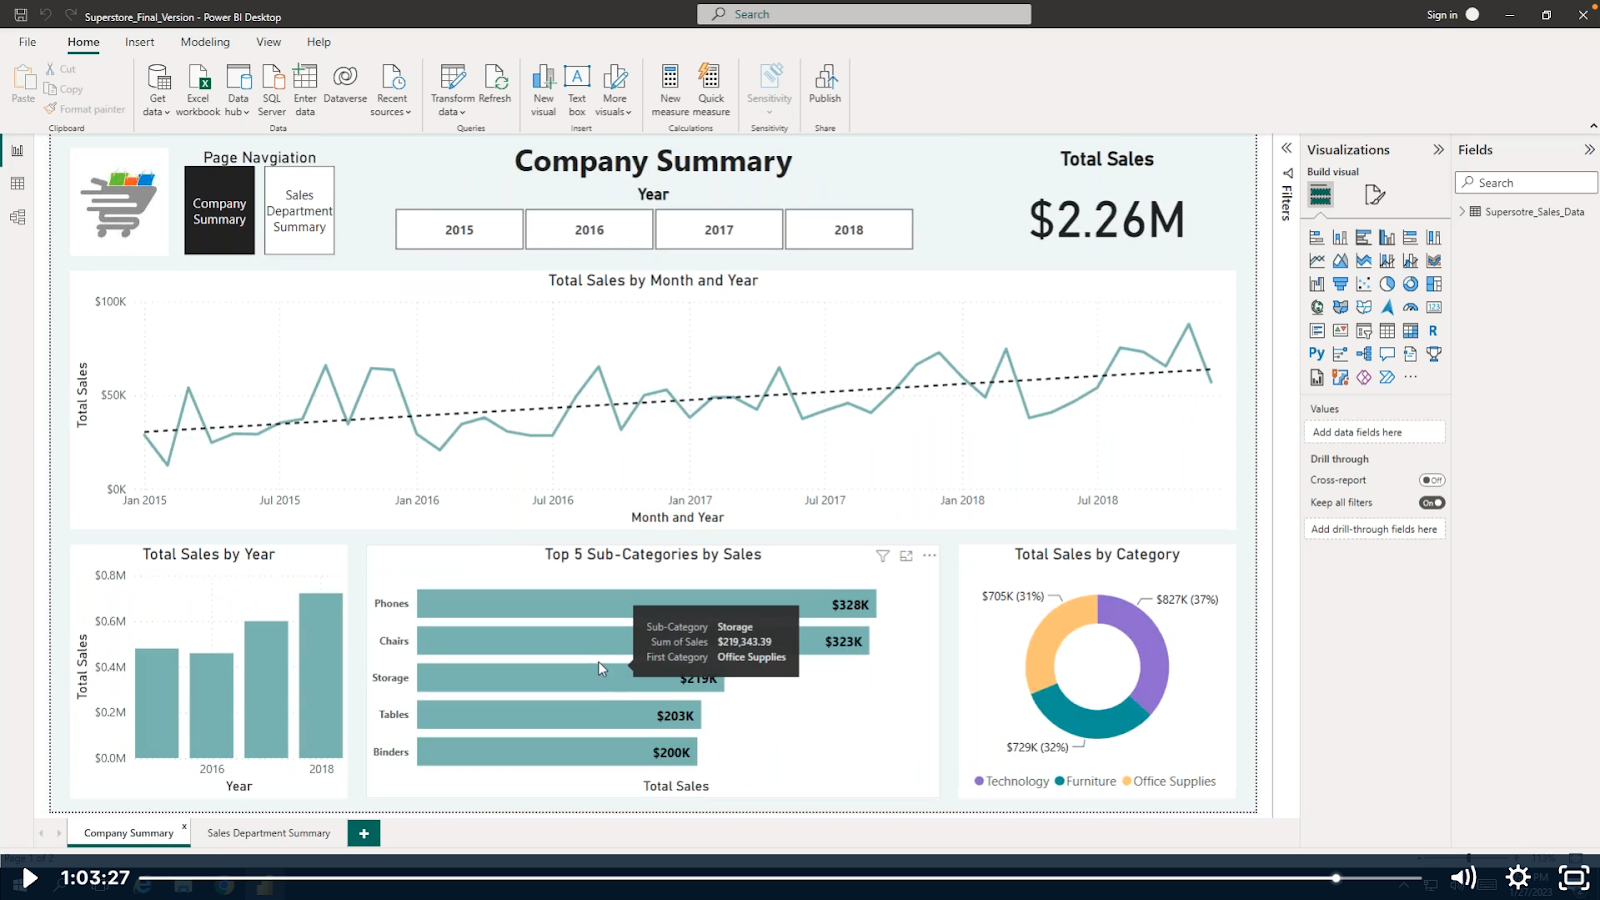
Before diving into creating reports and visualizations, it's important to get familiar with the Power BI interface and its terminology. This includes understanding the navigation pane, ribbon menu, fields pane, visualizations pane, and more.
Additionally, learning key terms such as datasets, queries, filters, and measures will help you navigate the interface more efficiently.
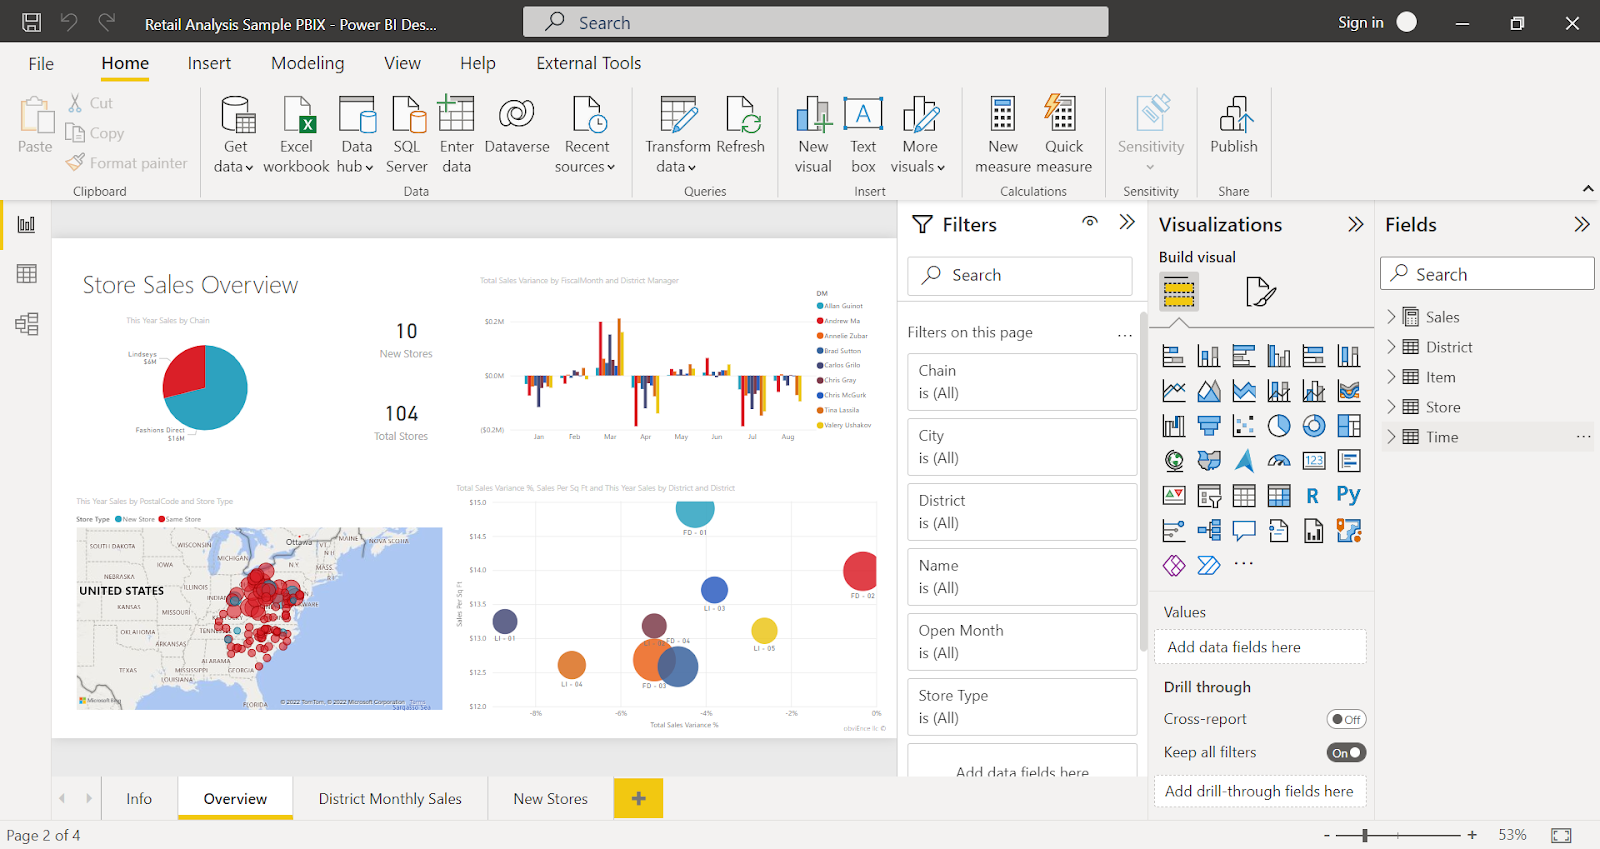
The Power BI Desktop Interface - Source
Power BI allows you to connect to a variety of data sources, including Excel spreadsheets, databases, online services, and files. Understanding how to connect to these different data sources is crucial in creating accurate and comprehensive reports.
Moreover, learning how to transform and clean your data before importing it into Power BI is essential for optimal visualization results. You can learn more in our Data Connections in Power BI course.
Once you have connected your data sources and transformed your data, it's time to create visualizations. Power BI offers a wide range of customizable charts, graphs, and maps that can effectively display your data. Learning how to create these visualizations is key to effectively communicating your insights.
To start, you can use the "Visualizations" pane on the right side of the Power BI interface to choose which type of visualization you want to create. You can also use the search bar to find specific types of visualizations or select from a variety of pre-made templates.
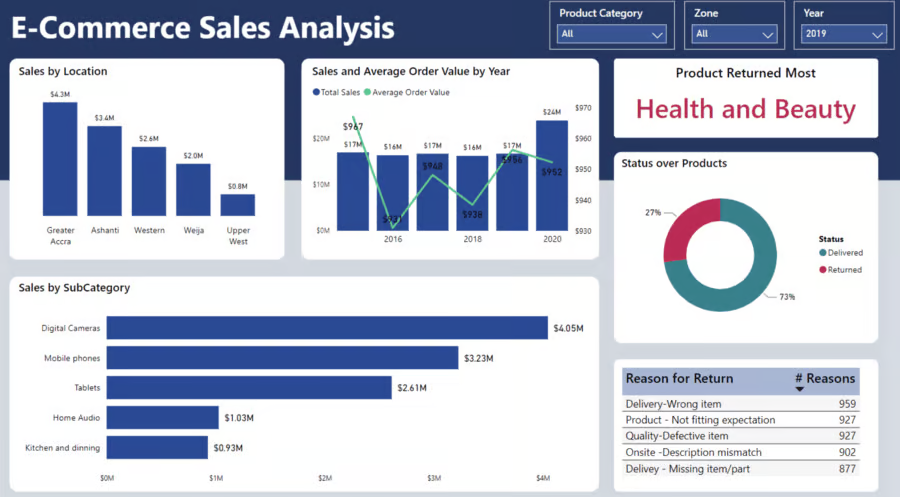
Source: Microsoft Fabric
Once you have selected a visualization, you can further customize it by adding data fields and formatting options. This allows you to manipulate the appearance and behavior of your visualizations according to your preferences and needs.
Creating visualization is, of course, not just a technical skill. You'll require a good understanding of design principles and best practices. Consider factors such as:
In addition to design principles, you should also try to understand the context in which your visualizations will be used.
This includes understanding the audience who will be viewing them, as well as any limitations or constraints imposed by the platform or medium in which they will be presented. You can understand this process in more detail with our Data Visualization in Power BI course.
DAX (Data Analysis Expressions) is the language used to create formulas and calculations in Power BI. It is a powerful tool for manipulating, analyzing, and visualizing data.
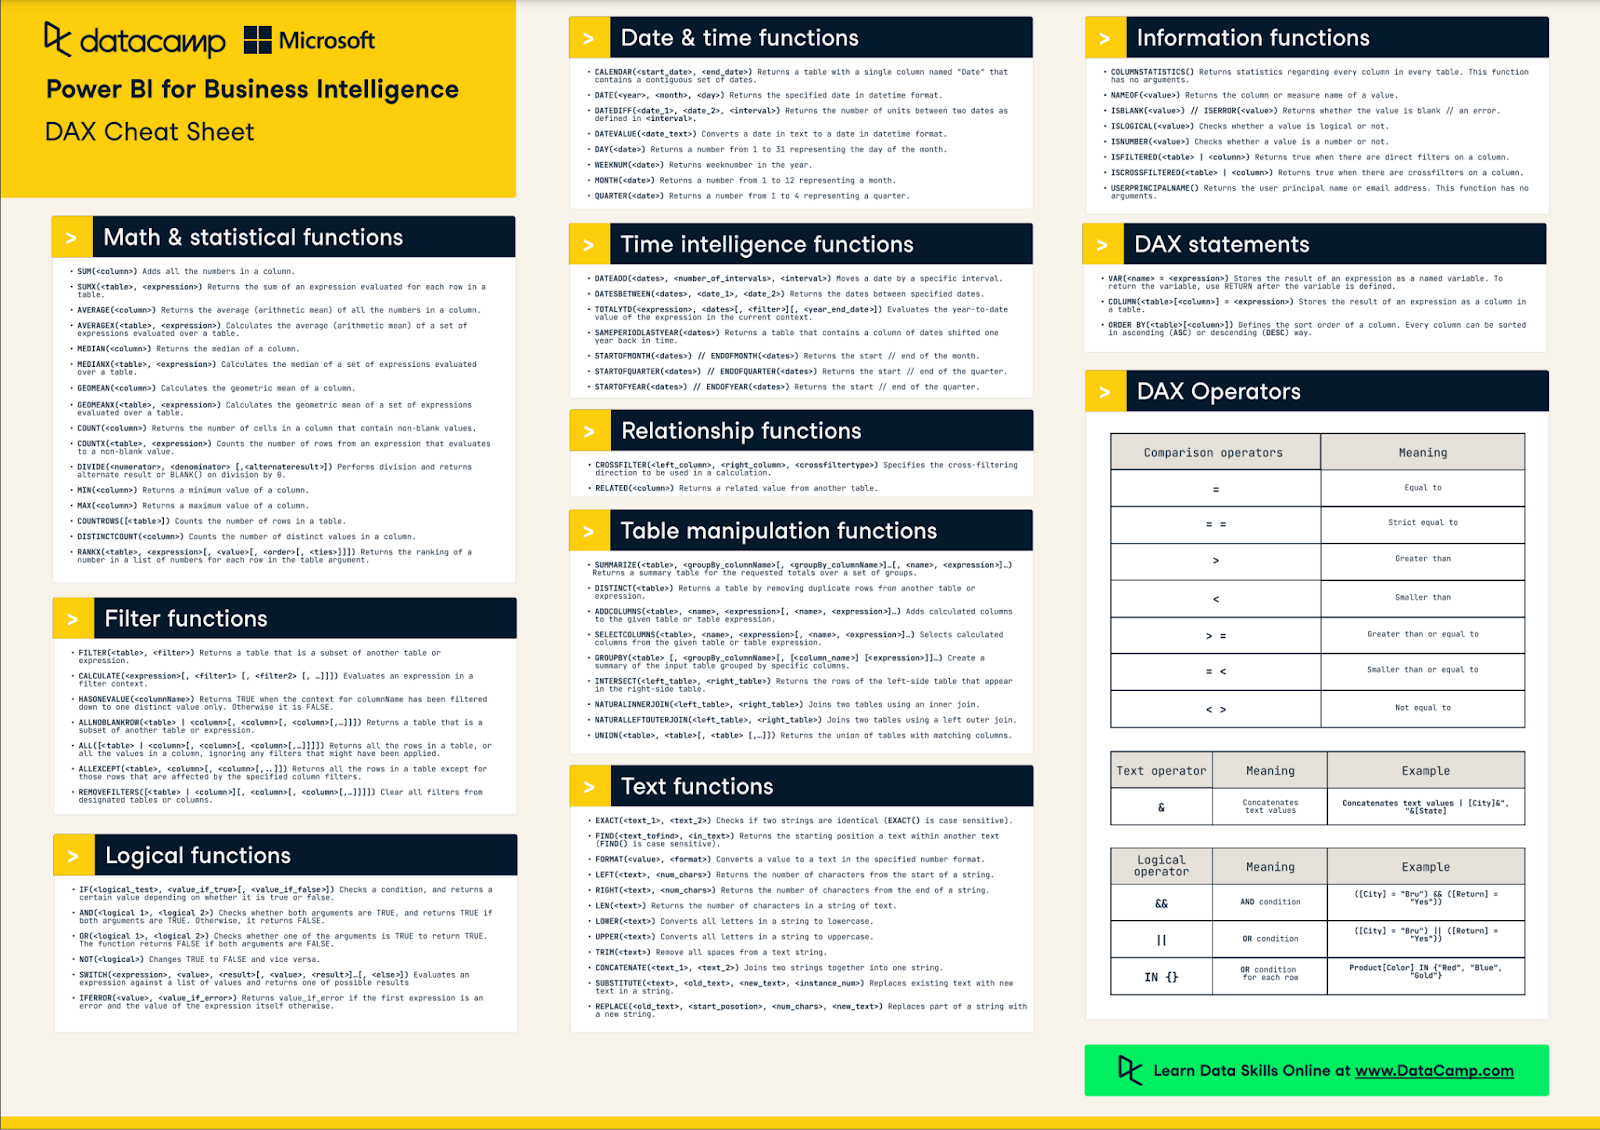
Source: DataCamp DAX Cheat Sheet
Some key concepts to understand about DAX formulas include:
DAX enables your charts to be more flexible when helping stakeholders get the unique insight they require. It allows you to create more customized formulas compared to traditional Excel functions, giving you greater control and flexibility in your data analysis. For some beginner practice, follow this beginner Power BI tutorial on DAX.
You can also explore more about DAX and get some hands-on examples in the DAX Functions in Power BI course.
Once you have a good understanding of DAX functions and how to use them, it's time to put your knowledge into practice by building reports. This will not only help you solidify your skills but also allow you to showcase your data analysis abilities.
At this stage, you should be comfortable enough to work with large datasets and apply various DAX functions to manipulate and analyze the data.
For starters, you can begin with identifying a business problem or question that you want to answer using your data. This will give you a goal to work towards and guide your report-building process.
You can explore free datasets from DataCamp's DataLab to work on creating simple reports.
If you’re keen on exploring further, I would recommend building this up to a unique Power BI project. For more specific training on Power BI reports, the Reports in Power BI course will be a good place to start.
In addition to practicing with datasets and building reports, you can also expand your skills through online tutorials. There are numerous resources available that offer step-by-step guides on creating advanced reports and dashboards using tools such as Microsoft Power BI, Tableau, and Google Data Studio.
These tutorials often include hands-on exercises to help you apply what you have learned.
Some good resources for learning about report-building include:
Now, you might be wondering why learning Power BI is so beneficial. Well, there are several reasons.
Here are some that stand out:
The BI tools market is rapidly growing, with competitors now boasting about their AI features. With fierce competition from startups, what makes learning Power BI so special?
That’s because Power BI is growing in popularity, with the demand showing in competitive Power BI Developer salaries across the globe.
Power BI is also leading the charge in AI through Power BI Copilot in Microsoft Fabric.
Power BI is also versatile and applicable in various industries. It can be used for data visualization, reporting, and analytics across different sectors, such as finance, marketing, and healthcare.
This makes it a valuable skill to have in your toolkit, regardless of the industry you work in.
It takes about 1-2 months to become proficient in Power BI, but the actual time may vary depending on an individual's prior knowledge and learning pace.
This timeframe includes learning the basics of data sources, creating visualizations, understanding DAX formulas, and building reports. However, mastering advanced skills such as data modeling and complex calculations may take longer.
Here are some factors that may influence the time it takes to learn Power BI:
Do take note that everyone learns at their own pace, so it's okay if you're taking more time to learn. The time it takes for one person to become proficient in Power BI varies from one to another. Some individuals may grasp the concepts quicker, while others may need more time and practice.
To help you manage your learning progress better, here are some suggested milestones that you can use:
Thinking of self-learning Power BI?
Here are some top learning resources we recommend:
DataCamp has a wide variety of webinars on various topics, including Power BI.
For beginners just starting out, I recommend the webinar “Dashboard Design in Power BI” by Iason Prassides. This webinar provides a good, practical, hands-on session on how to design dashboards well.
Some other webinars to check out include:
For a comprehensive walkthrough of the Power BI skill and its related features, your best bet would be DataCamp courses.
For starters, those who are new to Power BI can work on these courses:
As with all DataCamp courses, our platform offers a hands-on learning experience with exercises to hone your skills.
If you’re here reading this blog, chances are you prefer learning through reading written content.
Here at DataCamp, we cover common topics within Power BI that cater to beginners, such as data visualization techniques, creating and managing dashboards, and using DAX functions.
Our blog, with its step-by-step guides and visual aids, is a great resource for learning Power BI at your own pace.
Some blog articles that might be relevant to you are:
Power BI is a powerful tool that allows users to analyze, visualize, and share data in an interactive and effective way. However, learning Power BI can seem intimidating at first, especially for those who have no prior knowledge or experience in using data analysis tools. However, with the right resources and approach, anyone can learn Power BI easily.
In fact, Power BI is really accessible to users due to its:
You should learn Power BI first due to its similarities to Excel and how you can transition easily to creating charts quickly. Once you are familiar with Power BI, move on to Tableau to learn more advanced data visualization techniques. Overall, Power BI is a good option to learn first for its Microsoft Ecosystem benefits and ease of use.
If you’re still having a hard time picking one, let’s look at some factors to compare them.
If you want a more comprehensive comparison, be sure to read our guide on Power BI vs Tableau.
Thinking of diving right into your learning? Let’s review some tips that will help you along the way:
Power BI can be used to advance your career in a number of applications.
Here are some examples:
As these are common skills needed within the data analytics field, Power BI can prove to be a good tool to learn.
Here are some roles that frequently require Power BI expertise:
In addition to these specific roles, there are many other professionals who can benefit from using Power BI. This includes project managers, human resource analysts, supply chain analysts, and more.
The adoption of Power BI is on the rise, with 97% of Fortune 500 companies using Power BI in 2025. Companies are looking for professionals who can work well with it. With the recent push in Microsoft products like Azure and Fabric, Power BI has become the go-to platform for data analytics and visualization.
In this section, we'll take a look at the top career paths that are likely to be in demand for Power BI professionals in 2025.
These are the roles that will require a deeper understanding of Power BI and its capabilities, making them the most sought-after positions in the industry.
The role of a Business Intelligence (BI) Developer is to design, develop, and maintain the data infrastructure and reporting solutions that enable organizations to make informed business decisions.
With the increasing adoption of Power BI, there will be a high demand for professionals who can leverage its features.
To excel in this role, you must have a strong understanding of data warehousing concepts, SQL querying skills, and experience with ETL tools like Microsoft SSIS or Azure Data Factory. Additionally, knowledge of programming languages such as R or Python can also be beneficial.
Data analysts/scientists are responsible for analyzing and interpreting large sets of data to identify trends, create insights, and make data-driven decisions. They are in high demand across various industries, such as healthcare, finance, marketing, and retail.
To excel in this role, you must have a strong background in statistics and mathematics, as well as programming skills in languages like R or Python. Tableau or Power BI is also important for effectively communicating findings to stakeholders.
Business intelligence analysts work closely with both technical and non-technical teams to gather business requirements and develop solutions for managing and analyzing data.
To become a business intelligence analyst, you’ll need a strong foundation in data analysis and visualization. This can be achieved through education in fields such as computer science, statistics, or business analytics.
Some of the key responsibilities of a business intelligence analyst include:
The demand for skilled business intelligence analysts with Power BI expertise is on the rise as companies across various industries recognize the value and impact of data-driven decision-making.
Industries actively hiring for Power BI expertise include:
Power BI is increasingly becoming an essential tool for businesses to analyze and utilize their data. As such, the demand for skilled Power BI professionals is only expected to continue rising in the future. If you are interested in pursuing a career in business intelligence or looking to enhance your skills, learning Power BI can be a valuable asset.
Keen to learn about Power BI through a systematic learning environment? Our Power BI Fundamentals skill track is the choice for you. For those who prefer a tutorial, this Power BI Tutorial for Beginners guide will help.
Top Power BI Courses
Track
Track
Course
blog
Joleen Bothma
12 min
blog
Wendy Gittleson
12 min
blog
Joleen Bothma
9 min
Tutorial
DataCamp Team
Tutorial
Joleen Bothma
Tutorial
DataCamp Team