Last chance! 50% off DataCamp Premium
Sale ends in
The F statistic helps you check if differences in data are meaningful or just random variation. It compares the variation explained by a model or grouping to the variation that remains unexplained.
You will see the F-statistic in common statistical methods like ANOVA and regression analysis. In both cases, it answers a basic question: Does the model explain the data better than chance?
In this guide, we will walk you through what the F statistic measures, how it is calculated, where it appears in ANOVA and regression, and how to interpret the results correctly.
The F statistic measures whether the variation explained by a model is larger than the variation caused by random noise. It compares two sources of variance: one represents the signal and the other represents the noise.
Mathematically, the F statistic is a ratio of mean squares (variances):

In many statistical tests, this is written as

The F statistic compares these two quantities.
If the between-group variance is much larger, the F value becomes large. This suggests that the differences between groups are meaningful. If the within-group variance dominates, the F value becomes small. This suggests that the observed differences are likely random.
You may see the F statistic in the following statistical methods:
The F statistic is calculated as a ratio of two mean squares. A mean square represents a variance estimate. It shows how much variation exists in a specific part of the data.
The generic formula looks like this: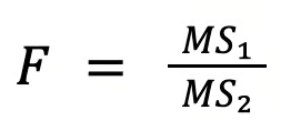
Here:
If the explained variation is much larger than the unexplained variation, the F value becomes large. That means the model or grouping explains meaningful differences.
Although the interpretation depends on the analysis you are running, the F statistic is most commonly used in ANOVA and regression analysis.
Let’s walk through a simple example to make this clearer.
Imagine you are comparing conversion rates across three marketing campaigns. After calculating the sums of squares and dividing by the degrees of freedom, you get:
Now calculate the F statistic: F = 20 / 5 = 4
So, the F value is 4.
This means the variation between the campaign averages is four times larger than the variation within each campaign. In other words, the differences between campaigns are relatively large compared to the random variation within them.
The F statistic follows an F distribution when the null hypothesis is true.
This distribution shows how large the F value can get just from random variation. We use it to check whether the observed F value is unusually large.
The reason comes from how the F statistic is built.
Each part of the F ratio is a measure of variance. One captures variation explained by the model or groups, and the other captures random variation. When the null hypothesis is true, both come from the same underlying variance.
Simply put, the F statistic compares two independent estimates of the same variance. When that is the case, their ratio follows the F distribution.
The F distribution is defined by two degrees of freedom parameters. These control the exact shape of the distribution.
In practice, these values depend on the statistical method being used.
For example:
In ANOVA:
In regression:
These degrees of freedom determine how variable the variance estimates are. Smaller degrees of freedom lead to greater variability, which changes the shape of the distribution.
The F distribution is right-skewed. Most values appear near zero, while larger values extend into the right tail. This happens because variance estimates cannot be negative. The ratio of two variance estimates, therefore, produces only positive values.
The degrees of freedom affect the exact shape of the distribution:
When the observed F statistic falls far into the right tail of the distribution, it indicates that the explained variation is much larger than the unexplained variation. This provides evidence against the null hypothesis.
In analysis of variance (ANOVA), the F statistic tests whether multiple group means are equal.
For a one-way ANOVA, the null hypothesis states that all group means are equal. The alternative states that at least one group mean differs.
The test compares variation between groups with variation within groups. If differences between group averages are much larger than the variation inside the groups, the F value becomes large.
ANOVA splits total variation into two parts:
These are then converted into mean squares by dividing by their degrees of freedom:
The F statistic is then calculated as the ratio of these two mean squares.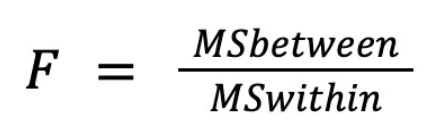
The F value shows how much group differences stand out compared to random variation. You can interpret it as follows:
ANOVA relies on a few assumptions:
In regression analysis, the F statistic tests whether the model explains the data better than a model with no predictors.
The comparison model includes only an intercept and predicts the average value of the outcome. This is known as the F test of overall significance. The hypotheses are:
The F statistic compares the variation explained by the model with the variation that remains unexplained.
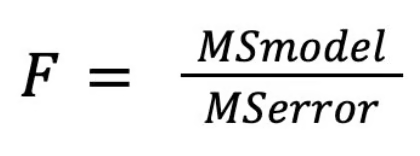
If the explained variation is much larger than the unexplained variation, the F value becomes large. This indicates that the model captures meaningful patterns in the data.
The F statistic is closely related to R², which measures how much variation in the outcome variable is explained by the model.
As the model explains more variation, R² increases. This also tends to increase the F statistic because the explained variation becomes larger relative to the unexplained variation.
However, the two measures serve different purposes:
In multiple regression, the F test evaluates the overall significance of the model. The null hypothesis states that all regression coefficients are equal to zero:

If the F statistic is large enough, the null hypothesis is rejected. This means that at least one predictor has a nonzero effect on the outcome variable.
The F test evaluates the model as a whole. After that, individual predictors are examined using t tests.
To interpret an F test, follow these steps:
If the p-value is smaller than the chosen significance level, the result is considered statistically significant.
A statistically significant F test shows that the model explains variation beyond what random chance would produce.
A significant F result has limits:
Because of this, analysts often report additional measures to understand the strength of the effect.
Effect size statistics help quantify how much variation the model explains.
In ANOVA, a common measure is:
In regression, common measures include:
The F test works well when a few key assumptions are reasonably satisfied. If these assumptions are violated, the F statistic can produce misleading results.
The observations in the dataset should be independent of each other — one observation should not influence another.
For example, if multiple measurements come from the same person or the same experimental unit, independence may be violated. When observations are not independent, the F statistic can underestimate variability and produce unreliable results.
Many F tests assume that errors are approximately normally distributed. In simple terms, the differences between the observed values and the model predictions should follow a roughly normal pattern.
This assumption becomes less critical with larger samples. With enough data, the F test often works reasonably well even if the distribution is not perfectly normal.
Classic ANOVA assumes that variances across groups are similar. This condition is called homogeneity of variance.
If one group has much higher variability than the others, the F test may incorrectly detect differences between group means. The problem becomes more severe when group sizes are very different.
In many practical situations, the F test still performs reasonably well.
For example, ANOVA is fairly robust when group sizes are balanced, meaning each group contains a similar number of observations. In these cases, moderate violations of normality or equal variance often have limited impact.
However, problems increase when two conditions occur together such as:
This combination can distort the F statistic and increase the risk of incorrect conclusions.
If your data does not meet the assumptions of the F test, you can use alternative methods that handle these issues more effectively:
The F statistic is widely used, but a few points often confuse beginners. Most of these come from how it relates to other statistical tests.
The F statistic and t statistic are closely related. In simple cases, they test the same idea.
For example, when a regression model has only one predictor:
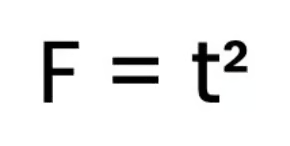
This means both tests lead to the same conclusion about statistical significance.
In more complex models, they serve different roles. The t test evaluates one coefficient at a time, while the F test evaluates multiple parameters together.
Another common point of confusion is the difference between model-level and variable-level significance.
Because of this, you can see results like:
This happens when several variables together explain the outcome, even if each one has a small individual effect.
A large F value often leads to statistical significance, but that does not always mean the result is important in practice.
With large sample sizes, even small differences can produce significant F values. The model may explain some variation, but the effect may be small in real terms.
That is why analysts also look at effect size measures such as R² or eta squared.
In ANOVA, the F statistic answers one question: are all group means equal?
If the result is significant, it shows that at least one group mean is different. It does not show which groups differ.
To identify the differences, analysts run post hoc tests that compare groups pair by pair.
Common examples include:
These tests pinpoint exactly where the differences exist after the overall F test shows significance.
You now understand how the F statistic works and how to interpret it in ANOVA and regression. Now apply this in practice.
Run simple ANOVA or regression analyses and focus on reading the F value, p-value, and effect size together. This would help you move from calculation to real interpretation.
If you want to build a stronger statistics foundation, go deeper into core concepts like variance, hypothesis testing, and regression modeling.
Learn with DataCamp
Course
Course
Course
Tutorial
Laiba Siddiqui
12 min
Tutorial
Elena Kosourova
8 min
Tutorial
Vinod Chugani
8 min
Tutorial
Arunn Thevapalan
10 min
Tutorial
Iheb Gafsi
5 min
Tutorial
Laiba Siddiqui
15 min