
Course
Exploratory Data Analysis in R
4 hr
117.7K
When interpreting data, choosing the right measure of central tendency can make or break your analysis. Among the most common metrics are the mean and median, which are two seemingly straightforward concepts that carry profound implications in data interpretation. While the mean gives us the arithmetic average, the median is the central point in a sorted set of values, such that half the observations lie on either side. But which one is more reliable? The answer often depends on your data's distribution, the presence of outliers, and the story you're trying to tell.
In this article, I will break down the differences between mean and median, their strengths and weaknesses, and how to choose the right one for different scenarios. I will also explore how skewed distributions and outliers affect these measures, providing practical examples and visuals to help you understand these fundamental concepts. We'll also dip a toe into more advanced ideas.
To fully understand the differences between the mean and the median, let us look at each of these measures and highlight their key properties.
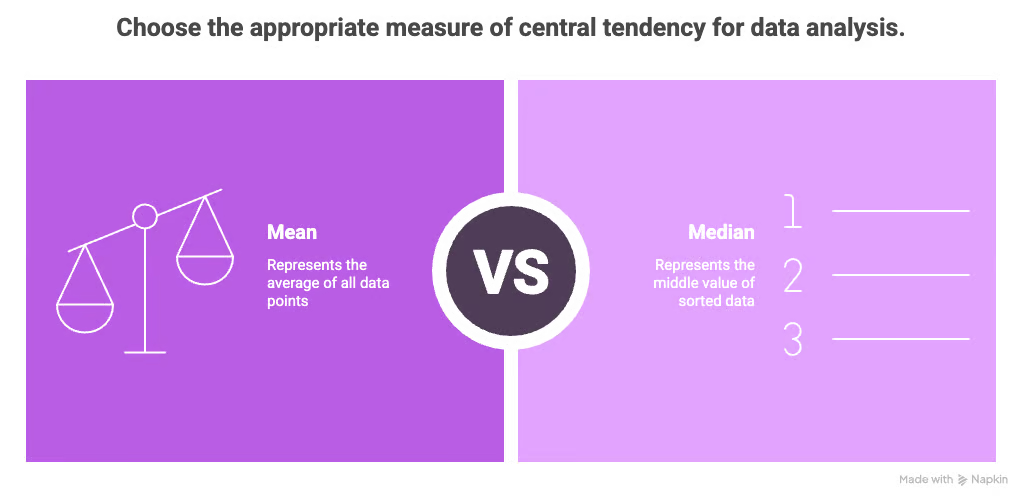
The mean can be viewed as the “balance point” (or center of mass) of the data. It considers all data points in a dataset and provides a single value that represents the average. More exactly, the mean is calculated by summing all the values in a dataset and then dividing by the number of values.
The median is the middle value when the data is sorted. Unlike the mean, it is more robust against outliers, providing a better measure of central tendency for skewed data.
The mode is another measure of central tendency, representing the most frequently occurring value in a dataset. Let's look at an example:
3, 3, 6, 8, 9Here, the mode is 3 because it appears twice, while all other values only appear once.
Reading a definition is one thing, but calculating is another. In this section, I will break down the steps for calculating each measure and highlight their computational differences.
The mean is the arithmetic average of a dataset and is calculated as follows:
Here is the process represented as a general equation:
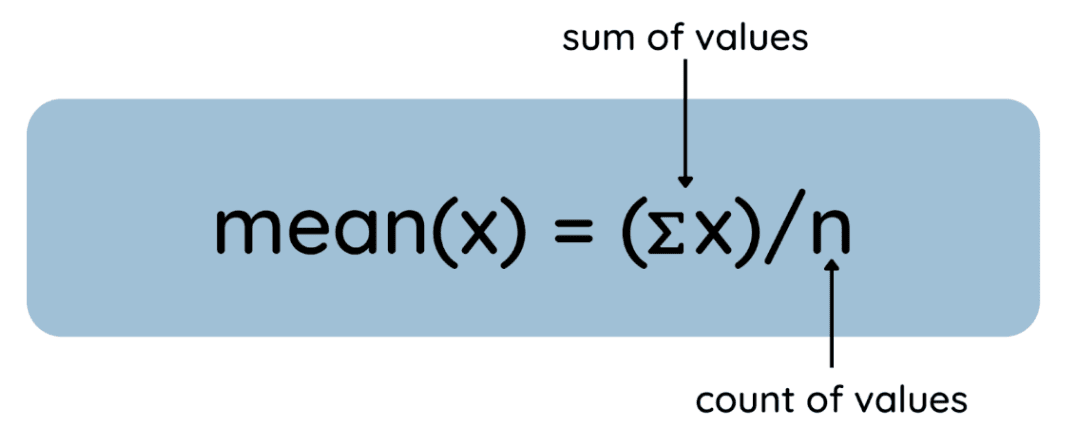
How to find the mean. Image by Author
For an example, consider a dataset of exam scores:
78, 85, 92, 88, 70The mean score is 82.6.
The median is the middle value of a dataset when arranged in ascending order. Here is how to find it:
And here are those steps represented as equations:
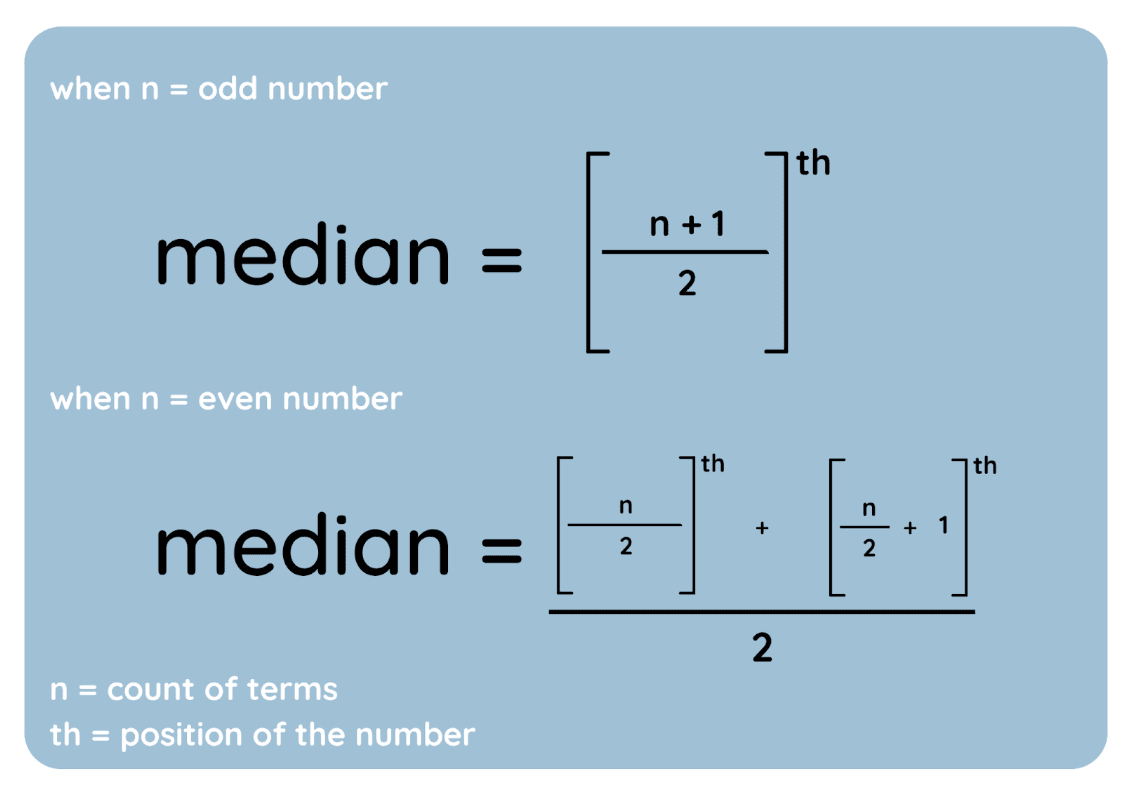
Median formula. Image by Author
I also created a visual to highlight the process.
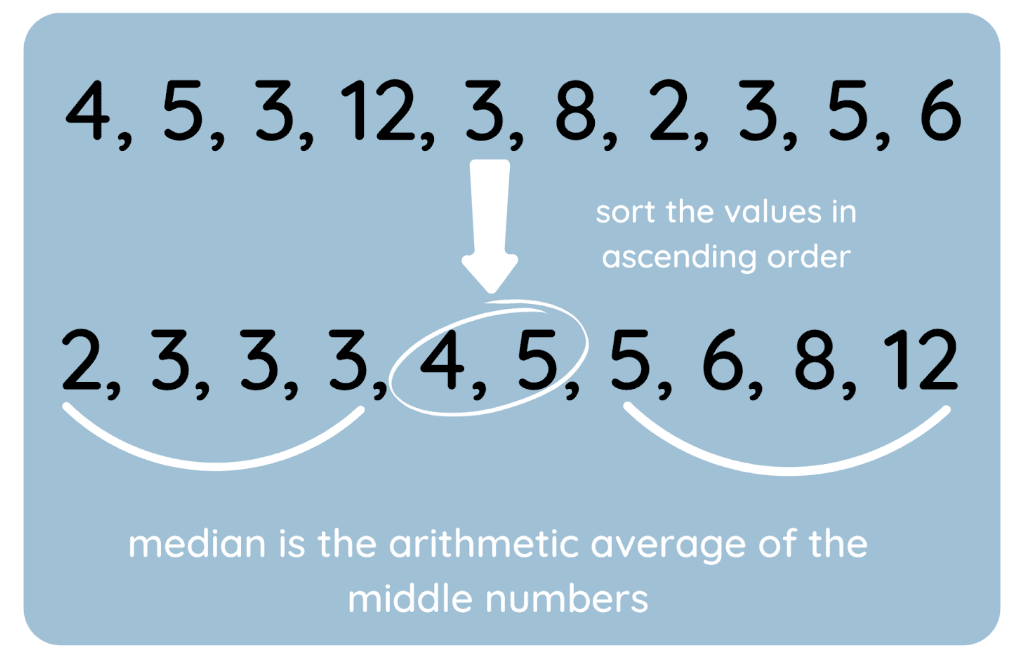
How to find the median. Image by Author
Here’s an example dataset with an odd number of values:
70, 78, 85, 88, 92The median is 85.
Here’s another example, but with an even number of values:
70, 78, 85, 88The median is 81.5.
While both the mean and median describe the center of a dataset, their behavior diverges significantly in the presence of outliers and skewed distributions. Understanding this difference is very important for accurately interpreting data and avoiding misleading conclusions.
Outliers are values that are significantly higher or lower than the rest of the data. They can heavily influence the mean but have little to no effect on the median.
Let’s consider a dataset of monthly incomes (in thousands):
3, 3.5, 4, 4.5, 5, 6, 50The mean income here is 10.85k, which is heavily skewed by the extreme value of 50k.
On the other hand, the median value is 4.5k, which is, I would argue, a much more typical representation of income for this group.
The mean and median also differ in their representation of data in skewed distributions (datasets that are not symmetrical).
For example, in right-skewed distributions (e.g., income or housing prices), most values are clustered at the lower end, with a few extreme values pulling the tail to the right.
Consider incomes:
30k, 35k, 40k, 45k, 50k, 100k, 200kOne thing you should take-away from this is that it’s important to always examine your data’s distribution before deciding whether to use the mean or median. Tools like histograms and box plots can help visualize skewness and identify outliers. We’ll cover these later on. Also, I want to say that examining the difference between the mean and median is one way of assessing skewness.
When analyzing data, deciding whether to use the mean or median depends on the characteristics of your dataset and the insights you are trying to extract. Below is a quick reference table to guide your choice:
| Use the Mean When | Use the Median When |
|---|---|
| The data distribution is approximately normal (symmetrical). | The data is highly skewed (e.g., income, property values). |
| Outliers are minimal or irrelevant to the analysis. | Outliers are present and could distort the results if included. |
| You need a measure that is sensitive to every data point, such as in predictive modeling or when calculating totals. | You want to reflect the “typical” value rather than the “mathematical center” of the dataset. |
Here’s a practical tip that will really help you: Always start with a visual analysis of your data (e.g., a histogram or box plot) to check for symmetry, skewness, and the presence of outliers. This will help you decide whether the mean or median is a better fit for your scenario.
Visualizations are powerful tools for understanding the behavior of the mean and median in different datasets. They can clearly demonstrate how these measures respond to outliers and skewed distributions, helping to inform better data-driven decisions.
Imagine a small dataset of incomes in thousands:
30, 35, 40, 45, 50, 55, 1000The following bar chart demonstrates how a single extreme value can drastically affect the mean, while leaving the median relatively stable. In this case, most data points cluster between 30 and 55, but the presence of an outlier (1000) pulls the mean upward.
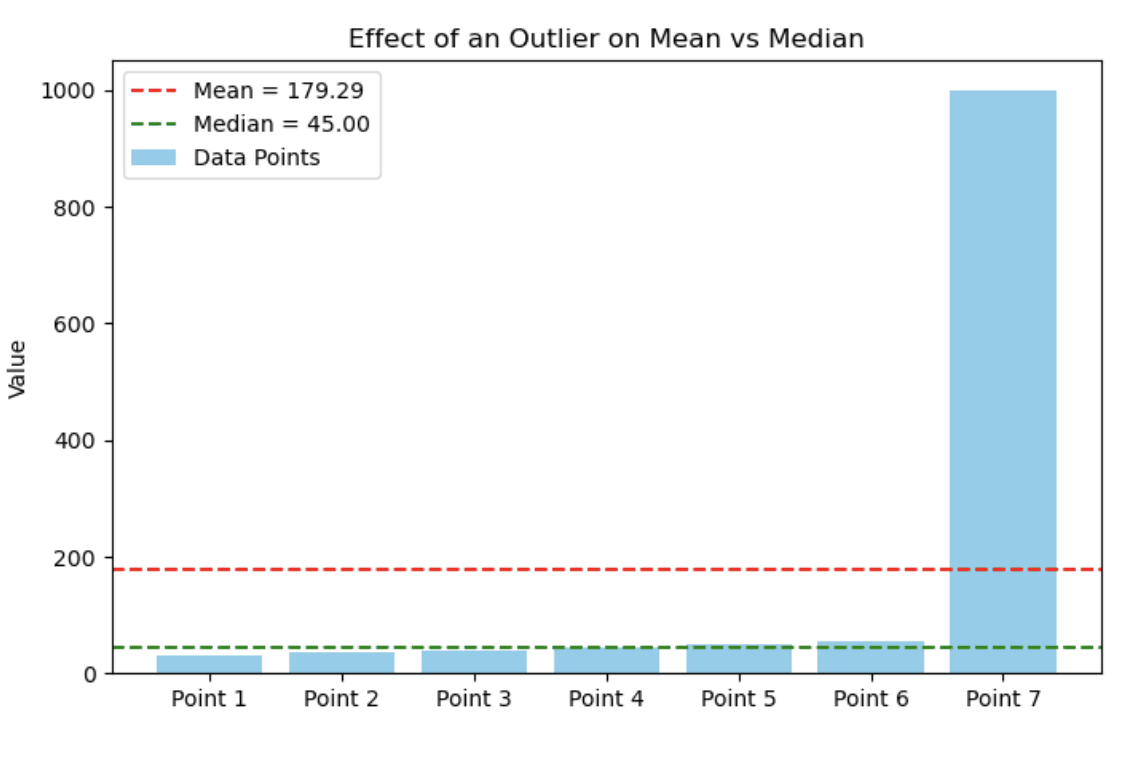
Bar chart showing effect of an outlier on mean vs. median. Image by Author
In a right-skewed distribution (such as incomes or housing prices), the mean is often pulled toward the long tail of high values, while the median remains closer to the “typical” data point. This makes the median a better measure of central tendency in such cases.
The histogram below shows a simulated income distribution where the mean (red dashed line) is significantly larger than the median (green dashed line) due to the skew.
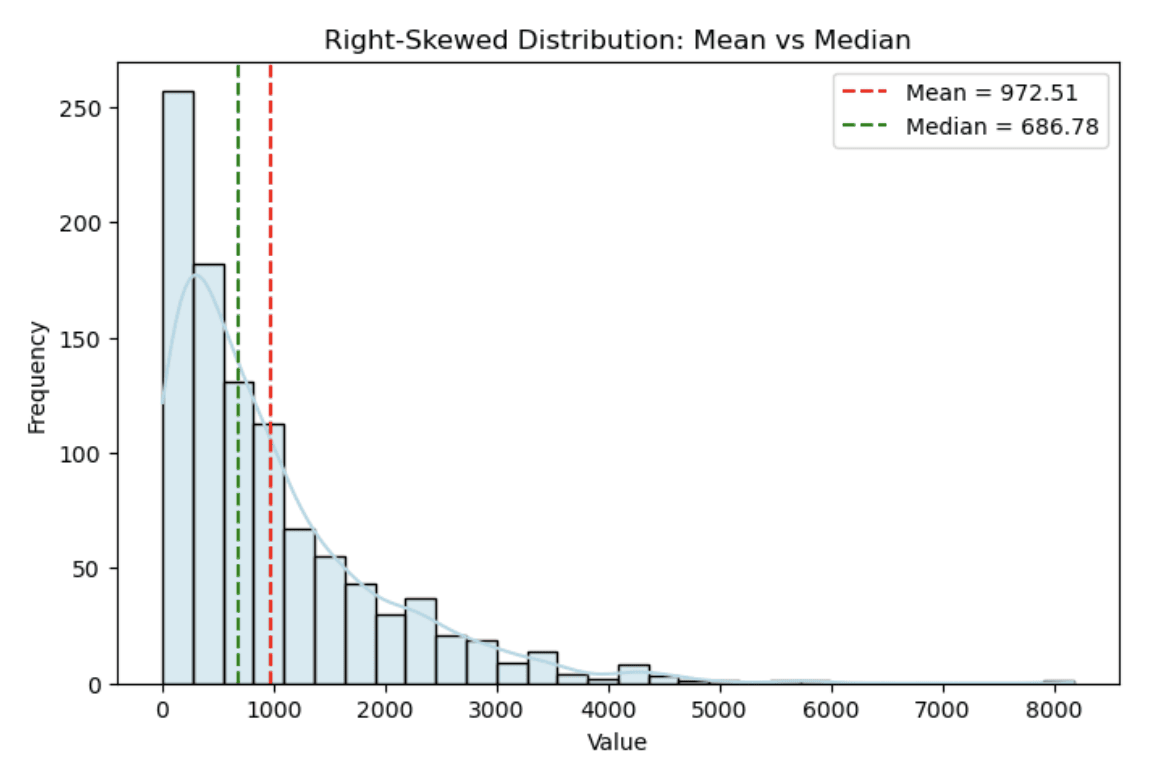
Histogram showing a right-skewed distribution. Image by Author
You can notice how the right skew stretches the tail, creating a clear difference between the mean and the median.
A box plot is an excellent way to visualize the impact of outliers on the median. Below, we compare two groups: one with outliers and one without. The median (vertical line inside the box) remains stable even with the presence of extreme values, but the overall range of the data is heavily impacted by the outlier.
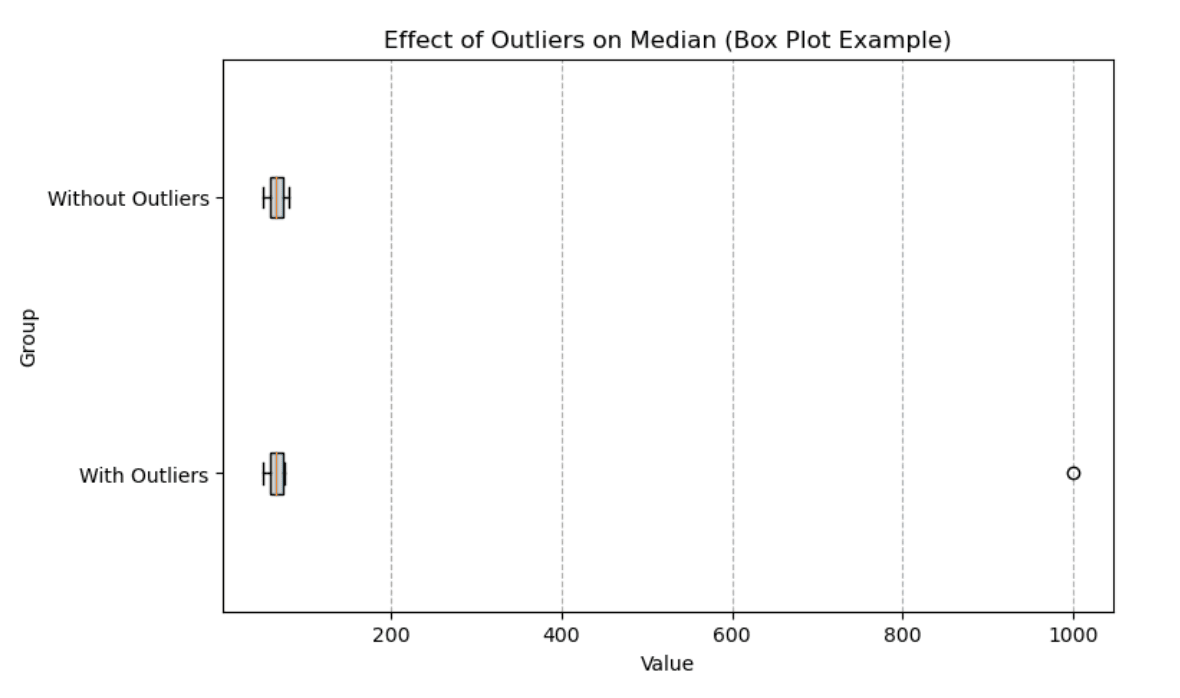
Box plot showing effect of outliers on median. Image by Author
These visualizations highlight how the mean and median respond to different data characteristics, providing clarity on when to use each measure. Whether analyzing skewed data, outlier-prone datasets, or comparing groups, visual aids like these can make complex relationships much easier to grasp.
Let's now look at some more advanced ideas if you are curious to learn more.
Now, if you are a data scientist and you need to fill in gaps in your data, you may have to choose an imputation method. You might now be wondering, what is the practical difference between mean vs. median imputation?
As you might guess, mean imputation replaces missing values with the average of the available data, which, as we have said, can be skewed by extreme values. Median imputation, on the other hand, replaces missing values with the middle value of the dataset.
A useful rule of thumb is to look at the distribution of your data. If your data distribution were skewed with many missing values, and you had used mean imputation, then you might have altered the distribution of your data!
But also remember that single-value imputation (mean or median) can shrink variance and weaken relationships between variables. If missingness is substantial, consider multiple imputation or model-based imputation to better preserve uncertainty and structure.
In many parametric methods, the mean (and variance) are central parameters. For example, a simple linear regression model assumes errors are normally distributed around a mean. When your data meet the normality assumption, the sample mean is a natural estimator and fits well within parametric frameworks.
Now, the median is often used in robust and non-parametric settings, and is a common choice when data are skewed or contain outliers. Many tests, like the Mann–Whitney test, are rank-based and compare distributions (often interpreted as a location shift under assumptions) rather than means, and they do not always test a difference in medians.
All this is to say that understanding the distinction between the mean vs. median is not just about describing data correctly, it’s also important in hypothesis testing.
When deciding whether to use a mean or a median, one key question is how stable our statistics are for a given dataset. Bootstrapping is one option that would allow us to empirically estimate the sampling distribution of both the mean and the median by repeatedly resampling (with replacement) from the original data.
You could highlight the differences in mean and median stability empirically. You could introduce a few outliers into a dataset and then re-run a bootstrap procedure, thus letting you visually show how the mean’s distribution shifts more dramatically than that of the median. Also, bootstrapping can make it concrete by showing how large or small your confidence intervals might be in realistic scenarios. Read our tutorial on applying bootstrap methods to learn more.
Let me now provide an alternate but equally true definition: The mean is the value that minimizes the sum of squared deviations from the data, whereas the median is the value that minimizes the sum of absolute deviations.
Take a look at this equation:
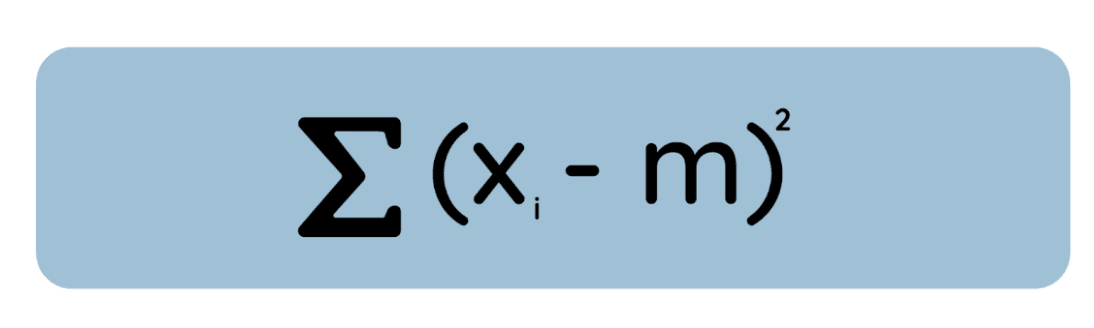
If you take the derivative of this equation with respect to , set it to zero, and solve, you will find that the minimizing value is simply the arithmetic mean. This matters because in many statistical methods, like OLS regression, we minimize squared errors for mathematical convenience and to conform to assumptions of normally distributed errors.
Now consider a different idea: Instead of squaring each deviation, we measure the absolute error between m and each data point:

Here we want to find m that minimizes this total absolute deviation. It turns out (by analyzing the derivative of the absolute loss, or by a geometric argument) that the solution is the median of the dataset. (And when you have an even number of observations, any value between the two middle points minimizes the total absolute deviation—so the minimizer may not be unique.)
Intuitively, if is to the left of the median, there are more data points on the right ,pulling it to move over. Only the median is where the pull from left and right balances out, minimizing total absolute distance.
Finally, I'll say the mean is computationally simpler at scale. What this means is that you can compute it incrementally as data streams in, without needing to sort.
Median is often computed by sorting in practice, which can be expensive at a large scale. But the median does not inherently require a full sort (there are selection algorithms), and for very large or streaming datasets, approximate quantile sketch algorithms are commonly used to estimate the median efficiently. Our Concepts in Computer Science course is a great resource for learning about these things.
As you have seen, the mean is the arithmetic average of a dataset, which makes it sensitive to extreme values, while the median represents the middle value in an ordered dataset. The right choie can make all the difference but, this said, in real-world analyses, it is often best to actually report both the mean and median alongside additional statistics like mode, standard deviation, and percentiles. This is the best way because it provides a comprehensive picture.
If you’re eager to explore deeper into statistical concepts, there are several areas worth focusing on. Start by reading up on more advanced variations of the mean, such as the trimmed mean, geometric mean, and weighted mean, which each have their purpose. I would also take our technology-agnostic Introduction to Statistics course.
Then, to really become more of an expert, you will want to choose and master a tool. Our Introduction to Statistics in R course and Statistician in R career track are both very informative starting points if you want to use R, which is a popular language for data science and statistics. If you prefer working with spreadsheets and a programming language like Python, our Introduction to Statistics in Google Sheets course and Introduction to Statistics in Python course provide a hands-on approach to statistical analysis using formulas and powerful libraries.
Learn with DataCamp
Course
Course
Course
Tutorial
Vinod Chugani
Tutorial
Elena Kosourova
Tutorial
Samuel Shaibu
Tutorial
Josef Waples
Tutorial
Josef Waples
Tutorial
Josef Waples