Microsoft Excel is arguably the most widely used data tool on the planet. Its ease of use and simple interface allow anyone to work with data with almost no barrier to entry and perform different types of operations such as editing datasets, applying formulas and functions, visualizing data, and more. However, as data increases in volume and complexity, the tougher it will be to do effective data work in Excel. This is where another Microsoft tool comes into play: Power BI.
Power BI is an efficient and powerful business intelligence tool designed for managing and analyzing data, and creating dynamic interactive dashboards that can be easily shared with others. While having a similar interface to Excel, Power BI supercharges the ability of Excel to empower non-coding professionals in the data-driven age. Luckily, this means Excel experts can easily pick up Power BI and extend their data skills. In this article, we will break down how Excel users can get started with Power BI through the following questions:
- What is Power BI?
- The advantages of Power BI over Excel
- How to get started with Power BI with a simple tutorial
What Is Power BI?
Power BI is a powerful business intelligence tool that enables you to effectively report insights through easy-to-use customizable data visualizations. Its drag and drop interface enables non-coding professionals to design, deploy, and share complex and customizable dashboards. An increasing number of organizations are using Power BI, with more than 250,000 organizations using it today.
There are three major components to Power BI, each of these for a different purpose:
- Power BI Desktop—A desktop application that provides data analysis and creation tools. It is free to use and you can download it here.
- Power BI Service—A cloud-based version of Power BI that provides lightweight report editing, and the ability to share and distribute reports.
- Power BI Mobile—A mobile version of Power BI, which allows you to author, view, and share reports on the go.
There are also paid versions of Power BI such as Power BI Pro and Power BI Premium, which enable additional features for collaboration, data governance, access to the mobile app, and more. Power BI Pro is also part of the Microsoft Office 365 E5 plan—which means there’s a strong chance you already have access to it if your organization uses Microsoft Office.
For the purposes of getting started though, you can definitely stick with Power BI Desktop, as everything you can apply in Desktop is also applicable to Power BI Pro.
If you're interested in how Power BI vs Tableau stack up, check out our separate article.
Advantages of Power BI Over Excel
Given the popularity of Power BI and the different ways practitioners can use it, what are its main advantages over Excel? While there are many that we can list, here are the top 3 advantages of Power BI over Excel.
1. Storing and processing large amounts of data
A major advantage of using Power BI is the ability to work with big datasets quickly. Indeed, it's hard to work in Excel if a file is bigger than 500 MB in size, or more than 1 million rows long. Moreover, Power BI can easily connect separate tables, extending the ability to easily join datasets. This is another feature in which Power BI shines over Excel.
2. Designing powerful dashboards and visualizations
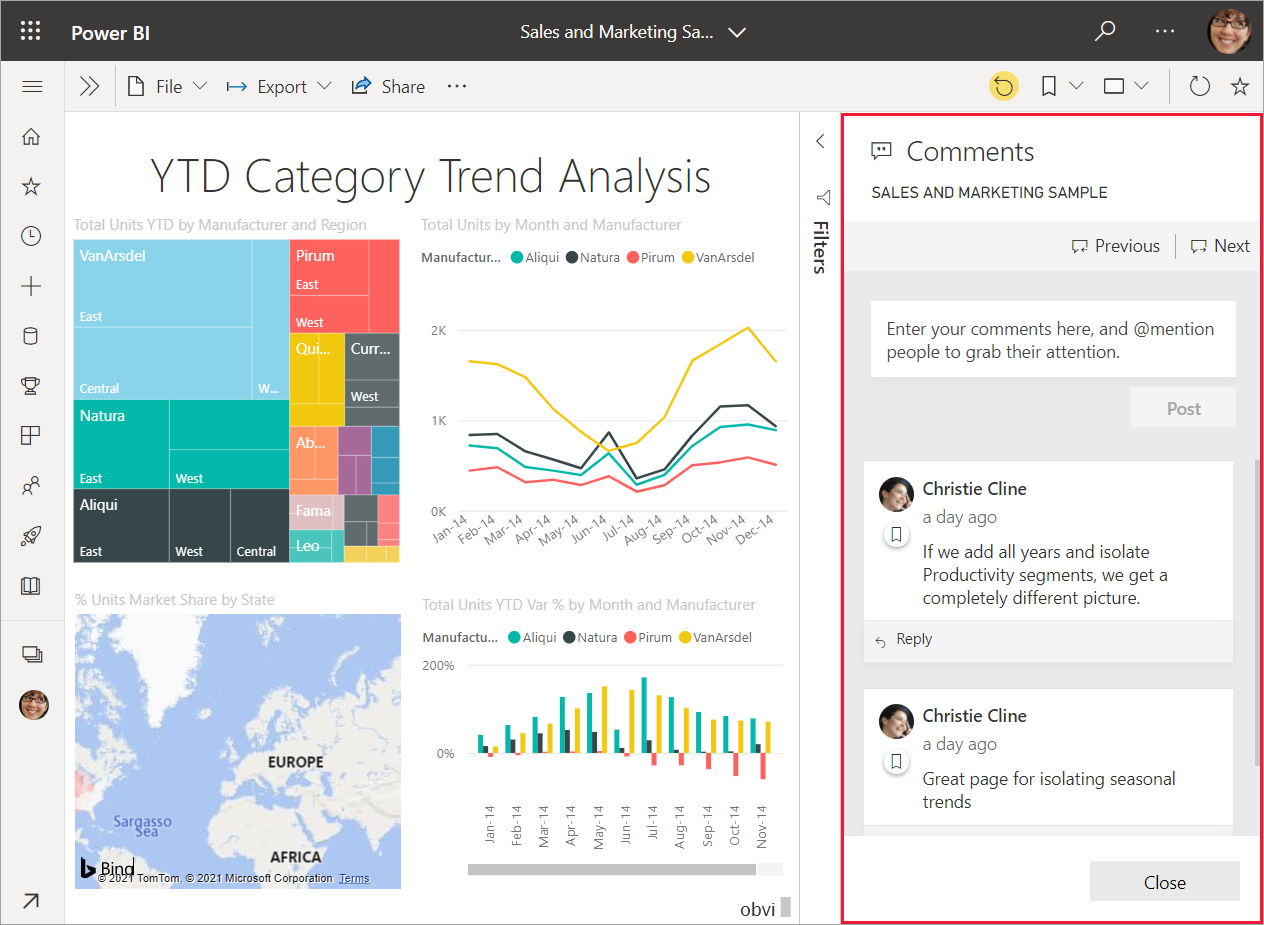
While Excel provides basic data visualization features, the main advantage of working in Power BI is its ability to design and deploy appealing, interactive, and customizable reports and dashboards. To get a taste of these reports in action, you can check out the Power BI community gallery, which hosts a wide range of dashboards and reports developed by practitioners. An example of how powerful data visualizations can be in Power BI is best exemplified with the cross-filtering feature—which lets data consumers filter a report based on one or more dimensions of the data.
3. Better, easier collaboration features
Another key advantage of Power BI over Excel is its collaboration and sharing features. For example, analysts can collaborate together on dashboards and visualizations with features such as commenting and annotation. Moreover, you can set granular levels of access for dashboards and their underlying datasets, a feature called row-level security—or prevent out-of-date data from being shared in reports. This makes Power BI a better fit for modern, distributed data workflows than Excel.
Getting Started With Power BI
Now that we’ve covered the main advantages of Power BI over Excel—let’s break down how any Excel expert can get started with their Power B learning journey. This section is divided into the following steps:
- Start with the basics
- Build a simple report
- Practice your own data
- Combine your Excel skills with Power BI
Learn the Basics
Of course, when transitioning to any new tool, it’s always important to learn the fundamentals. However, it’s very easy to get bogged down focusing purely on the fundamentals and the theory behind working with Power BI. As a rule of thumb, learn enough basics to start working on simple analyses and visualizations, and grow your confidence and skills from there. For the purposes of learning the basics, here’s a list of resources you can use:
- How to use Microsoft Power BI by Kevin Strartvert
- Microsoft’s Power BI Courses and Tracks
- Power BI Tutorial by Avi Singh
- DataCamp’s Introduction to Power BI Course
Build a Simple Report
Once you feel like you have enough basics to get started—the best way to start learning is to start practicing by building simple dashboards and reports. You can start doing this immediately by downloading the free Power BI Desktop app. While there are some limitations in memory and collaboration, it’s more than enough to get started on small datasets. Here’s a step-by-step tutorial for building a simple dashboard in Power BI.
Get and Load Data
There are principally two ways to load data into Power BI. The first way is to click the Get Data button from the menu and decide what type of data you want to import. Power BI supports a variety of data types, from Excel workbooks to SharePoint files, and can even connect to databases.
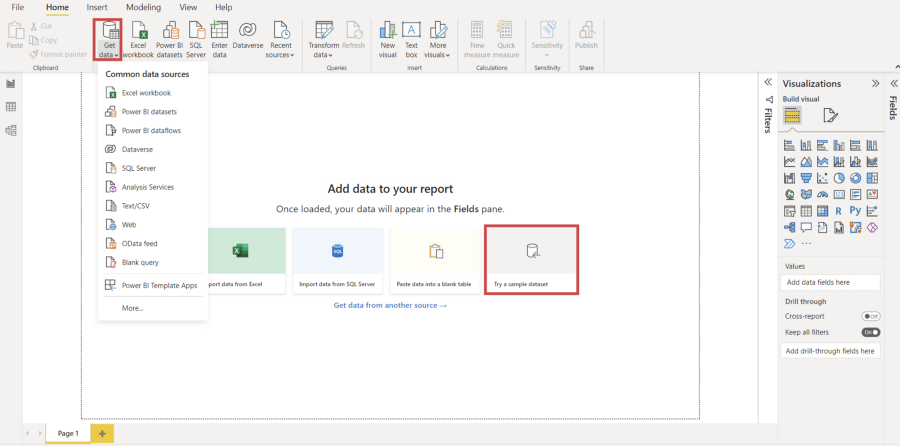
If you don’t have any datasets to play around with yet, you can also try a sample dataset, which can be accessed in the section highlighted in the red box located in the center.
In this tutorial, we will download one of the samples available from Power BI, called the Financial data sample workbook. Once you have downloaded it, you only need to use the Get Data button and select the option Excel workbook. After that, you select the table named financials and press the Load button.
Once you have loaded the table, you can check it out by pressing on the “Data View” as seen in the gif below. You will notice that Power BI’s data view interface is very similar to Excel’s user interface. Moreover, there are similar operations you can apply, such as renaming, adding and deleting columns, filtering data, replacing values of a column, and more. For example, we can filter the column Country to remove the United States. There is also the possibility to sort the column in ascending or descending order.
Build a Report
Now that the data is loaded into Power BI, we can build a simple report. To build a report, you can go to the report view highlighted in the gif below.
In this pane, you can see the name of the table and its corresponding columns on the right-hand side. In this example, we’re visualizing some data related to the Sales and Country fields. To do so, you can select the two fields, and choose from the different types of visualizations available in the visualizations pane. You can also visualize groupings of data, such as “Sales by Country”.
Publish the Report
Once you’re done with the report, you are ready to share some beautiful, interactive data visualizations! To share this report, you first need to publish it in the Power BI Service. There are three steps to do it:
- Select Publish after clicking File in the menu
- Compile a Destination, such as My workspace, and press the Select button
- At this point, you need to select the link Open' your-file-name' in Power BI. It will also ask you to sign in. If you still don't have a registered account, it will let you create a new one.
Et Voilà! Our report is now published in the Power BI Online App. If you want to share the report with other people, you need to click the Share button at the top. There are two modalities of sharing. The first possibility is to copy the link of the report and send it to the coworkers. The other alternative is to share it via Outlook or Teams. However, it's possible to share reports with other people only with a subscription to Power BI Pro or Power BI Premium.
Master Power BI From Scratch
Become a Power BI Data Analyst
Master the world's most popular business intelligence tool.