
Track
Excel Fundamentals
16 hr
Microsoft Excel is one of the most widely used and versatile tools in all environments. Its broad utility spans simple budget tracking to advanced data analytics, making it a critical skill for any industry.
In this guide, you’ll explore some top Excel projects. You will also learn how to execute these projects step-by-step and explore integrations with tools like Power BI, Python, and AI add-ins.
If you need a primer on your Excel skills, make sure to check out our Excel Fundamentals skill track.
In this section, we’ll explore 10 Excel projects across various applications. Each introduces new skills and provides context for their application.
These projects are ideal for personal development, workplace improvements, or even building a freelance portfolio.
Churn is a key challenge for subscription-based businesses. In this project, Analyzing Customer Churn in Excel, you’ll analyze data from Databel, a fictional telecom provider, to uncover why customers leave and how to retain them.
Key steps you’ll take are:
IF and COUNTIFS to segment churn by demographics and service typesThis project is ideal if you want to practice turning operational data into business insights, especially in a customer analytics or retention context.
Managing personal finances is a crucial life skill for all of us. For this to be managed effectively, you’ll need a platform to store and track changes.
Excel simplifies this by offering a dynamic environment to monitor and control your spending habits.
Here are some steps you can take to carry out this project:
SUMIF to calculate total expenses per category and IF statements to highlight overspending.If you’re a beginner, this would be the perfect first project. When things get too difficult and you get stuck, check out our Excel Shortcuts Cheat Sheet for a quick-start guide.
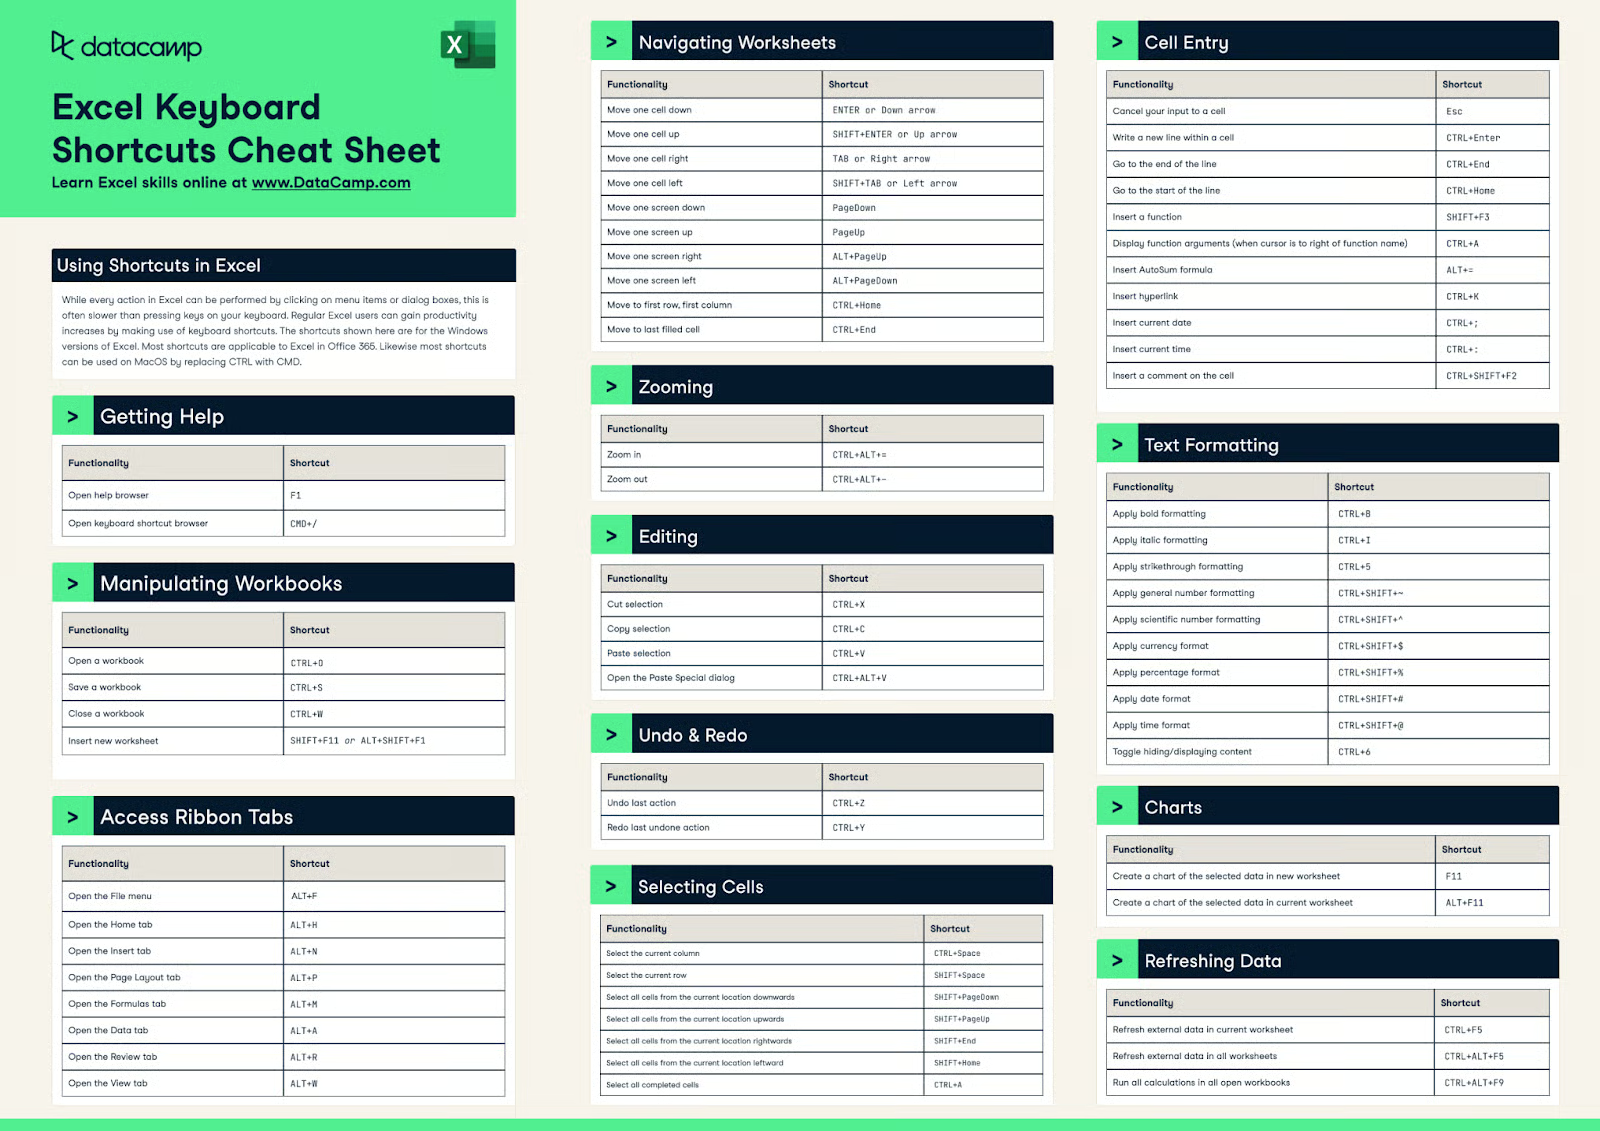
Source: Excel Shortcuts Cheat Sheet - DataCamp
A simple project you can start is one on survey data based on customer feedback. Understanding customer sentiment through deeper analysis can drive product and service improvements.
Some steps you can take are:
Text-to-Columns and TRIM.COUNTIF, SEARCH, and LEN to extract sentiment insights.If you’re planning to learn more about the advanced features of Excel, like Power Query, you should work on one that focuses solely on using Power Query.
Power Query enables you to convert messy data into clean, analysis-ready formats.
Some steps you can take in this project are:
A simple project beyond personal expenses, you can go one step further and analyze data that is commonly found in businesses, such as office expenses.
To maintain control over departmental or team-level spending, Excel can serve as an efficient tracking tool.
In this project, you should try to:
SUMIFS to calculate monthly totals.Inventory tracking is vital in logistics and retail. This can be done at a low level using Excel’s features.
Try to include the following steps in your project:
Forecasting future sales guides decision-making in areas like procurement, staffing, and marketing. This can be good for those looking to do a more advanced Excel project.
What to include in this project:
FORECAST.LINEAR or use Excel’s Analysis Toolpak.Excel can be an effective alternative to specialized project management tools.
You can follow these steps to create a basic Excel project management tool:
This project focuses on analyzing clinical or operational data in healthcare settings.
For healthcare data, you can create a dashboard that clinicians can use to monitor their key metrics through helpful charts and data visualizations.
Here are some steps:
AVERAGEIFS and COUNTIFS to generate metrics.Manual reporting processes can be streamlined using Excel’s Visual Basic for Applications (VBA).
Here are some steps:
Financial modeling is essential for strategic planning and investment analysis.
In this project, try to include these steps:
NPV, IRR, and XNPV.DATA TABLE.FMCG brands like Coca-Cola, Nivea, and Lay’s are household names, but what drives their strategy behind the scenes? In this Net Revenue Management in Excel project, you’ll step into the role of a category manager at Healthmax, a fictional shampoo brand, and use Excel to analyze market performance and uncover growth opportunities.
Key steps include:
This project is ideal for applying Excel to real-world business strategy and exploring how data informs decision-making in the FMCG space.
Executing an Excel project successfully requires thoughtful planning, clean data management, logical design, and consistent refinement.
Here are some general steps you can take:
IFERROR and conditional formattingWorking on your Excel project may come with challenges, especially if it’s your first time.
To avoid common pitfalls and to ensure your project is perfect, here are some tips you can consider:
Maintaining a logical structure in your workbook improves clarity and usability. Always separate raw data from calculations and final outputs. Use dedicated sheets for each section to prevent clutter and confusion.
Excel Tables help you reference ranges dynamically, while consistent formatting and headers enhance readability and make it easier to navigate your workbooks.
To ensure your project’s accuracy, implement validation rules that prevent invalid inputs. Use DATA VALIDATION for dropdowns, lists, and numeric constraints.
Take advantage of Excel’s auditing tools, such as “Trace Precedents” and “Evaluate Formula”, to follow the logic behind your calculations. This helps in troubleshooting and makes it easier for collaborators to verify your logic.
Excel is often used in team environments, so protecting your content is vital. Lock critical formulas and protect worksheets to prevent accidental changes. Share your files through OneDrive or SharePoint to allow real-time collaboration and maintain version control.
Adding clear cell comments or a documentation sheet improves transparency and usability for others.
Although your personal projects are mostly used by yourself, it’s good to learn about the various sharing features to understand how to share them with co-workers in real projects.
To take your Excel projects to the next level, explore integration with other tools. Link your workbook to Power BI for advanced data visualizations. Use Microsoft Copilot to generate or explain formulas and build charts from natural language inputs.
For more advanced modeling, integrate Python or R to apply machine learning techniques and statistical tests directly within your spreadsheet.
You can also try learning Excel's lesser-known functions in our Advanced Excel functions course.
Learning Excel through real projects is far more effective than memorizing functions or reading manuals. Projects simulate real-world tasks, forcing you to navigate challenges such as cleaning messy data, structuring workflows, and presenting insights to stakeholders.
Excel is used in almost every sector, making it a universal tool for data manipulation and reporting.
For example:
These examples show how adaptable Excel is and how essential it is for various roles.
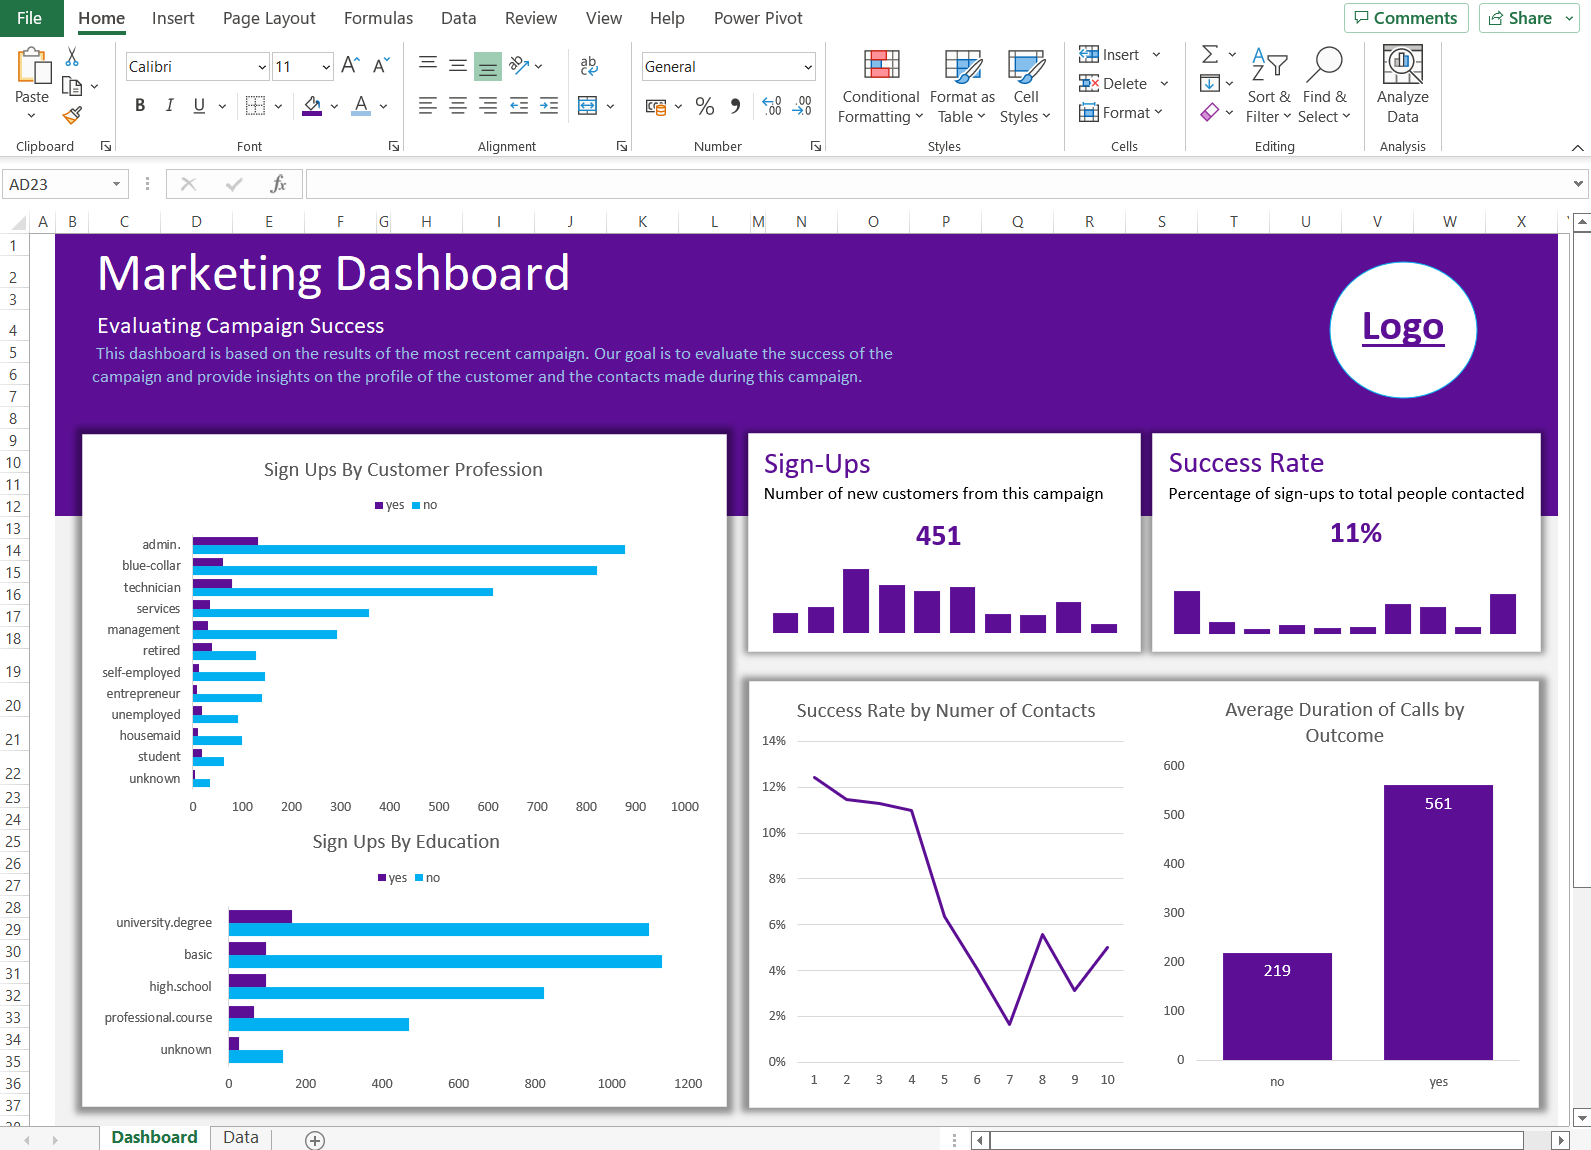
Source: How to Create a Dashboard in Excel in 3 Easy Steps - DataCamp
As you can see in the dashboard example above which is built in Excel, it has the potential to provide unique insight into a simple dataset.
Engaging in Excel projects also cultivates key competencies such as:
When working on practical Excel projects, the project-based learning style ensures that each new project builds on your previous knowledge, allowing you to gather all the necessary skills for a real-life project.
Excel continues to evolve with emerging technologies that enhance its analytical power and usability.
The integration with Power BI allows users to transform Excel models into fully interactive dashboards. This synergy enables teams to build in Excel and scale insights across the organization using Power BI’s visualization and sharing features.
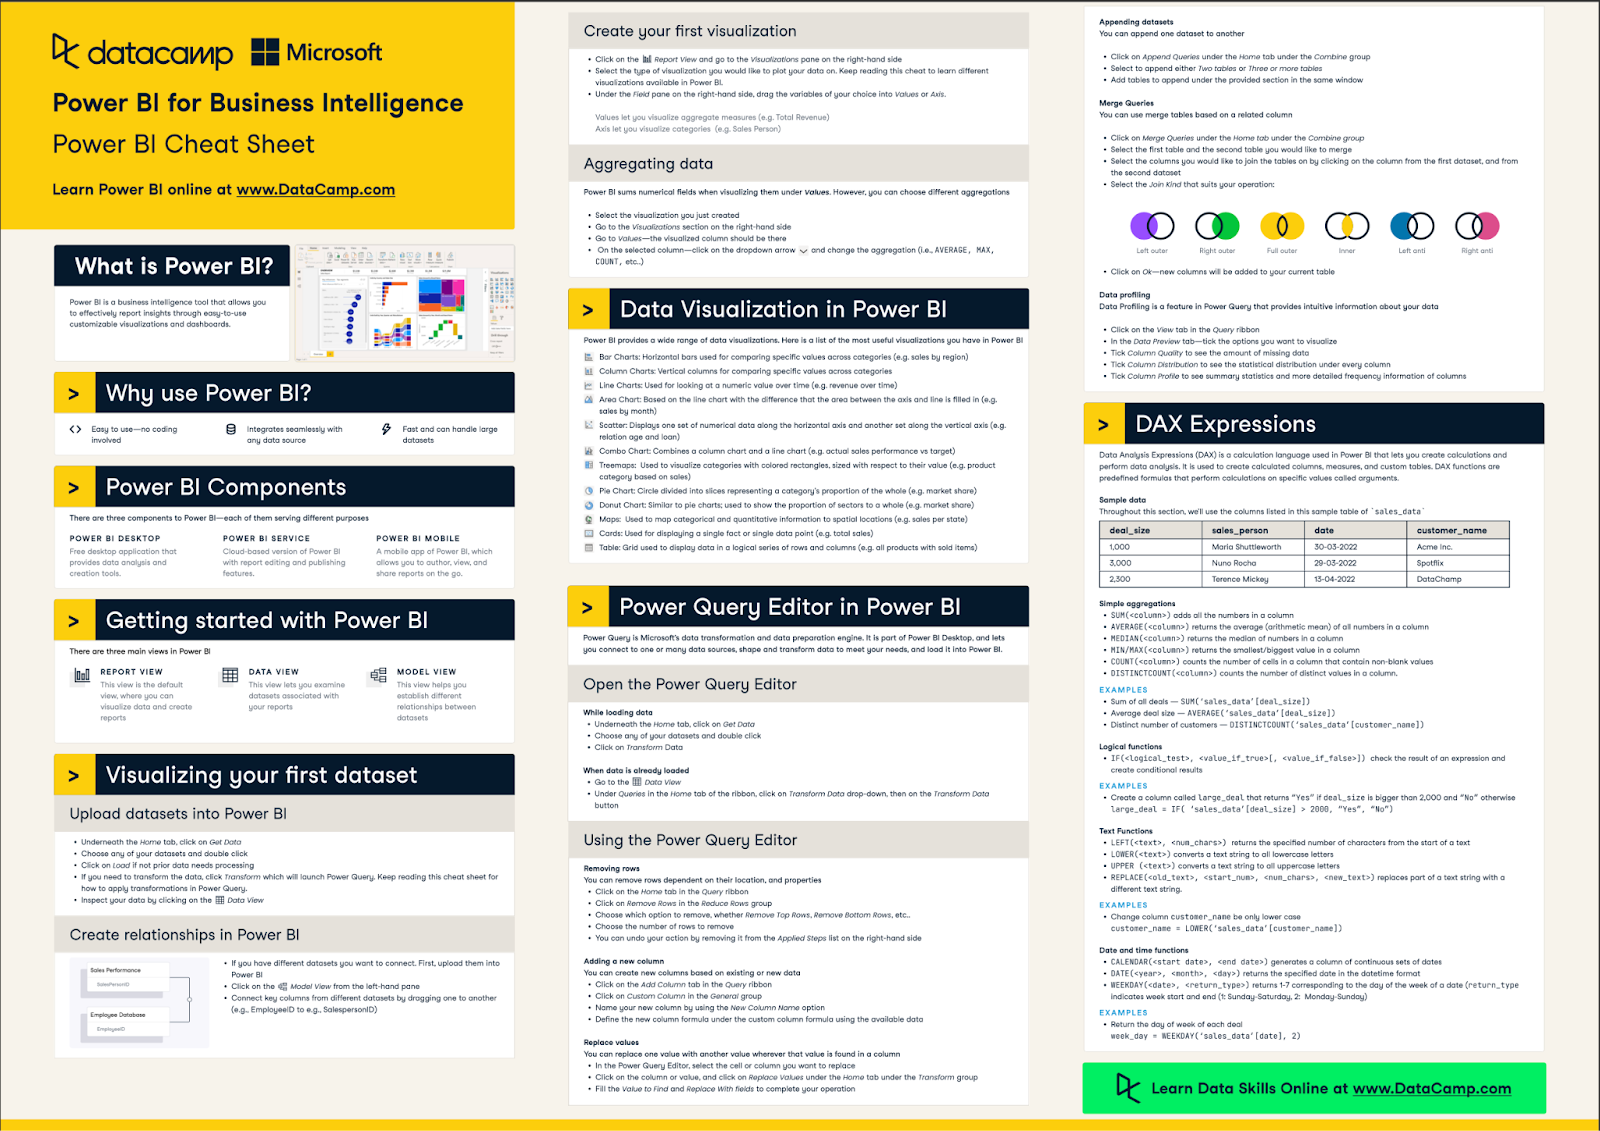
Source: Power BI Cheat Sheet - DataCamp
AI-powered tools like Copilot in Excel are revolutionizing how users interact with spreadsheets. You can now describe your goals in plain language and let AI generate formulas, automate tasks, or detect outliers in datasets. These tools make advanced features more accessible to non-technical users.
Excel’s growing compatibility with Python and R also opens the door to machine learning and statistical modeling directly within your spreadsheet environment.
For example, you can run Python scripts to build sales prediction models or use R to conduct A/B testing on marketing campaigns without leaving Excel.
Microsoft Excel remains a foundational tool in data analytics. Its flexibility enables it to be used widely across industries and applications. Through these projects, you should be able to get a good understanding of the different aspects of Excel and how they can be applied in a practical way.
For more reading, check out our Learning Excel Guide or our Excel Shortcuts Cheat Sheet.
If you’re thinking of learning deeper, our Excel Fundamentals skill track is the perfect place to start.
Top Excel Courses
Track
Course
Course
blog
Tim Lu
15 min
blog
Kurtis Pykes
14 min
blog
Elena Kosourova
11 min
Tutorial
Javier Canales Luna
Tutorial
Natassha Selvaraj
Tutorial
Tim Lu