
Course
Designing Agentic Systems with LangChain
3 hr
12.1K
DeepSeek V3.2 Speciale is a high-compute reasoning model tuned for complex, tool-augmented workflows. Instead of just answering questions directly, it’s designed to plan, reason, and coordinate tools for building agentic analytics systems.
In this tutorial, we’ll use DeepSeek V3.2 Speciale to build an AI Data Analyst Agent that sits on top of any CSV. The flow looks like this:
At the end, you’ll have a Streamlit app with explicit plans and reproducible analysis steps. If you’re keen to learn more about AI agents, I recommend checking out the AI Agent Fundamentals skill track.
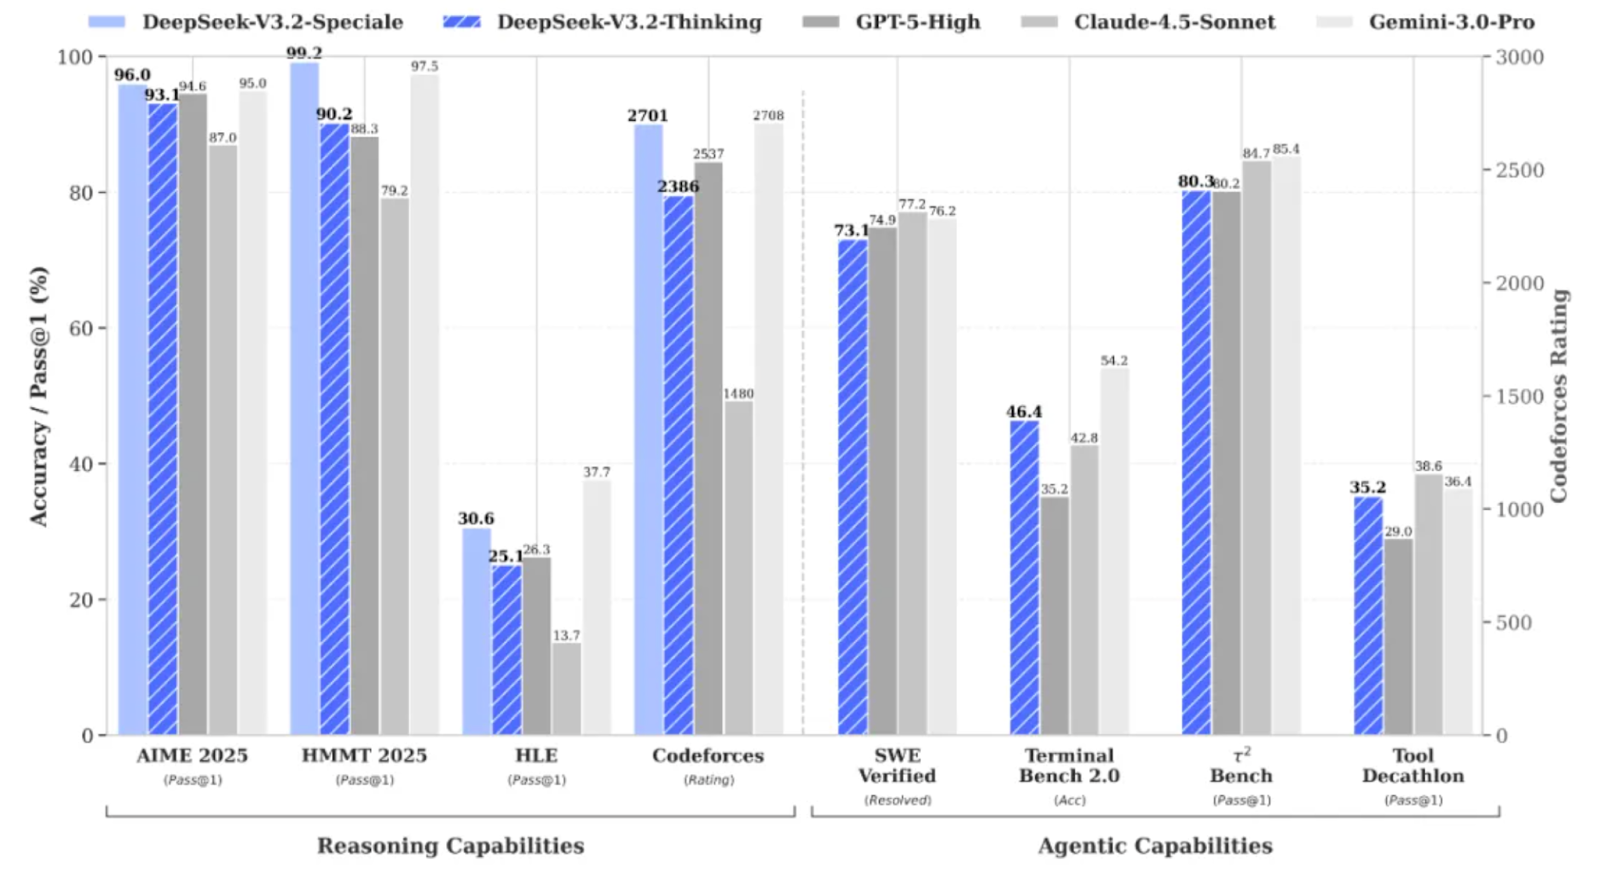
DeepSeek V3.2 Speciale is the high-compute, reinforcement-learning boosted variant of the DeepSeek V3.2 family, designed specifically for deep reasoning rather than casual chat.
It pushes performance to the point where it rivals models like Gemini 3 Pro on complex tasks, and has even achieved gold-medal results on benchmarks such as IMO, CMO, ICPC World Finals, and IOI 2025.
DeepSeek V3.2 Speciale is optimized for:
V3.2 Speciale only supports thinking mode and currently does not support tool-calling via the official API. You can’t just tweak the temperature and expect clean JSON on the first try. The Speciale model will think at length and often interleave its reasoning with the final answer.
In this section, we’ll implement an AI Data Analyst Agent with a DeepSeek V3.2 Speciale model wrapped in a Streamlit application. At a high level, here’s what the final app does:
Let’s build it step by step.
First, install the core dependencies and grab an API key from DeepSeek’s API platform:
pip install streamlit pandas matplotlib seaborn python-dotenv openaiWe’ll use a few core libraries like streamlit to power the interactive web app UI, pandas to load and manipulate CSV data, matplotlib, and seaborn to create charts and visualizations. The python-dotenv library is used to load environment variables from an .env file, and OpenAI as the client for talking to DeepSeek’s OpenAI-compatible API.
Next, log in to the DeepSeek API platform, go to the API Keys tab, and click Create a new API key.
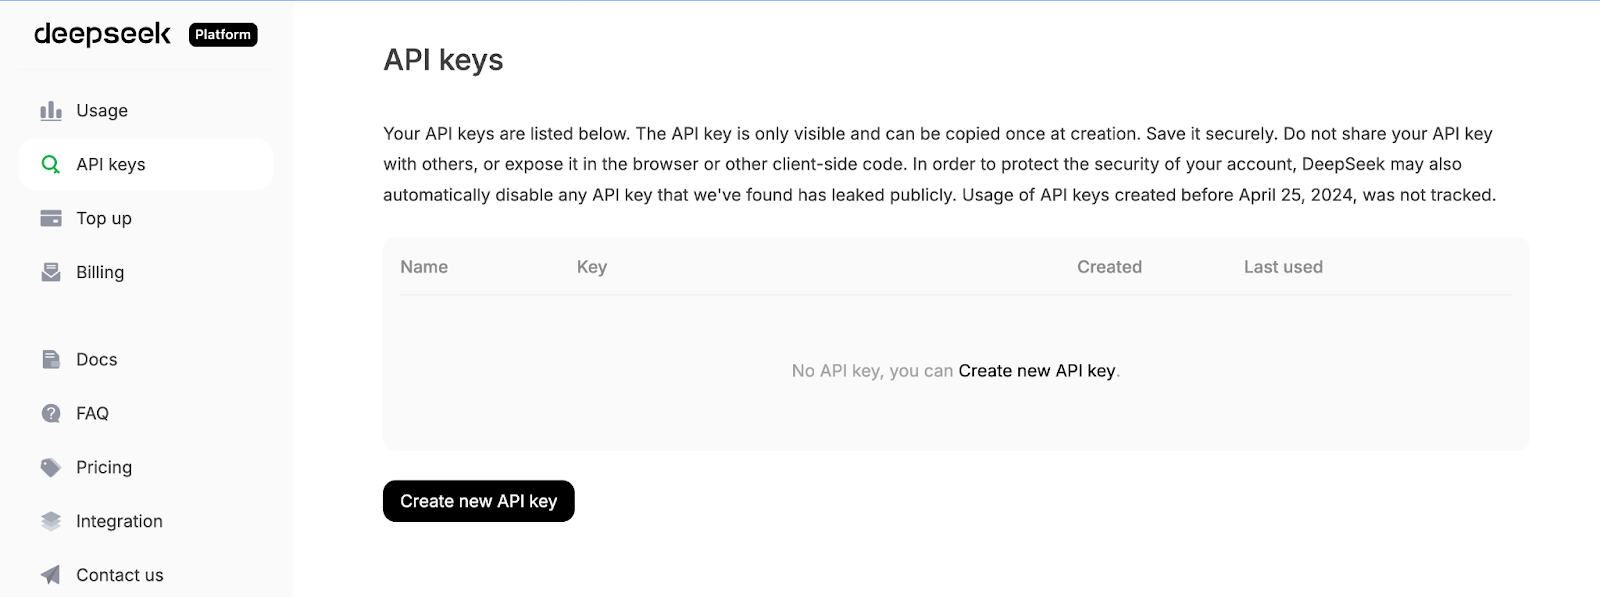
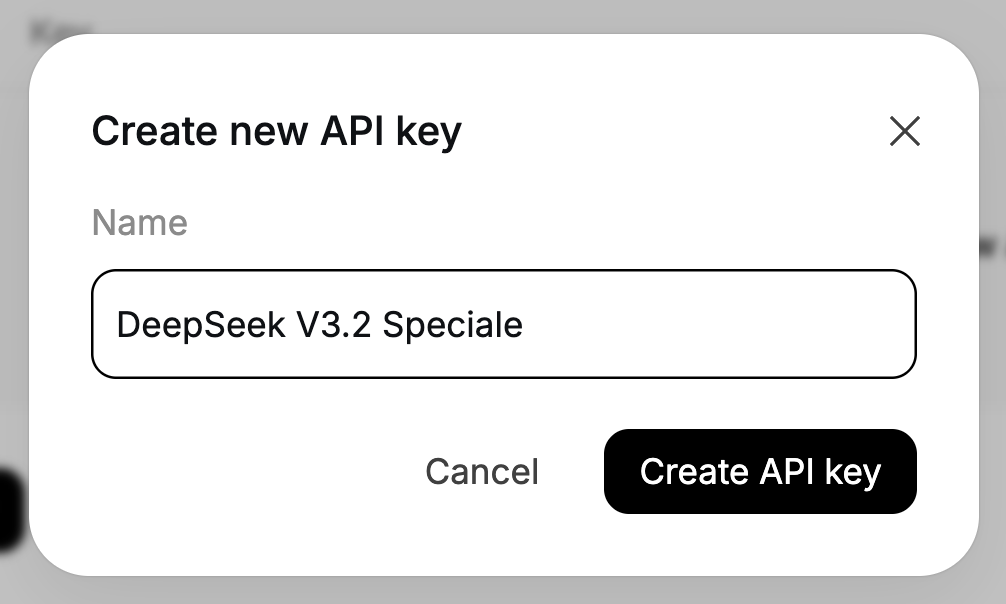
Finally, provide your key a name, and copy the generated key.
Set your DeepSeek API key as an environment variable:
export DEEPSEEK_API_KEY="your_api_key_here"Now our environment is ready.
With the dependencies installed, the next step is to pull them into our script and wire up the DeepSeek client that will power our planner and explainer agents.
import io
import json
import os
import re
from datetime import datetime
import matplotlib.pyplot as plt
import pandas as pd
import seaborn as sns
import streamlit as st
from dotenv import load_dotenv
from openai import OpenAI
plt.style.use('seaborn-v0_8-darkgrid')
sns.set_palette("husl")
load_dotenv()
DEEPSEEK_API_KEY = os.getenv("DEEPSEEK_API_KEY")
if not DEEPSEEK_API_KEY:
    raise RuntimeError("Please set DEEPSEEK_API_KEY env variable.")
DEEPSEEK_BASE_URL = os.getenv(
    "DEEPSEEK_BASE_URL",
    "https://api.deepseek.com/v3.2_speciale_expires_on_20251215",
)
client = OpenAI(
    api_key=DEEPSEEK_API_KEY,
    base_url=DEEPSEEK_BASE_URL,
)
The above code block does three things. It imports our core libraries, applies a plotting style, and loads environment variables from .env. Then it reads DEEPSEEK_API_KEY, validates it, and constructs an OpenAI client pointed at DeepSeek’s temporary V3.2 Speciale endpoint so every subsequent LLM call goes through the right model.
Note that DeepSeek V3.2 Speciale is currently served from a temporary endpoint that expires on 15 December 2025. After that, the deployment URL may change, but the model name will remain deepseek-reasoner. For the latest endpoints and usage details, refer to the official DeepSeek documentation.
With the client configured, let’s define our two agents - one to plan the analysis, and another to explain the results.
With the client in place, we can build the Planner Agent, which decides what analysis to run with the data. Instead of letting the model directly manipulate the DataFrame, we ask it to produce a structured JSON plan that our Python “data worker” can safely execute.
The planner sees a text description of the dataset along with the user’s question, and returns a JSON object describing the operation, group-by columns, filters, metric, and chart type.
def call_planner_llm(schema_text: str, question: str) -> tuple[dict, str]:
    system_prompt = """
    You are a data analysis planner. Convert user questions into JSON plans.
    JSON Structure (REQUIRED):
    {
      "operation": "group_by_summary",
      "group_by": ["column_name"],
      "filters": [],
      "target_column": "column_to_analyze",
      "metric": "sum",
      "need_chart": true,
      "chart_type": "bar"
    }
    Fields:
    - operation: Always use "group_by_summary" (most flexible)
    - group_by: Columns to group by (e.g., ["Product Name"] or ["Category", "Region"])
    - filters: Optional filters, e.g., [{"column": "Year", "op": "==", "value": "2023"}]
    - target_column: Column to aggregate (must exist in schema!)
    - metric: One of: sum, mean, count, max, min
    - need_chart: true (always show chart)
    - chart_type: bar, line, or pie
    Quick Rules:
    - Use ONLY columns from the provided schema
    - For "this year", look for year columns or use the latest year in data
    - For "top N", use appropriate group_by and metric
    - For comparisons, use filters to split groups
    Think briefly, then output the complete JSON.
    """.strip()
    messages = [
        {"role": "system", "content": system_prompt},
        {
            "role": "user",
            "content": f"Dataset:\n{schema_text}\n\nQuestion:\n{question}\n\nReminder: After analyzing, output the complete JSON plan.",
        },
    ]
    resp = client.chat.completions.create(
        model="deepseek-reasoner",
        messages=messages,
        max_tokens=8192,
    )
    message = resp.choices[0].message
    content = message.content or ""
    content = content.strip()
    reasoning_content = getattr(message, 'reasoning_content', None) or ""
    finish_reason = resp.choices[0].finish_reason
    def extract_json_from_text(text: str) -> dict | None:
        if not text:
            return None
        try:
            return json.loads(text)
        except json.JSONDecodeError:
            pass
        code_block_match = re.search(r'```(?:json)?\s*(\{[\s\S]*?\})\s*```', text, re.DOTALL)
        if code_block_match:
            try:
                return json.loads(code_block_match.group(1))
            except json.JSONDecodeError:
                pass
        def find_all_json_objects(s):
            objects = []
            depth = 0
            start_idx = None
            in_string = False
            escape_next = False
            for i, char in enumerate(s):
                if escape_next:
                    escape_next = False
                    continue
                if char == '\\':
                    escape_next = True
                    continue
                if char == '"' and not in_string:
                    in_string = True
                elif char == '"' and in_string:
                    in_string = False
                elif not in_string:
                    if char == '{':
                        if depth == 0:
                            start_idx = i
                        depth += 1
                    elif char == '}':
                        depth -= 1
                        if depth == 0 and start_idx is not None:
                            objects.append(s[start_idx:i+1])
                            start_idx = None
            return objects
        for candidate in find_all_json_objects(text):
            try:
                parsed = json.loads(candidate)
                if isinstance(parsed, dict) and any(k in parsed for k in ['operation', 'target_column', 'metric', 'group_by']):
                    return parsed
            except json.JSONDecodeError:
                continue
        for i in range(len(text)):
            if text[i] == '{':
                decoder = json.JSONDecoder()
                try:
                    parsed, _ = decoder.raw_decode(text[i:])
                    if isinstance(parsed, dict) and any(k in parsed for k in ['operation', 'target_column', 'metric', 'group_by']):
                        return parsed
                except json.JSONDecodeError:
                    continue
        return None
    if reasoning_content:
        plan = extract_json_from_text(reasoning_content)
        if plan is not None:
            return plan, reasoning_content
    plan = extract_json_from_text(content)
    if plan is not None:
        return plan, reasoning_content
    error_msg = (
        f"Planner returned non-JSON content.\n"
        f"Finish reason: {finish_reason}\n"
        f"Content received: {repr(content[:500]) if content else '(empty)'}\n"
        f"Reasoning content length: {len(reasoning_content) if reasoning_content else 0}\n"
        f"Reasoning content sample: {reasoning_content[:500] if reasoning_content else '(none)'}"
    )
    if finish_reason == "length":
        error_msg += "\n\nNote: Response was truncated due to token limit. The model didn't finish generating the JSON."
    raise ValueError(error_msg)
First, the system_prompt defines the contract for the Planner Agent, which converts the user question into a JSON plan, and it specifies exactly which fields we expect, such as a list of group_by columns, optional filters, a target_column, a metric, and a chart_type.
We also add in a few heuristics (like how to handle “this year” or “top N”) so the model behaves more like a junior data analyst than a generic chatbot.
Next, we build the system message that carries the instructions, and bundles two things, including a textual description of the dataset schema (column names, dtypes, sample rows) and the user’s question. This gives the model enough context to pick valid column names and choose a sensible aggregation for the question being asked.
DeepSeek V3.2 Speciale is then called via client.chat.completions.create(). Since this is a reasoning model, it can produce two channels of output, a visible content string and an internal reasoning_content string where most of the “thinking” and final answer often live. We pull both out of the response and keep track of the finish_reason so we can detect truncation.
The heavy lifting happens inside extract_json_from_text() function. Since reasoning models don’t always return clean JSON, we wrap it in a markdown. To make the planner robust, this helper function tries several strategies in sequence:
json.loadsOn each candidate, it only accepts objects that look like a valid plan i.e., they must contain at least one of operation, target_column, metric, or group_by fields.
Finally, we then connect everything together by applying extract_json_from_text() function to reasoning_content.
Together, these pieces turn any natural-language question and schema snapshot into a structured analysis plan.
Once the Data Worker has run the analysis with Pandas, we send the result table along with the JSON plan back to DeepSeek and turn everything into a summary with concrete insights.
def call_explainer_llm(question: str, plan: dict, result_summary: list) -> tuple[str, str]:
    system_prompt = """
    You are a senior data analyst explaining insights to business stakeholders.
    The user asked a question about their CSV data.
    Another agent already designed an analysis plan and we executed it in Python.
    You will now explain the results in clear, engaging, non-technical language.
    Requirements:
    - Start with a direct 1-2 sentence answer to their question
    - Use bullet points (3-5 points) to highlight key insights, trends, or comparisons
    - Include specific numbers and percentages where relevant
    - Use business-friendly language (avoid technical jargon like "aggregation", "groupby")
    - If the data shows interesting patterns, point them out
    - End with a brief recommendation or next step if appropriate
    Keep it concise and actionable.
    """.strip()
    limited_summary = result_summary[:20] if len(result_summary) > 20 else result_summary
    user_content = f"""
    User question:
    {question}
    Analysis performed:
    {json.dumps(plan, indent=2)}
    Results (top rows):
    {json.dumps(limited_summary, indent=2)}
    Total rows in result: {len(result_summary)}
    """.strip()
    messages = [
        {"role": "system", "content": system_prompt},
        {"role": "user", "content": user_content},
    ]
    resp = client.chat.completions.create(
        model="deepseek-reasoner",
        messages=messages,
        max_tokens=2048,
    )
    message = resp.choices[0].message
    content = message.content or ""
    content = content.strip()
    reasoning_content = getattr(message, 'reasoning_content', None) or ""
    if not content:
        if reasoning_content:
            content = reasoning_content.strip()
    return (content if content else "Unable to generate explanation from the model response.",
            reasoning_content)
The explainer agent begins by setting the system_prompt, which instructs DeepSeek to behave like a senior data analyst talking to business stakeholders. We specify the exact shape of the answer we want, along with other recommendations for drafting the response.
Next, we prepare user_content, which gives the model all the context it needs. We pass in the original question, the JSON analysis plan (so it knows what computations were run), and the total number of rows.
We then assemble the messages list and call DeepSeek V3.2 Speciale via client.chat.completions.create(). Just like in the planner, the model may return text in both content and reasoning_content, so we add both and fall back to reasoning_content if content is empty.
Finally, the function returns a tuple including both the explanation and the raw reasoning string that shows up in the expander.
With this Explainer Agent in place, the loop is complete:
Before we can let DeepSeek plan anything, we need to describe the data clearly and make it analysis-friendly. This is attained using a bunch of helper functions.
The Planner Agent can’t see your DataFrame directly, so we send it a compact textual summary of the dataset.
def get_schema_description(df: pd.DataFrame, max_rows: int = 3) -> str:
    schema_lines = ["Columns:"]
    for col, dtype in df.dtypes.items():
        if dtype == 'object' and df[col].nunique() < 20:
            unique_vals = df[col].dropna().unique()[:5]
            schema_lines.append(f"- {col} ({dtype}) - sample values: {', '.join(map(str, unique_vals))}")
        else:
            schema_lines.append(f"- {col} ({dtype})")
    sample = df.head(max_rows).to_markdown(index=False)
    return "\n".join(schema_lines) + "\n\nSample rows:\n" + sample
This helper loops over all columns. It also includes a few sample values for things like product names, regions, or categories. F
inally, it appends a short markdown table of the first few rows, so the model has concrete examples to reason about.
This schema string is the planner’s eye on your data that allows it to pick valid column names and group-bys.
We automatically detect date columns and add helper fields like <col>_year and <col>_year_month, which makes it easier for DeepSeek to answer questions like “last year” or “by month”.
def preprocess_dates(df: pd.DataFrame) -> pd.DataFrame:
    df = df.copy()
    date_columns = []
    for col in df.columns:
        if pd.api.types.is_datetime64_any_dtype(df[col]):
            date_columns.append(col)
            continue
        if any(x in col.lower() for x in ['date', 'time', 'day']):
            try:
                df[col] = pd.to_datetime(df[col], errors='coerce')
                if df[col].notna().sum() > 0:
                    date_columns.append(col)
            except:
                pass
    for col in date_columns:
        if col in df.columns and pd.api.types.is_datetime64_any_dtype(df[col]):
            df[f'{col}_year'] = df[col].dt.year
            df[f'{col}_month'] = df[col].dt.month
            df[f'{col}_year_month'] = df[col].dt.to_period('M').astype(str)
    return df
First, we scan the columns, and if a column is already datetime or its name hints at a date (like order_date or day), we try to parse it with pd.to_datetime. For every date column, we create features like <col>_year, <col>_month, and <col>_year_month.
This preprocessing means the planner can safely reference year and year_month columns without you manually engineering time features for every dataset.
The planner can add simple row filters to the plan, and this helper turns those into pandas filters.
def apply_filters(df: pd.DataFrame, filters: list) -> pd.DataFrame:
    if not filters:
        return df
    filtered = df.copy()
    for f in filters:
        col = f.get("column")
        op = f.get("op")
        val = f.get("value")
        if col not in filtered.columns:
            continue
        try:
            val_cast = pd.to_numeric(val)
        except Exception:
            val_cast = val
        if op == "==":
            filtered = filtered[filtered[col] == val_cast]
        elif op == "!=":
            filtered = filtered[filtered[col] != val_cast]
        elif op == ">":
            filtered = filtered[filtered[col] > val_cast]
        elif op == "<":
            filtered = filtered[filtered[col] < val_cast]
        elif op == ">=":
            filtered = filtered[filtered[col] >= val_cast]
        elif op == "<=":
            filtered = filtered[filtered[col] <= val_cast]
        elif op == "contains":
            filtered = filtered[filtered[col].astype(str).str.contains(str(val_cast), case=False, na=False)]
    return filtered
For each filter, we check that the column exists, and cast the value to a number if possible, then we apply the appropriate comparison. All filters are applied sequentially, so you can naturally combine conditions like “Region contains West” and “Year >= 2021”.
This function is what connects natural-language constraints from the plan to row subsets.
Now we implement the Data Worker, which is a thin layer that reads the JSON plan and runs the corresponding pandas aggregations.
def run_analysis_plan(df: pd.DataFrame, plan: dict) -> pd.DataFrame:
    op = plan.get("operation")
    target_col = plan.get("target_column")
    group_by = plan.get("group_by") or []
    filters = plan.get("filters") or []
    metric = plan.get("metric", "sum")
    if filters:
        df = apply_filters(df, filters)
    if not op or not target_col or target_col not in df.columns:
        return df.head(20)
    if op in ("aggregate_compare", "group_by_summary", "filter_then_aggregate"):
        if not group_by:
            if metric == "sum":
                value = df[target_col].sum()
            elif metric == "mean":
                value = df[target_col].mean()
            elif metric == "count":
                value = df[target_col].count()
            elif metric == "max":
                value = df[target_col].max()
            elif metric == "min":
                value = df[target_col].min()
            else:
                raise ValueError(f"Unsupported metric: {metric}")
            return pd.DataFrame({f"{metric}_{target_col}": [value]})
        if metric == "sum":
            agg_df = df.groupby(group_by)[target_col].sum().reset_index()
        elif metric == "mean":
            agg_df = df.groupby(group_by)[target_col].mean().reset_index()
        elif metric == "count":
            agg_df = df.groupby(group_by)[target_col].count().reset_index()
        elif metric == "max":
            agg_df = df.groupby(group_by)[target_col].max().reset_index()
        elif metric == "min":
            agg_df = df.groupby(group_by)[target_col].min().reset_index()
        else:
            raise ValueError(f"Unsupported metric: {metric}")
        agg_df = agg_df.sort_values(by=target_col, ascending=False)
        return agg_df
    return df.head(20)
We start by unpacking the plan with operation, target column, grouping columns, filters, and metric parameters. T
hen, filters are applied via the apply_filters() function. If the plan references an invalid column, we fall back to returning a simple preview.
Otherwise, for supported operations, we either aggregate over the whole table or run a groupby followed by operations like sum, mean, count, max, or min, and sort the result by the metric column.
This is the heart of the tools layer: the LLM decides what to compute, and this function decides how to compute it safely with pandas.
Finally, we turn the resulting table into a chart that matches the plan’s chart_type, so we have both numbers and visuals in the output.
def generate_chart(df: pd.DataFrame, plan: dict):
    if not plan.get("need_chart") or df.empty:
        return None
    chart_type = plan.get("chart_type", "bar")
    group_by = plan.get("group_by") or []
    target_col = plan.get("target_column")
    if not target_col or target_col not in df.columns:
        return None
    fig, ax = plt.subplots(figsize=(10, 6))
    if group_by and len(group_by) > 0:
        x_col = group_by[0]
        if x_col not in df.columns:
            return None
        plot_df = df.head(15)
        if chart_type == "bar":
            bars = ax.bar(range(len(plot_df)), plot_df[target_col], color=sns.color_palette("husl", len(plot_df)))
            ax.set_xticks(range(len(plot_df)))
            ax.set_xticklabels(plot_df[x_col], rotation=45, ha='right')
            ax.set_ylabel(target_col, fontsize=12)
            ax.set_xlabel(x_col, fontsize=12)
            for i, (bar, val) in enumerate(zip(bars, plot_df[target_col])):
                height = bar.get_height()
                ax.text(bar.get_x() + bar.get_width()/2., height,
                       f'{val:,.0f}' if abs(val) > 100 else f'{val:.2f}',
                       ha='center', va='bottom', fontsize=9)
        elif chart_type == "line":
            ax.plot(range(len(plot_df)), plot_df[target_col], marker='o', linewidth=2, markersize=8)
            ax.set_xticks(range(len(plot_df)))
            ax.set_xticklabels(plot_df[x_col], rotation=45, ha='right')
            ax.set_ylabel(target_col, fontsize=12)
            ax.set_xlabel(x_col, fontsize=12)
            ax.grid(True, alpha=0.3)
        elif chart_type == "pie" and len(plot_df) <= 10:
            ax.pie(plot_df[target_col], labels=plot_df[x_col], autopct='%1.1f%%', startangle=90)
            ax.axis('equal')
        else:
            bars = ax.bar(range(len(plot_df)), plot_df[target_col])
            ax.set_xticks(range(len(plot_df)))
            ax.set_xticklabels(plot_df[x_col], rotation=45, ha='right')
        title = f"{target_col} by {x_col}"
    else:
        ax.bar([target_col], [df[target_col].iloc[0]])
        title = f"{target_col}"
    ax.set_title(title, fontsize=14, fontweight='bold', pad=20)
    fig.tight_layout()
    buf = io.BytesIO()
    fig.savefig(buf, format="png", dpi=150, bbox_inches='tight')
    buf.seek(0)
    plt.close(fig)
    return buf
We read chart_type, group_by, and target_column from the plan and build a Matplotlib figure. The above generate_chart() function returns an in-memory PNG buffer that the Streamlit app displays next to key metrics.
With these helper functions in place, the rest of the system becomes much simpler. The Planner uses get_schema_description to design the analysis, the Data Worker uses preprocess_dates(), apply_filters(), and run_analysis_plan() functions to crunch the numbers, and the generate_chart() function turns the final table into a chart.
Now that we have the planner, data worker, explainer, and helper functions in place, we can wrap everything inside a Streamlit app.
st.set_page_config(
page_title="AI Data Analyst Agent",
page_icon="📊",
layout="wide",
initial_sidebar_state="expanded"
)
st.markdown("""
<style>
.main-header {
font-weight: 700;
text-align: center;
}
.sub-header {
text-align: center;
}
.metric-card {
background-
border-radius: 0.5rem;
border-left: 4px solid #1f77b4;
}
.insight-box {
background-
border-radius: 0.5rem;
border-left: 4px solid #2ecc71;
}
</style>
""", unsafe_allow_html=True)
st.markdown("<h1 class='main-header'>AI Data Analyst Agent</h1>", unsafe_allow_html=True)
uploaded_file = st.file_uploader("Upload CSV file", type=["csv"], help="Upload any CSV file to get started")
if uploaded_file is not None:
try:
df = pd.read_csv(uploaded_file)
df = preprocess_dates(df)
except Exception as e:
st.error(f"Error loading CSV: {e}")
st.stop()
with st.expander("Preview Data", expanded=False):
col1, col2, col3 = st.columns(3)
col1.metric("Total Rows", f"{len(df):,}")
col2.metric("Total Columns", len(df.columns))
col3.metric("Memory Usage", f"{df.memory_usage(deep=True).sum() / 1024**2:.1f} MB")
st.dataframe(df.head(100), width='stretch', height=300)
st.markdown("**Numeric Columns Summary:**")
numeric_cols = df.select_dtypes(include=['number']).columns
if len(numeric_cols) > 0:
st.dataframe(df[numeric_cols].describe(), width='stretch')
st.markdown("---")
col1, col2 = st.columns([4, 1])
with col1:
question = st.text_input(
" Ask a question about your data",
placeholder="e.g., Which product category had the highest sales last year?",
label_visibility="collapsed"
)
with col2:
analyze_button = st.button("Analyze", type="primary", width='stretch')
if analyze_button and question.strip():
with st.spinner("Analyzing data..."):
schema_text = get_schema_description(df)
try:
plan, planner_reasoning = call_planner_llm(schema_text, question)
except Exception as e:
st.error(f" Planner agent failed: {e}")
st.stop()
with st.expander(" Analysis Plan", expanded=False):
col1, col2 = st.columns(2)
with col1:
st.json(plan)
with col2:
if planner_reasoning:
st.markdown("**AI Reasoning Process:**")
st.text_area("Planner Reasoning", planner_reasoning[:1000] + "..." if len(planner_reasoning) > 1000 else planner_reasoning,
height=200, label_visibility="collapsed")
try:
result_df = run_analysis_plan(df, plan)
except Exception as e:
st.error(f" Error running analysis: {e}")
st.info(" Tip: Try rephrasing your question or be more specific about the columns you want to analyze.")
st.stop()
st.markdown("---")
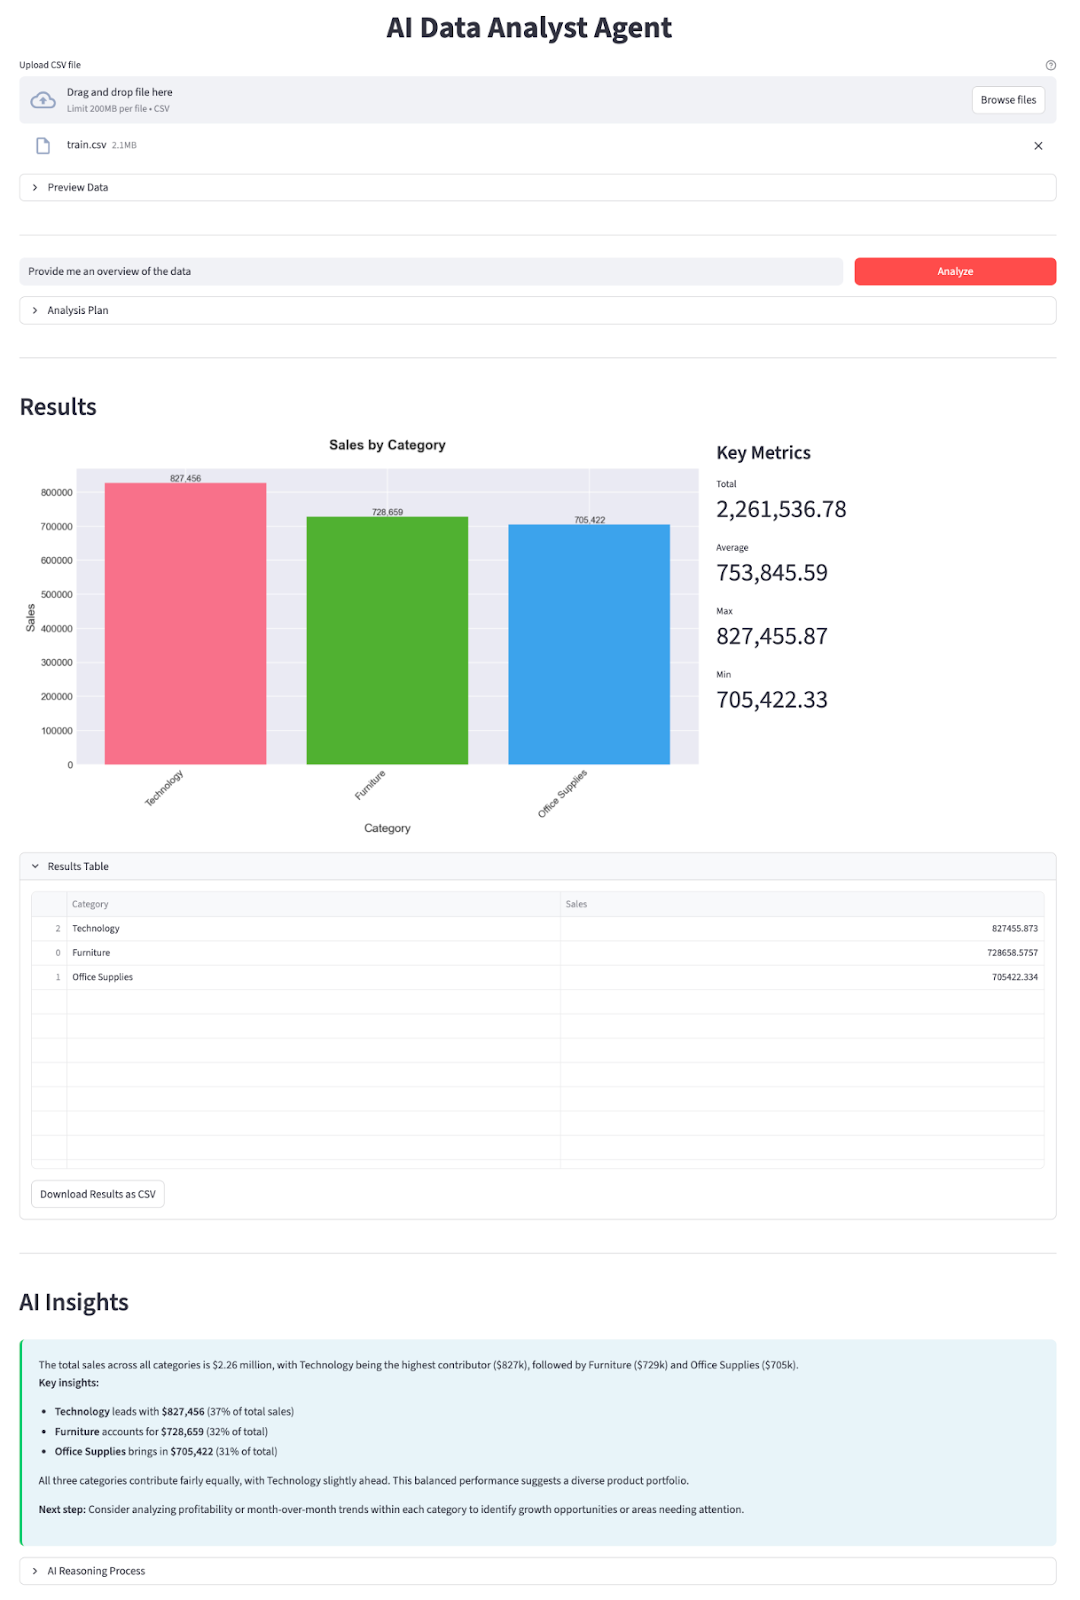
st.markdown("## Results")
chart_buf = generate_chart(result_df, plan)
if chart_buf is not None:
col1, col2 = st.columns([2, 1])
with col1:
st.image(chart_buf)
with col2:
st.markdown("### Key Metrics")
target_col = plan.get("target_column")
if target_col in result_df.columns:
st.metric("Total", f"{result_df[target_col].sum():,.2f}")
st.metric("Average", f"{result_df[target_col].mean():,.2f}")
st.metric("Max", f"{result_df[target_col].max():,.2f}")
st.metric("Min", f"{result_df[target_col].min():,.2f}")
else:
st.info("Chart generation skipped (not applicable for this query)")
with st.expander("Results Table", expanded=True):
st.dataframe(result_df, width='stretch', height=400)
csv_data = result_df.to_csv(index=False)
st.download_button(
label="Download Results as CSV",
data=csv_data,
file_name=f"analysis_results_{datetime.now().strftime('%Y%m%d_%H%M%S')}.csv",
mime="text/csv"
)
with st.spinner("Generating insights..."):
result_df_serializable = result_df.copy()
for col in result_df_serializable.columns:
if pd.api.types.is_datetime64_any_dtype(result_df_serializable[col]):
result_df_serializable[col] = result_df_serializable[col].astype(str)
elif pd.api.types.is_period_dtype(result_df_serializable[col]):
result_df_serializable[col] = result_df_serializable[col].astype(str)
result_summary = result_df_serializable.to_dict(orient="records")
explanation, explainer_reasoning = call_explainer_llm(
question=question,
plan=plan,
result_summary=result_summary,
)
st.markdown("---")
st.markdown("## AI Insights")
st.markdown(f'<div class="insight-box">{explanation}</div>', unsafe_allow_html=True)
if explainer_reasoning:
with st.expander(" AI Reasoning Process", expanded=False):
st.text_area("Explainer Reasoning", explainer_reasoning[:1500] + "..." if len(explainer_reasoning) > 1500 else explainer_reasoning,
height=300, label_visibility="collapsed")At the top, we configure the page with st.set_page_config and CSS to style the dashboard. The user first uploads a CSV, which we load into a DataFrame, pass through preprocess_dates, and show inside a Preview Data expander with row/column counts, memory usage, and a quick summary.
Behind the scenes, we build a schema with the get_schema_description() function, call call_planner_llm to get a JSON plan, and display both the plan and the model’s reasoning in an expander. The Data Worker then executes the plan with pandas, and the Results section shows a chart from generate_chart along with the key metrics.
Finally, we call call_explainer_llm with the question, plan, and result summary to generate an explanation for the AI Insights box, with an optional AI Reasoning Process expander for anyone who wants to peek under the hood.
Save everything as app.py and run:
streamlit run app.pyIn the video below, you can see an abridged version of the workflow in action:
Top DataCamp Courses
Course
Course
Course
blog
François Aubry
8 min
Tutorial
Aashi Dutt
Tutorial
Aashi Dutt
Tutorial
Aashi Dutt
Tutorial
Bex Tuychiev
Tutorial
Aashi Dutt