Course
Financial Trading in Python
4 hr
21.6K
Statistical arbitrage, often shortened to stat arb, is a family of quantitative trading strategies that use statistical relationships between securities to identify potential trading opportunities. The central idea isn't predicting whether a stock will rise or fall in isolation. It's spotting relative mispricing: when two historically linked securities temporarily diverge from their expected relationship, and betting that they'll converge.
One clarification up front: statistical arbitrage is not risk-free arbitrage. The opportunities are probabilistic, and the relationships underpinning a strategy can break down entirely. I saw this firsthand managing Asian capital markets positions at BlueCrest, where a trade that looked statistically sound on paper could unravel the moment the macro regime shifted.
This article covers how stat arb works through pairs trading and mean reversion, why cointegration matters more than correlation, and what the real risks look like in practice.
Statistical arbitrage uses historical and real-time data to identify statistical relationships between securities. When those relationships deviate from their expected state, a trader takes offsetting long and short positions, buying the relatively undervalued security and shorting the relatively overvalued one, then waits for the relationship to normalize.
The long/short structure is what reduces exposure to broad market movements. If the market drops 5%, both legs are affected roughly equally, so the profit or loss comes from the relative move between the two securities, not from market direction.
The general workflow: identify related securities, model their historical relationship, detect when the current spread deviates from historical norms, open offsetting long and short positions, then wait for convergence or an exit condition to trigger.
A simple example: If Pepsi suddenly trades at an unusually large discount to Coke with no obvious fundamental reason, a stat arb strategy buys Pepsi and shorts Coke, expecting the spread to revert. The profit comes from that spread narrowing, not from either stock moving in a particular direction.
With that basic workflow in mind, pairs trading is the most intuitive way to see it in action. You choose two historically related securities, construct a spread between their prices, and trade when that spread moves unusually far from its historical behavior: buying the cheap one, shorting the expensive one, closing if the spread converges.
Worth emphasizing: correlation alone does not establish a stable, tradable relationship. Two stocks can be highly correlated and still drift apart permanently. That's exactly what the next section covers.
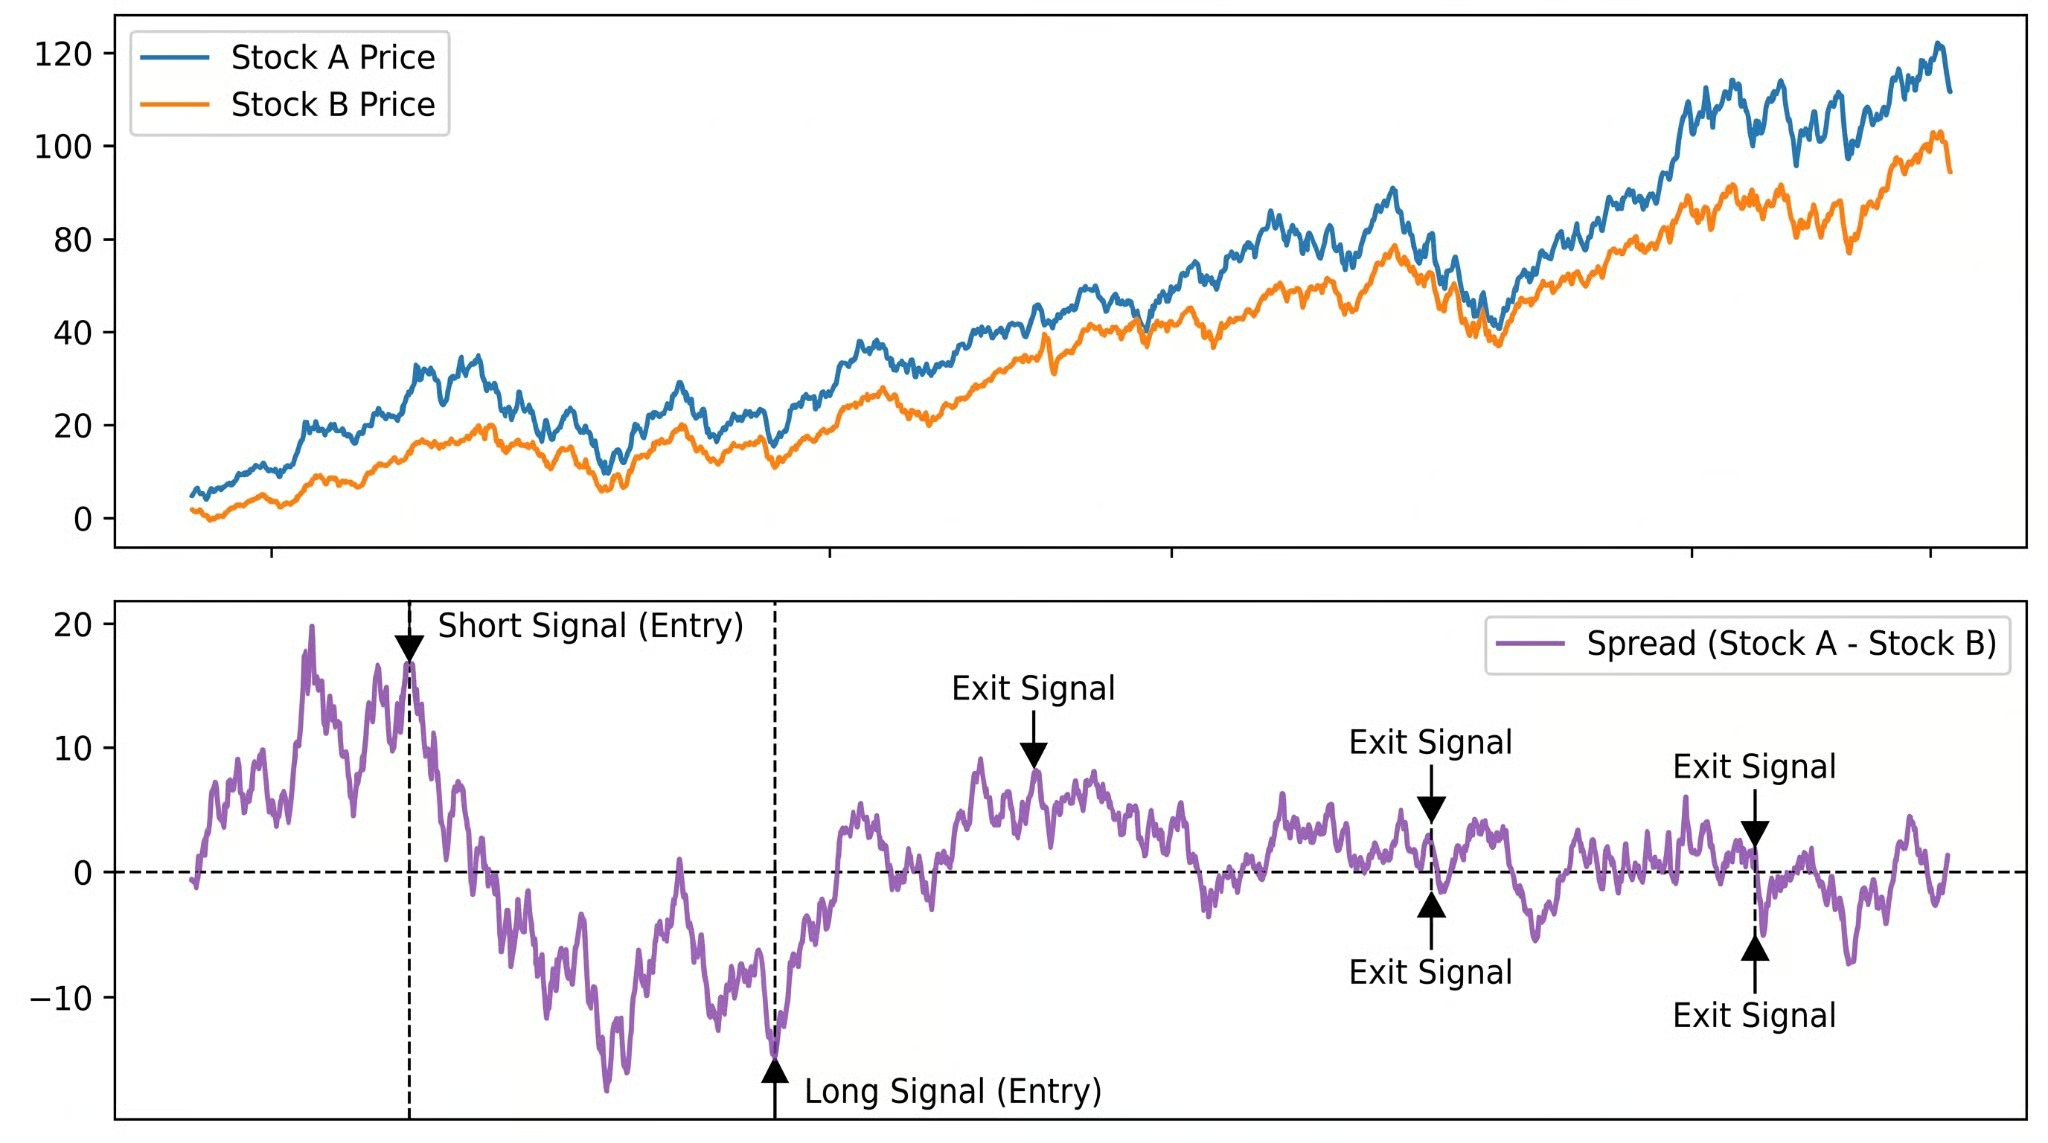
Stock A and Stock B prices (top) and their spread (bottom), with entry and exit signals marked at key reversion points. Image by Author.
Pairs trading works, when it works, because of mean reversion: the tendency for a spread that wanders from its historical average to eventually return. The key measure is the z-score: (current spread − moving mean) / standard deviation. A z-score of +2 tells you the spread is two standard deviations above its historical norm, an unusual reading that some strategies treat as a short signal.
The z-score is useful because it standardizes the signal. Instead of asking "Is this spread wide?" you ask "Is this spread unusually wide relative to how it normally behaves?" That's the question a mean reversion strategy is actually trying to answer.
Mean reversion gives us the trading logic, but it raises an uncomfortable question: how do you know a spread will actually revert rather than drift apart permanently? That's where correlation and cointegration part ways. This deserves attention:
Correlation measures the strength of the linear relationship between two variables. Two stocks can have a correlation of 0.9 and still be a poor pairs trade, because correlation says nothing about whether the spread between them is stable or mean-reverting.
Cointegration describes a longer-term equilibrium relationship between non-stationary time series. Two price series are cointegrated if some linear combination of them is stationary, fluctuating around a stable mean rather than drifting. That's the property you actually need.
Both stocks can trend upward together for years, then diverge permanently. High correlation, no cointegration, no reliable trade. Testing for cointegration using the Engle-Granger test or the Johansen procedure gives you a more defensible basis for assuming the spread will revert. Note that PCA is a different story here, and not one I'll get into in this article.
Understanding the theory is one thing; translating it into a working strategy is another. Moving from intuition to a realistic quantitative workflow involves five steps, and skipping any of them tends to produce strategies that look great on paper but fall apart in practice.
Simple pairs trading is the entry point, not the ceiling. Once you're comfortable with the core mechanics, the approach tends to expand in two directions.
Multi-asset approaches model relationships among baskets of securities rather than individual pairs. Factor-based approaches strip out systematic returns using common market or sector factors, then trade the residual mispricing. PCA scales this across hundreds of assets: identify the main sources of common variation, then trade the returns those components don't explain.
The underlying bet is the same (residual mispricings revert), but the statistical framework for finding them is different. You're no longer testing whether two series are cointegrated. You're decomposing an entire cross-section of returns and betting the leftover noise is temporary.
ML has entered the toolkit for relationship discovery, signal generation, and regime detection. It doesn't automatically improve returns and introduces its own model risk. The strategies still depend on mean reversion. ML is a more complex way to search for the same signal.
More sophisticated strategies don't eliminate the underlying risks. They often just make those risks harder to see until it's too late. These are the failure modes worth understanding before running any stat arb strategy.
The historical relationship you built your strategy on is a description of the past. Industry consolidation, regulatory changes, a shift in a company's business model: any of these can permanently alter the relationship. When that happens, the spread doesn't revert. It keeps moving against you.
Every stat arb strategy rests on statistical assumptions. If the spread isn't actually stationary, if the hedge ratio is mis-estimated, if the lookback window is poorly chosen, the model generates misleading signals. And even when the model is right, transaction costs erode returns in ways that rarely show up in naive backtests.
A strategy that looks profitable before costs can be unprofitable after them. I've seen this play out in fixed income too. The theoretical trade is clean, the actual trade is not.
Shorting isn't free. Securities lending fees and the risk of being bought in by a broker add real costs. Slippage between modeled and actual fill prices accumulates across hundreds of trades. And when many funds run similar strategies, they become exposed to each other's behavior.
The August 2007 quant meltdown happened precisely because too many equity stat arb funds liquidated simultaneously, and the resulting cascade had nothing to do with the underlying relationships those strategies were built on.
Stat arb models are calibrated to a particular market environment (a volatility regime, an interest rate cycle, a correlation structure). When that environment shifts, every assumption moves at once.
It's not one pair breaking down; it's the entire portfolio misbehaving because the statistical properties it was built on no longer hold. The spread dynamics that looked stationary in a low-volatility regime can become unstable overnight when volatility spikes, and historical lookback windows won't warn you in advance.
The most insidious risk. With enough parameters and historical data, you can fit a strategy to almost any past period, and it will degrade sharply in live trading. Out-of-sample testing is the minimum safeguard, and even that isn't always enough.
Stat arb gets conflated with several adjacent strategies.
Traditional arbitrage exploits near-mechanical price discrepancies: the same asset trading at different prices on two exchanges. The profit is close to certain if you can execute fast enough. Statistical arbitrage bets on probabilistic convergence. Entirely different risk profiles.
Pairs trading is one type of statistical arbitrage, not a synonym for the field. The terms get used interchangeably, but stat arb encompasses multi-factor models, PCA-based strategies, and machine learning approaches across large portfolios. Pairs trading is where most people start.
Algorithmic trading is a broader category describing any automated execution strategy. Statistical arbitrage is a specific family within it. High-frequency market making and trend following are also algorithmic, but neither is stat arb.
Statistical arbitrage is, at its core, a bet that relationships persist. You find two securities that have historically moved together, wait for them to diverge, and position for the gap to close. The math formalizes that intuition, but the intuition is what keeps you honest when the math says to hold, and the market says to run.
What makes stat arb genuinely hard isn't the statistics. It's that the relationships you're trading are competing with everyone else who found the same ones. When they work, they attract capital. When they attract too much capital, they stop working, sometimes gradually and sometimes all at once, as 2007 demonstrated.
For the statistical foundations, stationarity testing, and time series modeling, the Time Series Analysis in Python course is the right next step. For backtesting and quantitative workflows, the Financial Trading in Python course covers implementing and evaluating trading strategies in practice.
Learn with DataCamp
Course
Course
Course
blog
Kurtis Pykes
13 min
blog
Shawn Plummer
9 min
podcast
Richie Cotton
30 min
Tutorial
Ryan Sheehy
5 min
Tutorial
Dario Radečić
9 min
Tutorial
Ted Kwartler
15 min