Track
SQL Fundamentals
26 hr
When I first wanted to learn BigQuery, the biggest barrier wasn’t the SQL syntax, but the fear of accidentally running up a bill. I didn’t want to add a credit card just to try things out.
The BigQuery Sandbox is Google’s answer to this problem. It offers a zero-cost, risk-free entry point to one of the most powerful data warehouses in the world. You get most of the core analytical capabilities of BigQuery’s SQL engine without providing a single piece of billing information.
In this article, I’ll show you how to get started with the BigQuery Sandbox, what you can (and cannot) do with it, practical workflows I use every week, and when it’s time to upgrade to a full project. Whether you’re a junior data practitioner building confidence or a seasoned professional prototyping new ideas, the Sandbox is the safest way to explore enterprise-grade data warehousing for free.
If you are new to cloud data, I recommend starting with the Introduction to BigQuery course to lay a foundation.
The BigQuery Sandbox is a no-cost, credit-card-free entry point to Google Cloud’s fully managed data warehouse. It allows users to explore BigQuery’s core analytical tools and the Google Cloud Console without creating a billing account or committing to a payment method. It operates within the BigQuery Free Tier limits, but enforces specific expiration policies to maintain a lightweight environment.
To understand the value of the Sandbox, we first need to look at what it actually provides to the user.
The BigQuery Sandbox removes the biggest friction for beginners and students: the need to set up payment details before even running your first query. You simply sign in with a regular Google account, create a project, and you’re ready to query public datasets immediately.
You get the same Standard SQL engine used by Fortune 500 companies, plus up to 1 TB of processed query data and 10 GB of active storage every month. It’s completely free, subject to BigQuery’s free tier quotas and limits.
To get job-ready with BigQuery, I recommend using our Top BigQuery Interview Questions for practice.
For new users, there may be some confusion about the differences between the Sandbox, the free tier, and the free trial. Here’s how I decide which to use:
My rule of thumb: Start in Sandbox for anything educational or proof-of-concept. Upgrade to Free Tier when you need permanent storage. Jump to paid only when you need streaming, scheduled transfers, or heavy production loads.
Getting into the Sandbox is straightforward, but there is one specific workflow you must follow to avoid being prompted for a credit card.
The only hard requirement for using the Sandbox is a standard Google Account, such as a personal Gmail account or a Google Workspace account. You do not need an existing Google Cloud project to begin.
I recommend starting by navigating directly to the Google Cloud Console. If you have never used Google Cloud before, you will be greeted with a terms of service agreement that you must accept before proceeding to the dashboard.
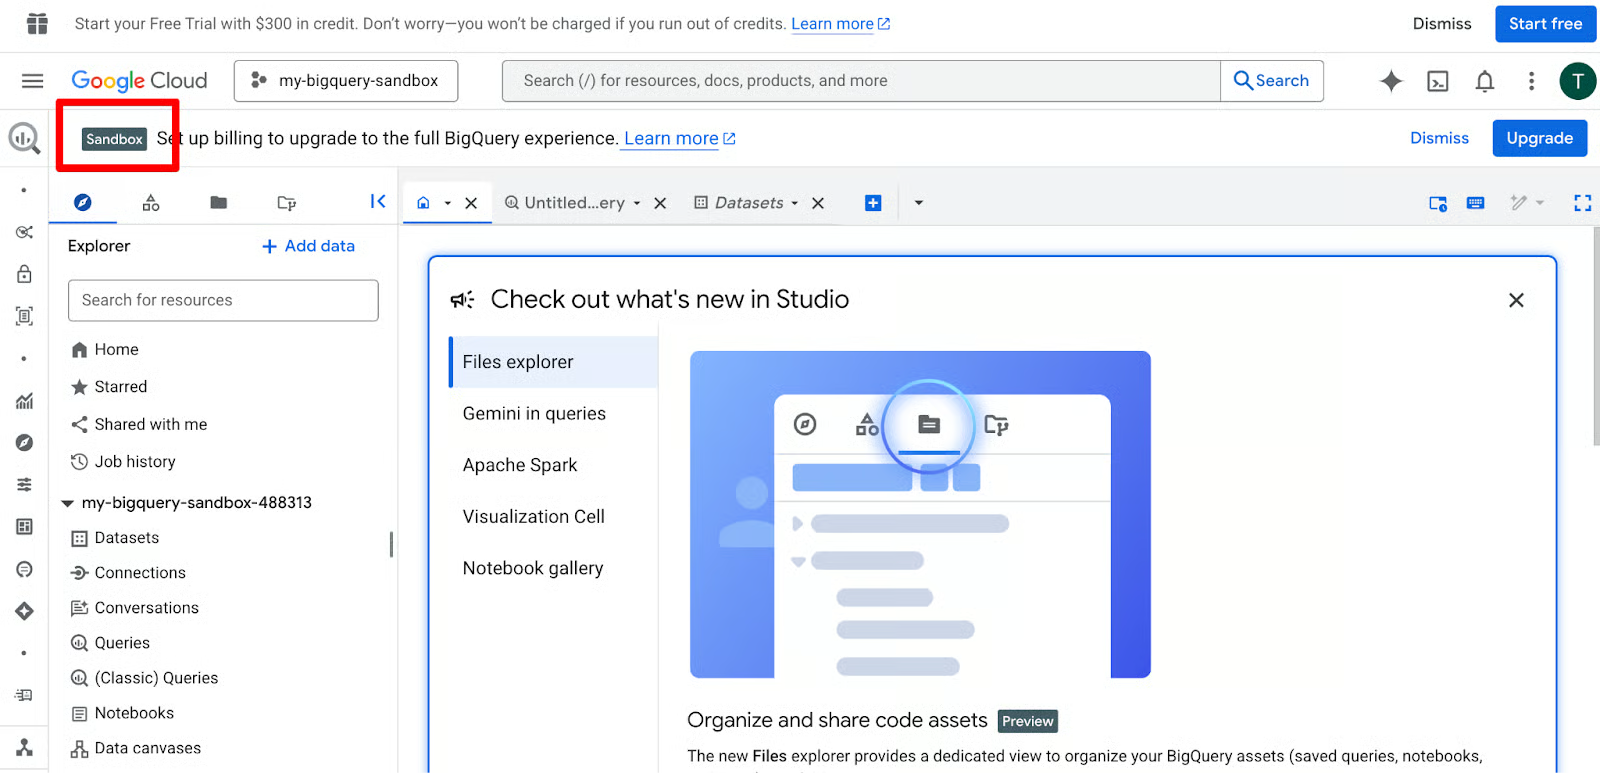
When prompted, enable the BigQuery API — it takes just a few seconds.
The BigQuery interface is divided into three main areas that you will use constantly. On the left is the Explorer pane, where your datasets and tables live. The middle section is the Query Editor, and the bottom section displays your Results grid.
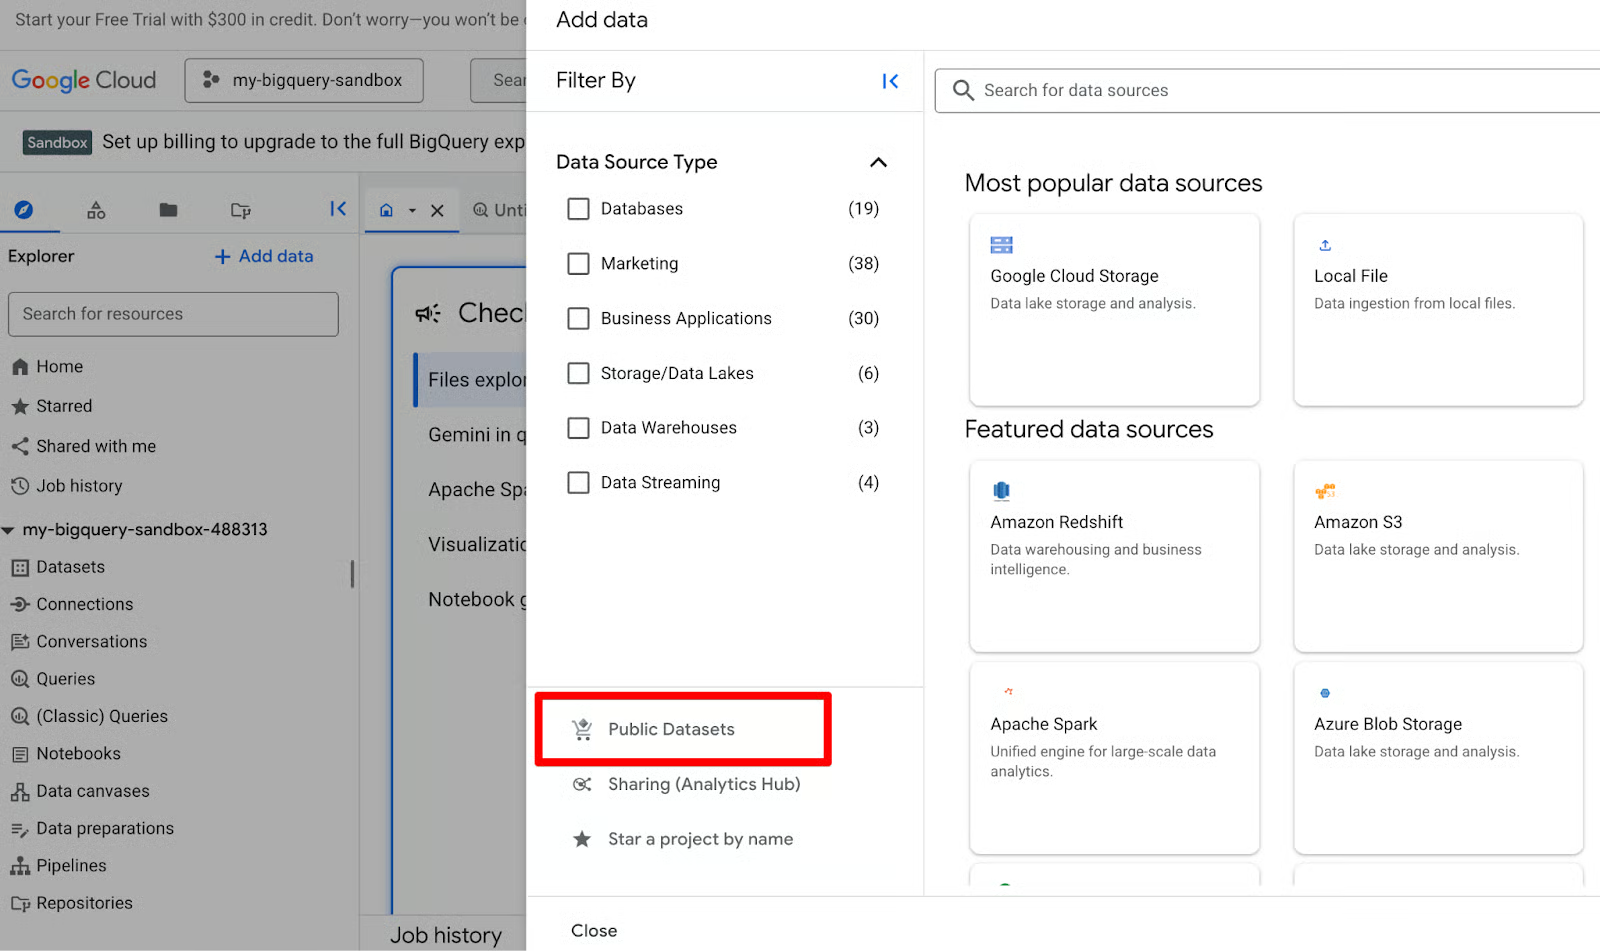
In my experience, the best way to get comfortable is to pin a public dataset immediately. Click + Add data in the Explorer pane, select Public Datasets, and search for bigquery-public-data. This gives you instant access to massive datasets about many different topics, such as NYC taxi trips or GitHub repos, without having to upload your own files.
Once your interface is configured, you can begin exploring the high-end features that BigQuery provides, even to free users.
In the search bar at the top of the gallery, type “GitHub”. Look for the tile labeled GitHub Activity Data dataset (bigquery-public-data.github_repos). It is perfect for practicing complex joins and string manipulations because of its rich metadata.
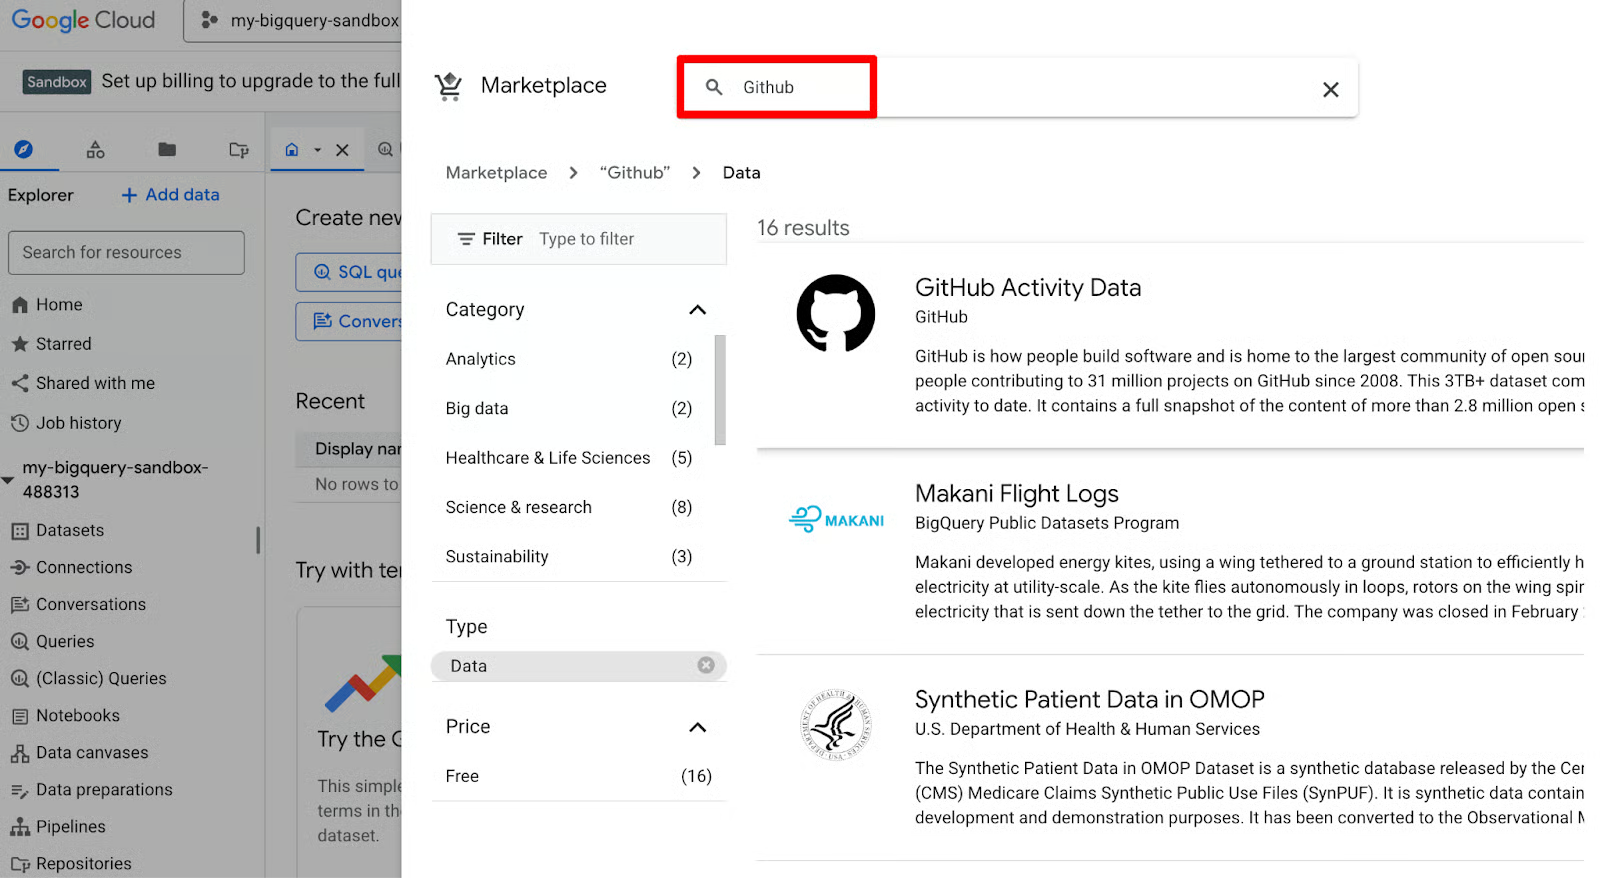
Click on the GitHub tile to view the Product details page. From here, click the View dataset button. This will redirect you back to the BigQuery editor. Next, click the star button to star/pin the public dataset.
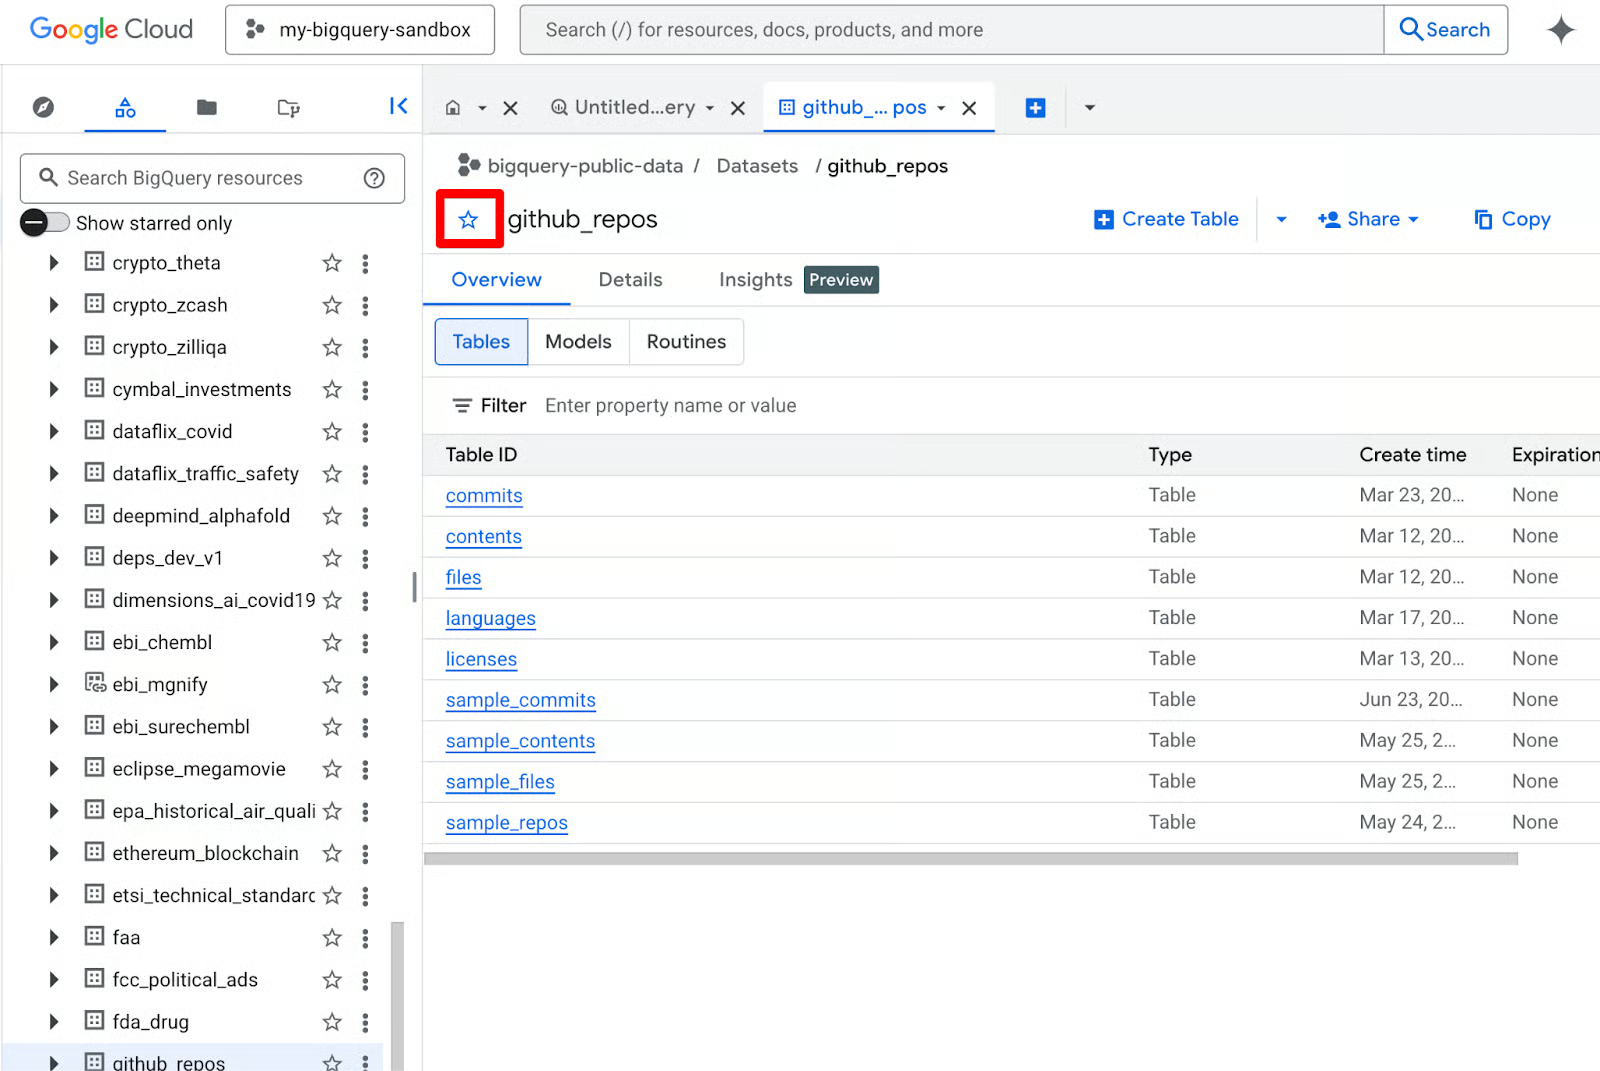
Now that you have pinned the data, you can expand the tree in the Explorer pane to see individual tables like github_repos or commits. You are now ready to start using the actual analytical features of the platform.
The Sandbox isn't just a viewer mode; it is a fully functional SQL engine that supports advanced analytical workloads. You have access to many high-level features that professional data engineers use. However, some capabilities (including DML, streaming, and Data Transfer Service) are not available in Sandbox.
Sandbox gives you the full power of BigQuery’s Standard SQL engine — the same one companies like Spotify and Twitter use for petabyte-scale analysis. You can write everything from basic SELECT * FROM … to complex window functions, common table expressions (CTEs), ARRAY/STRUCT handling, and geospatial queries with GEOGRAPHY types.
When you write a query, BigQuery provides a Query Validator icon in the top right of the editor. I found this validator to be a lifesaver for Sandbox users. It tells you exactly how much data your query will process before you run it. Since you have a 1TB monthly limit, checking this estimate helps you avoid burning through your quota on a single inefficient SELECT * statement.
Let’s run some real queries on the GitHub Activity dataset we looked at earlier. These are safe, scan very little data, and teach progressively more SQL concepts.
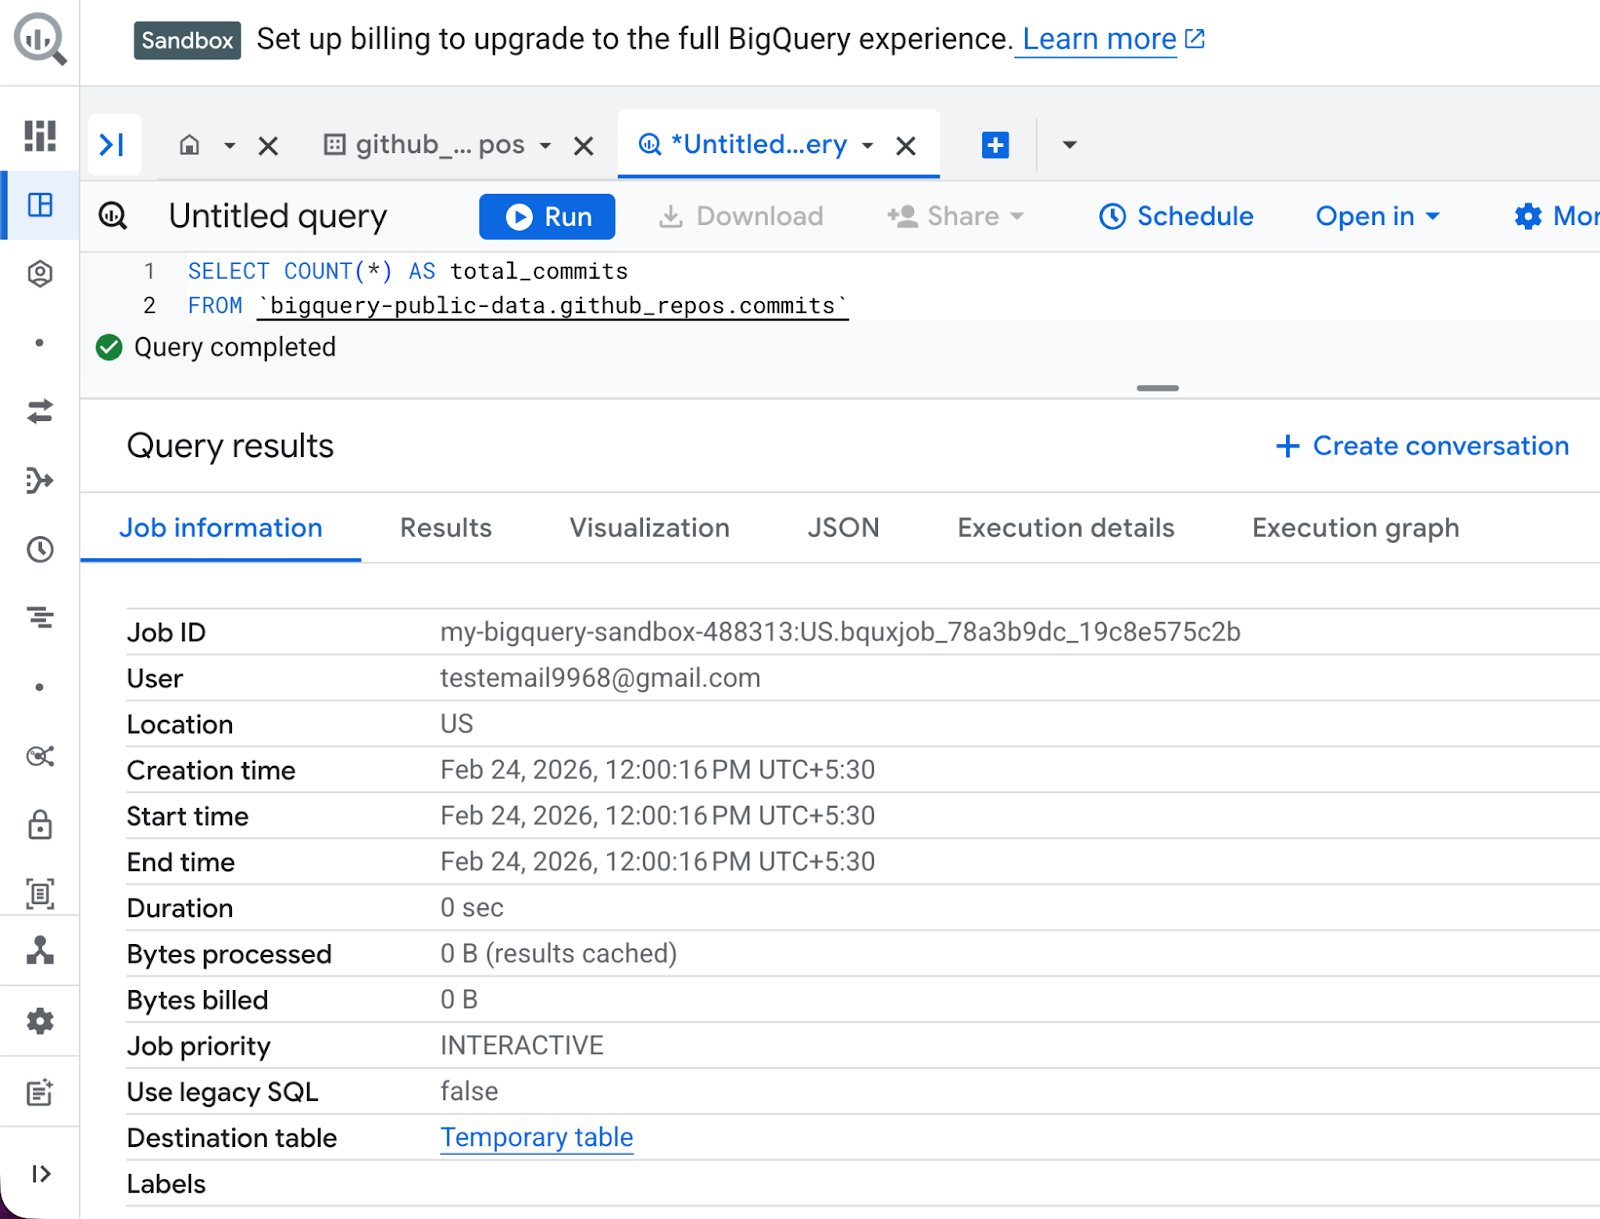
In the Query Editor (center panel), delete any existing text. Next, type the following query:
SELECT COUNT(*) AS total_commits
FROM bigquery-public-data.github_repos.commits
At the bottom, you will see a small number like “This query will process X MB”. After you’ve clicked Run, the results appear in the bottom grid in seconds.
This query is my “hello world” for every new public dataset — it tells me the scale instantly. What you’ll see:
The results grid shows one row: total_commits with a huge number (hundreds of millions).
In the Job Information tab, job metadata is displayed, including bytes processed, runtime, and slot usage.
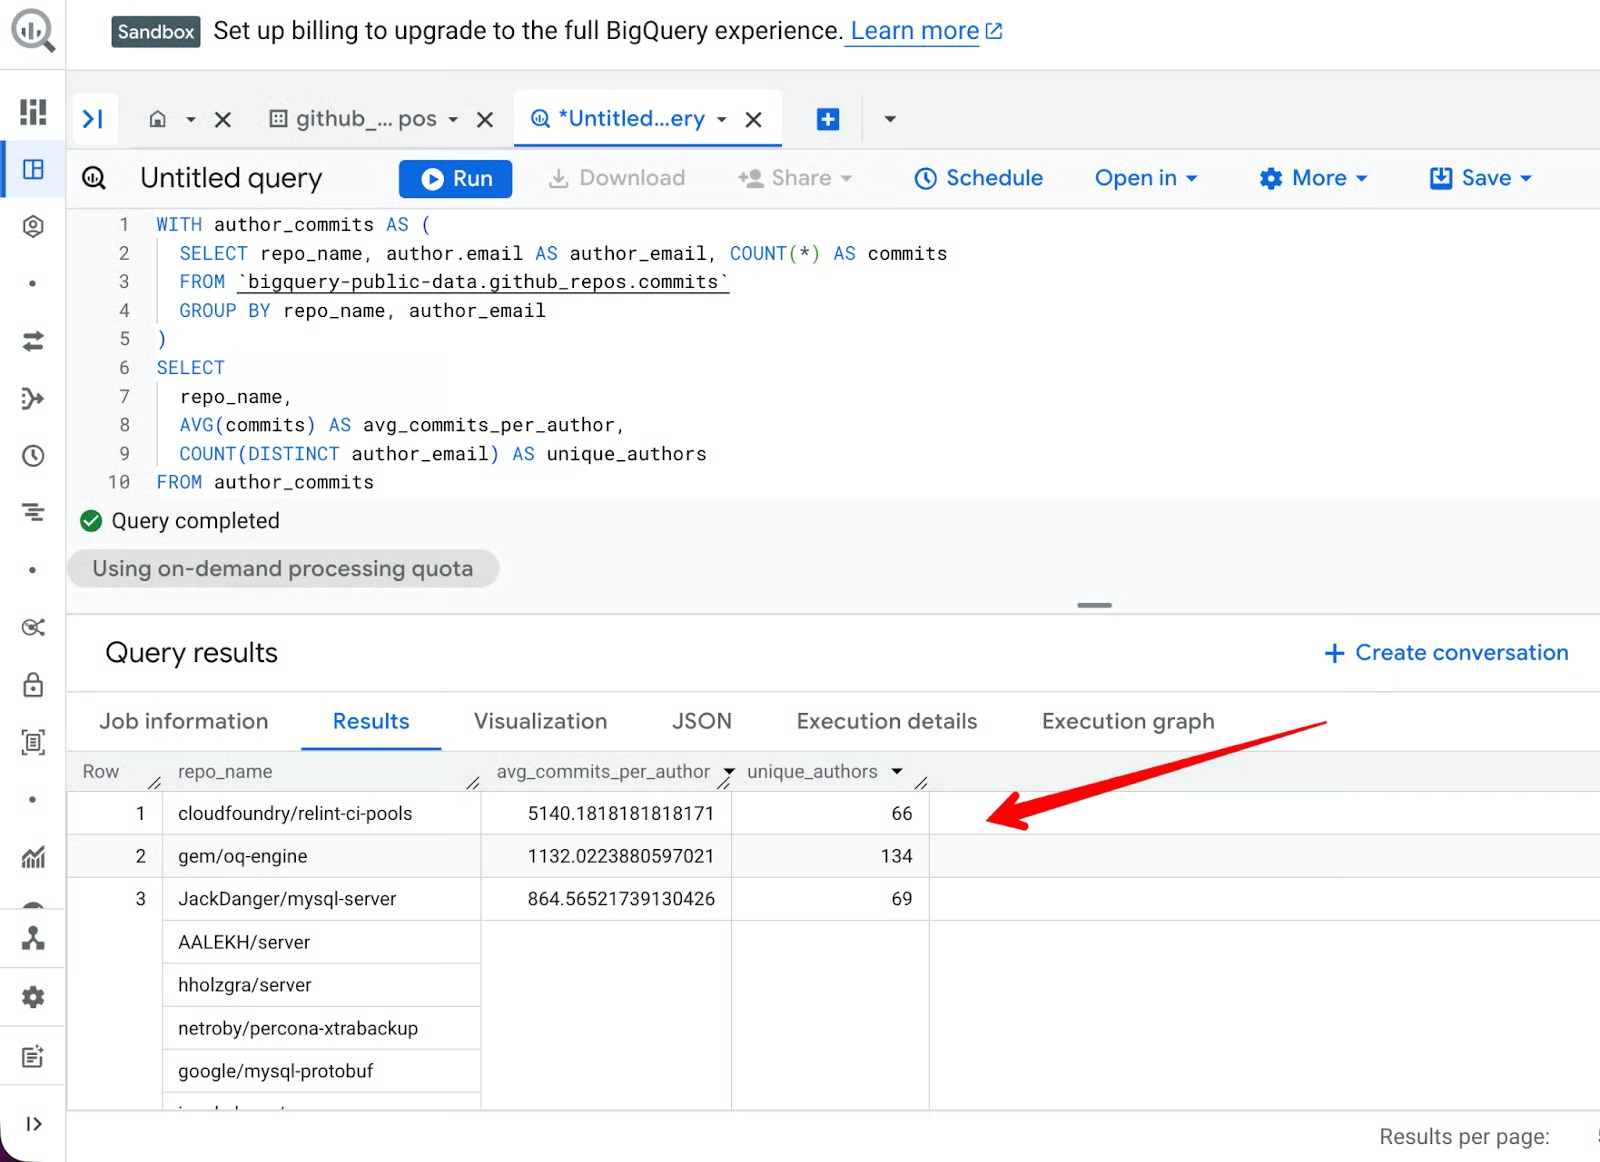
We can also use a more complex query:
Creates a temporary table of repositories, authors, and commits
Aggregates by repository
Filters by repositories with more than 50 distinct author_email entries
Shows the top 10 results ordered by average number of commits per author
WITH author_commits AS (
  SELECT repo_name, author.email AS author_email, COUNT(*) AS commits
  FROM bigquery-public-data.github_repos.commits
  GROUP BY repo_name, author_email
)
SELECT
  repo_name,
  AVG(commits) AS avg_commits_per_author,
  COUNT(DISTINCT author_email) AS unique_authors
FROM author_commits
GROUP BY repo_name
HAVING unique_authors > 50
ORDER BY avg_commits_per_author DESC
LIMIT 10
Here’s what the result looks like:
BigQuery is excellent at string manipulation. If you want to find all repositories that mention “data-science” or “machine-learning” in their names, you can use the REGEXP_CONTAINS function:
SELECT
   repo_name
FROM bigquery-public-data.github_repos.sample_repos
WHERE REGEXP_CONTAINS(repo_name, r'data-science|machine-learning')
LIMIT 20;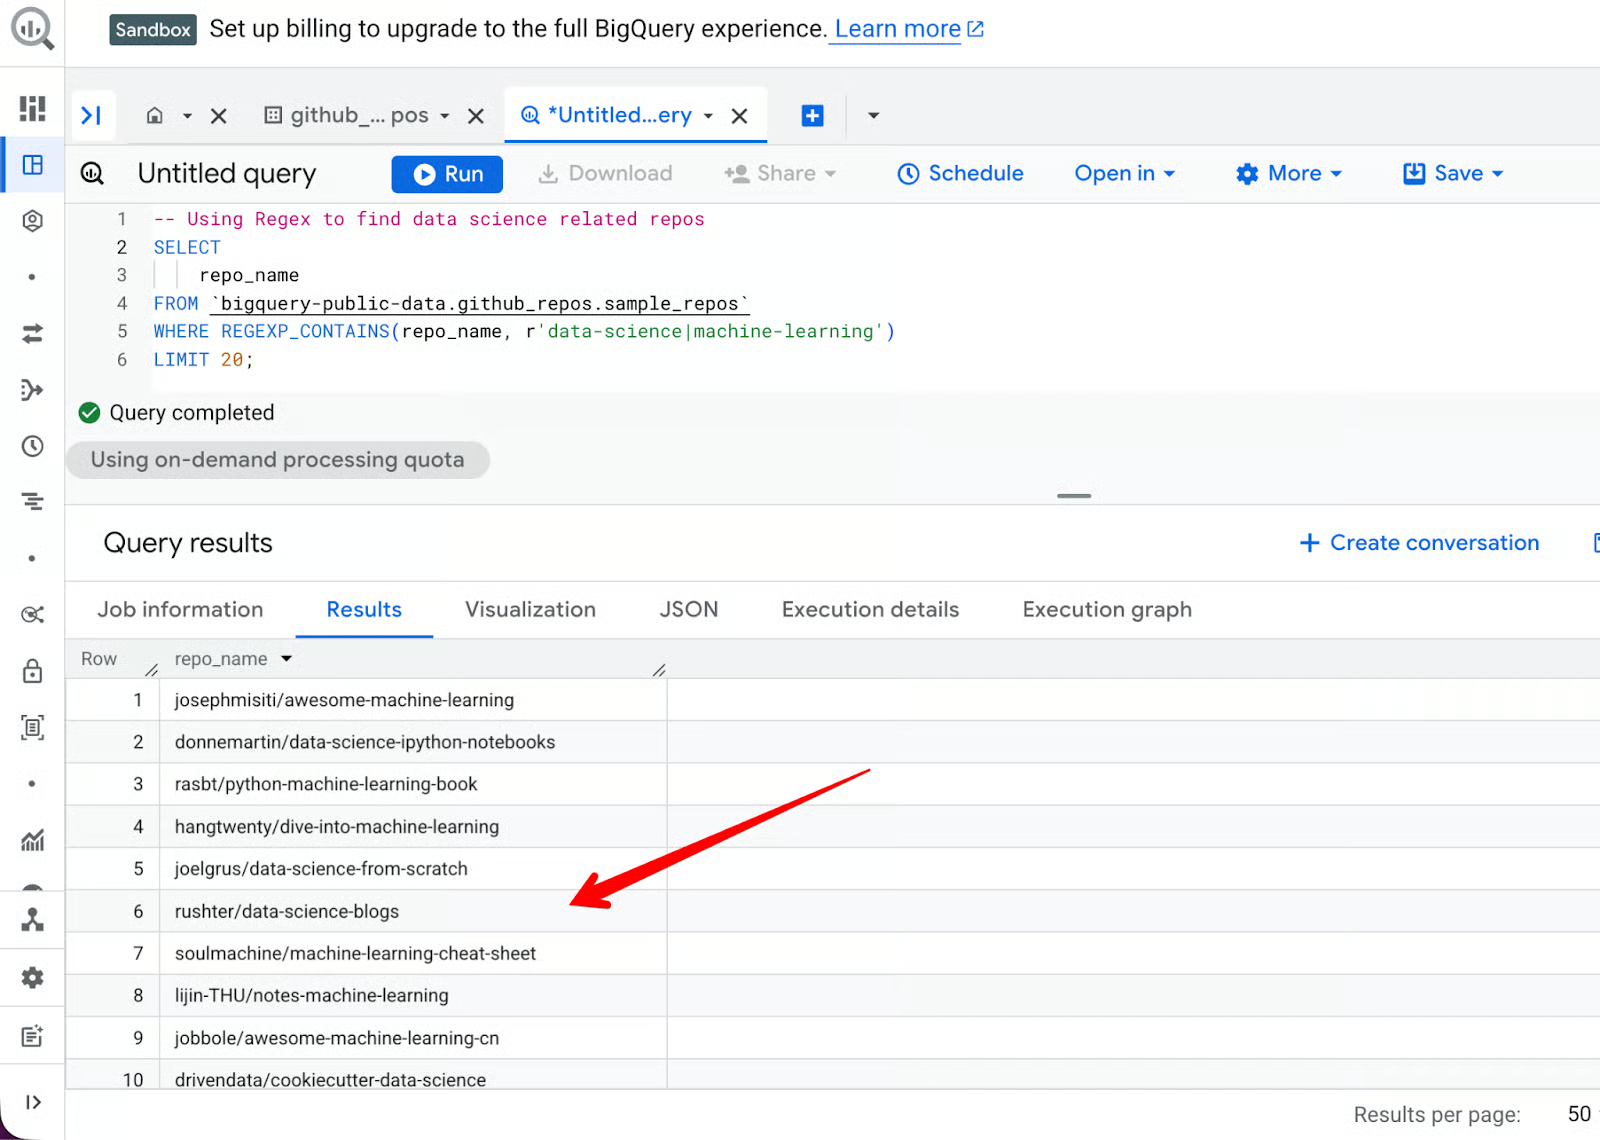
While public datasets are excellent for practice, the real power of the Sandbox is unlocked when you analyze your own data. Whether it is a small spreadsheet or a log file, BigQuery provides several ways to get your data into the cloud.
In my experience, the data ingestion process in BigQuery is one of the most user-friendly in the enterprise market. You don't need to write complex ETL (Extract, Transform, Load) scripts just to get started. You can simply use the built-in wizard to point to your data source.
This is the most common path for beginners. BigQuery supports several formats, including CSV, JSON (newline-delimited), and Avro.
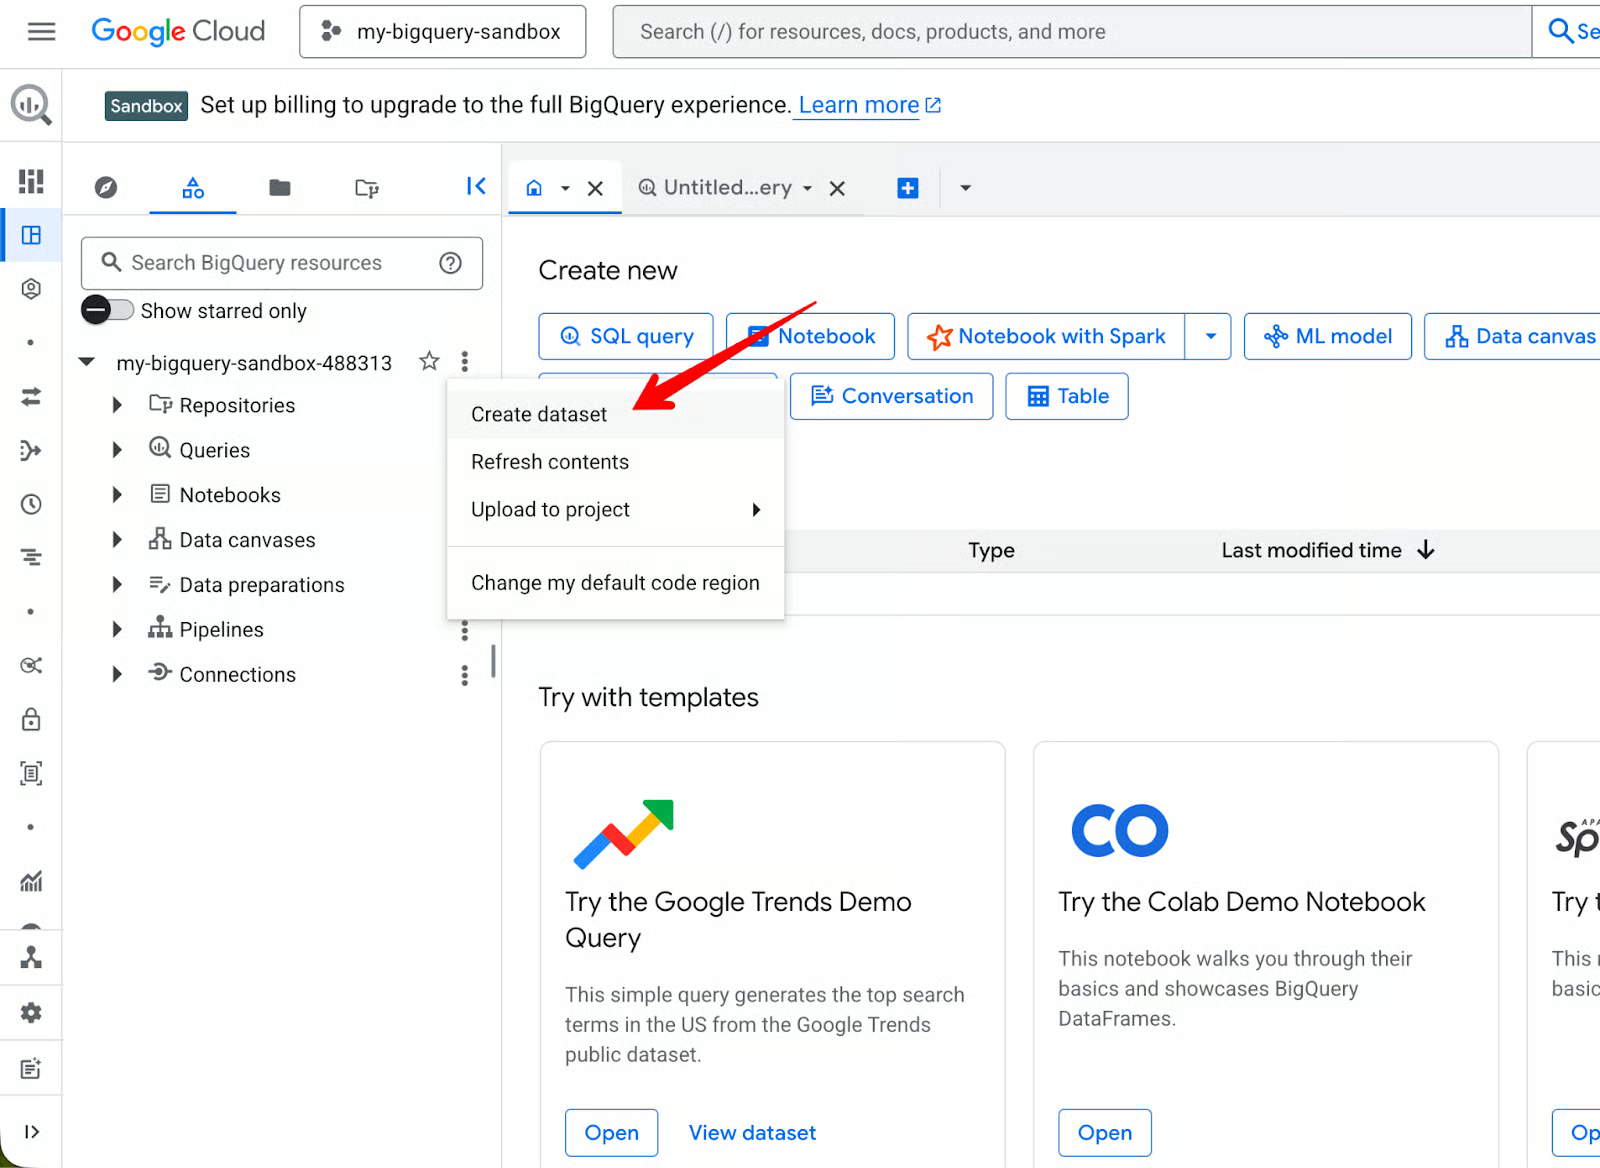
Steps to upload a file:
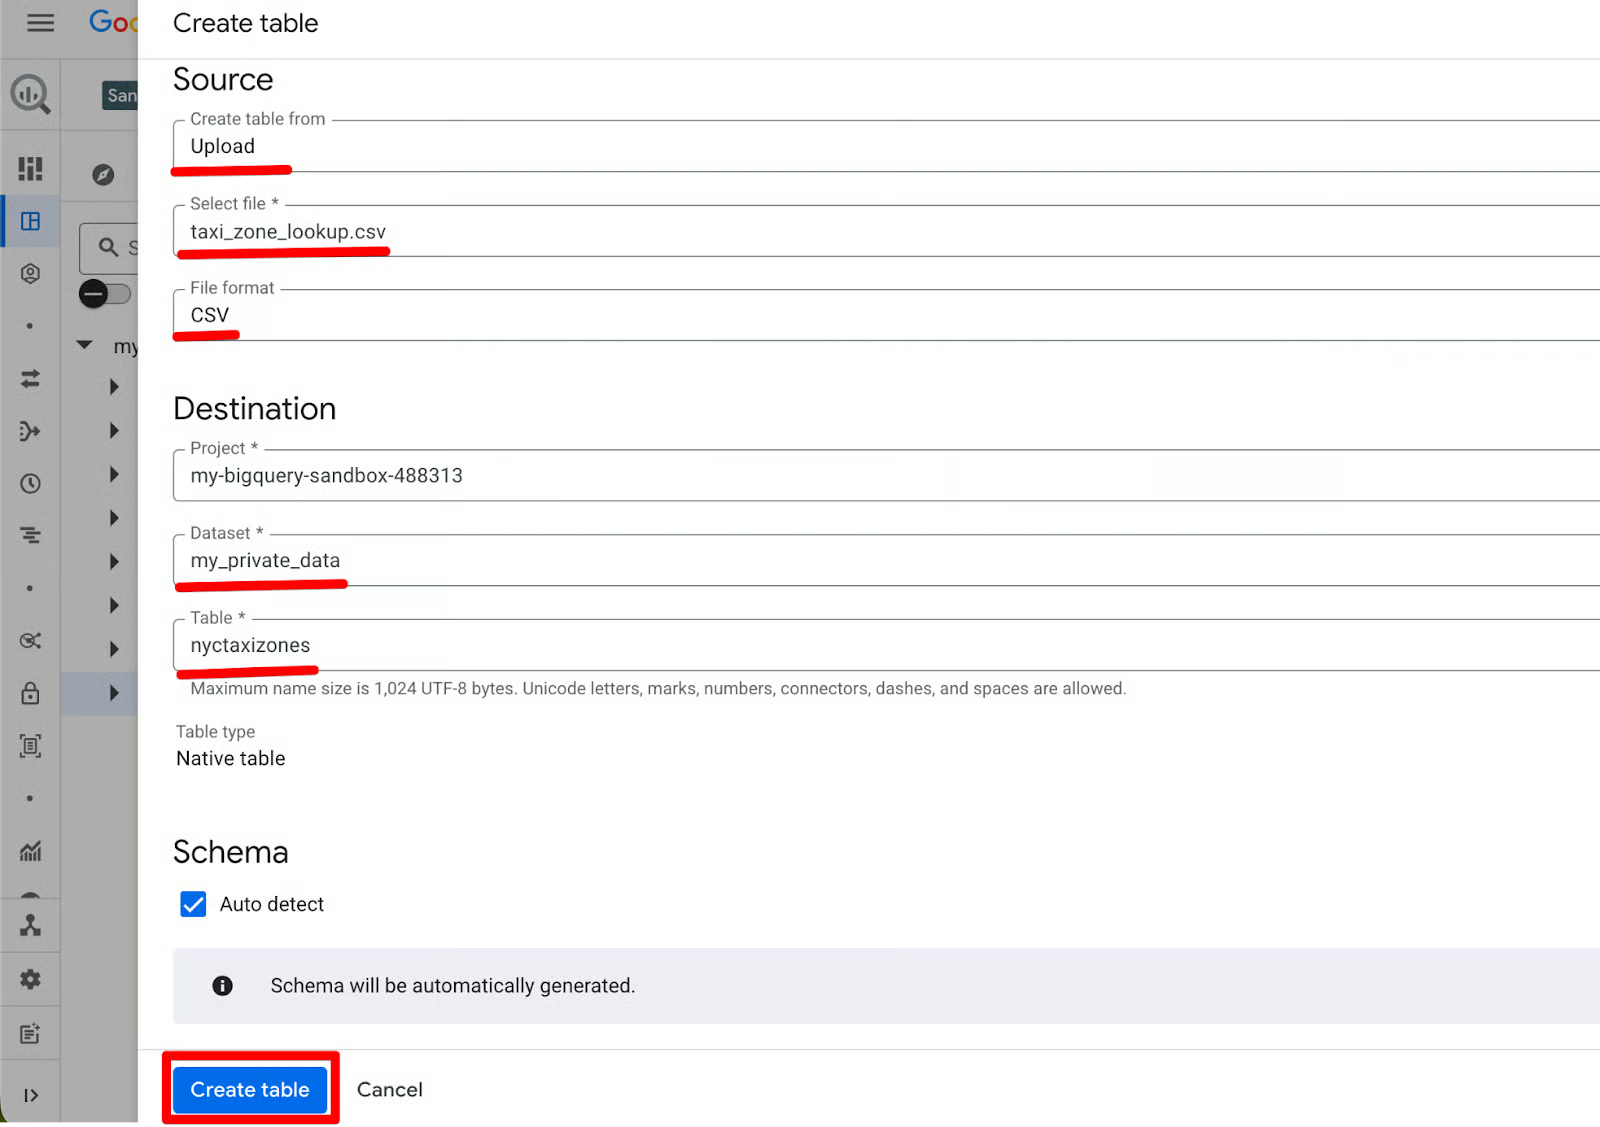
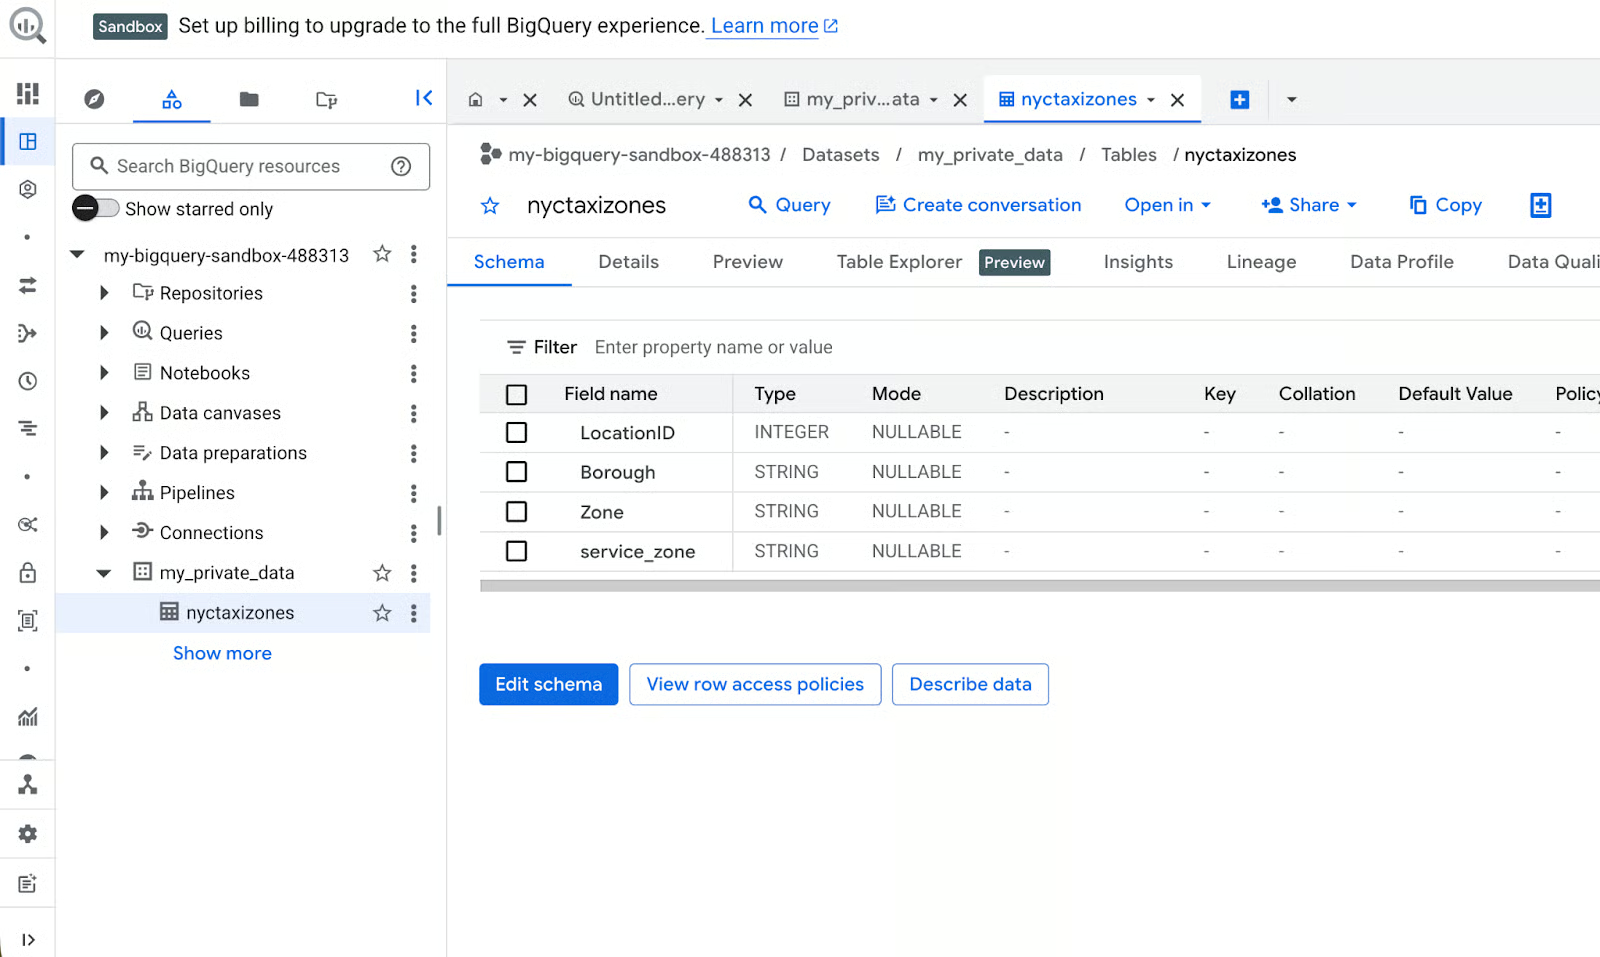
BigQuery uploads the file, infers the schema, and creates the table. You can now query it immediately.
Why this is great in Sandbox:
Zero cost: the upload is free.
Auto-schema inference saves time when you’re just testing.
Perfect for practicing data cleaning or JOINs with public datasets.
If your data is already in the cloud, you can link BigQuery directly to those sources. This is particularly useful for Google Sheets users who want to query their spreadsheets with SQL, which I’ll use as an example case here.
Steps to import from Drive:
personal_expenses). You can let BigQuery auto-detect the schema or define it manually. 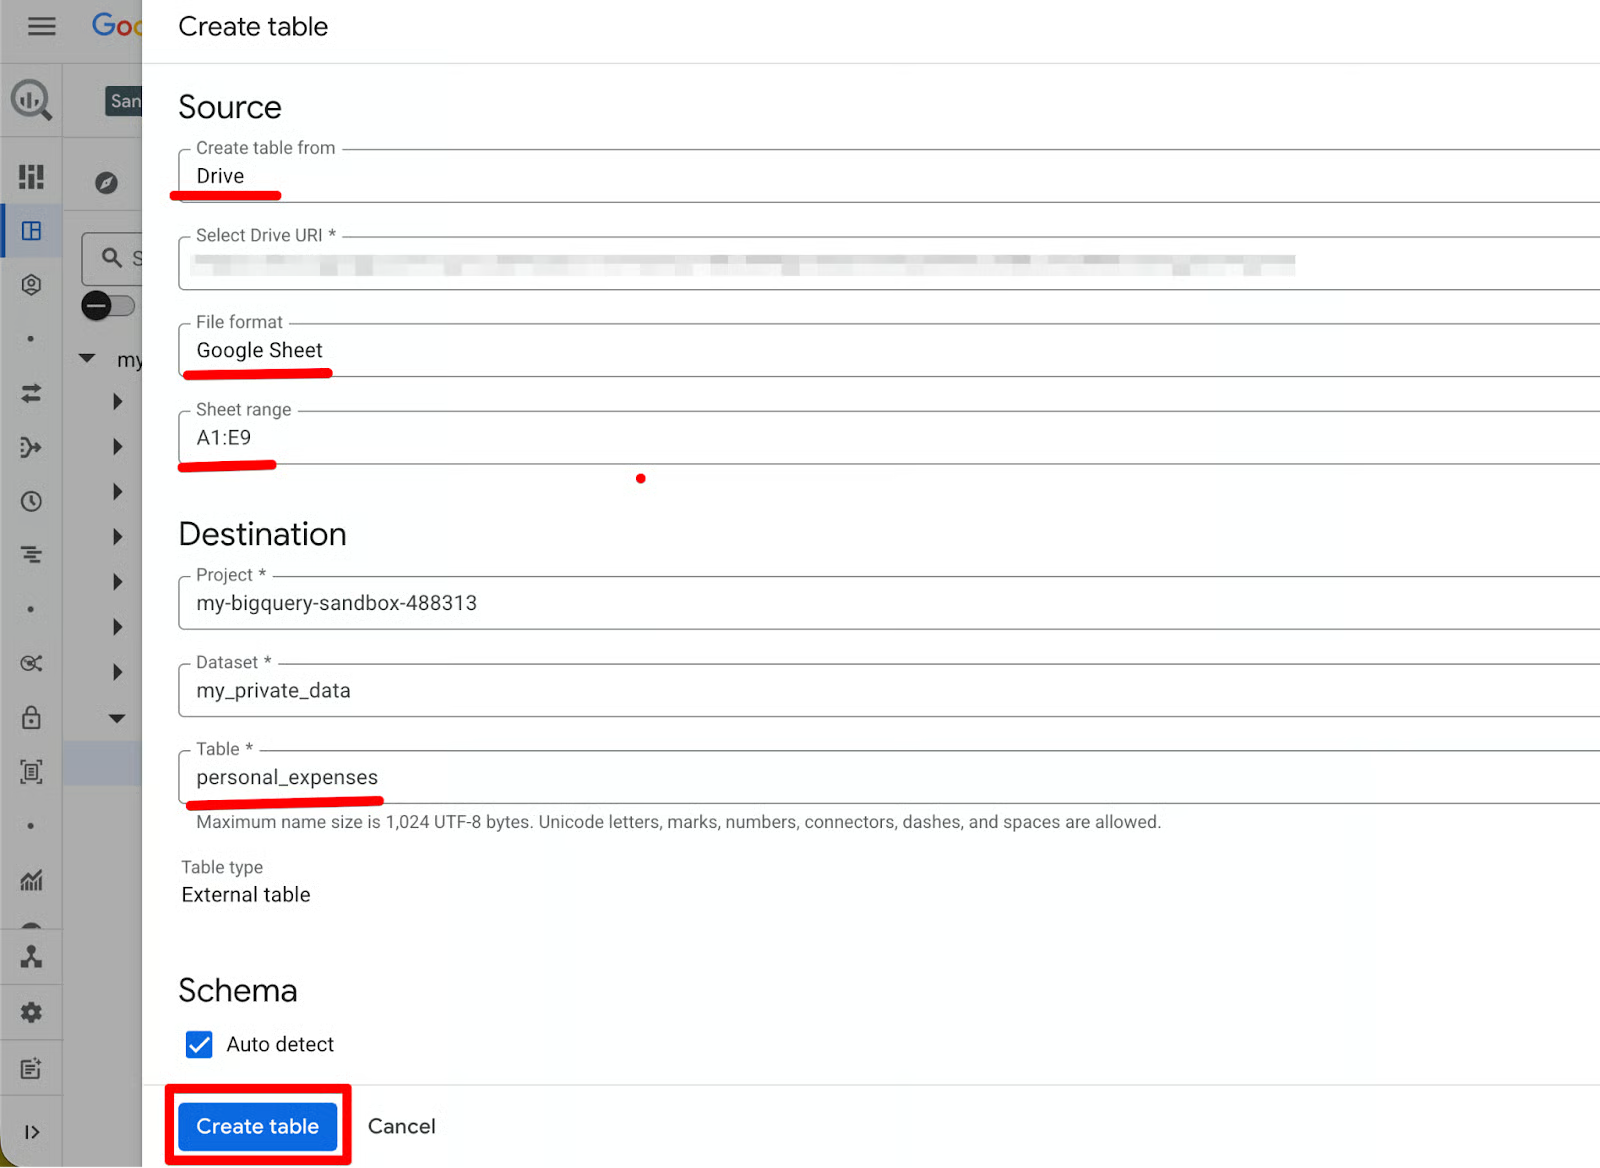 Why I use this:
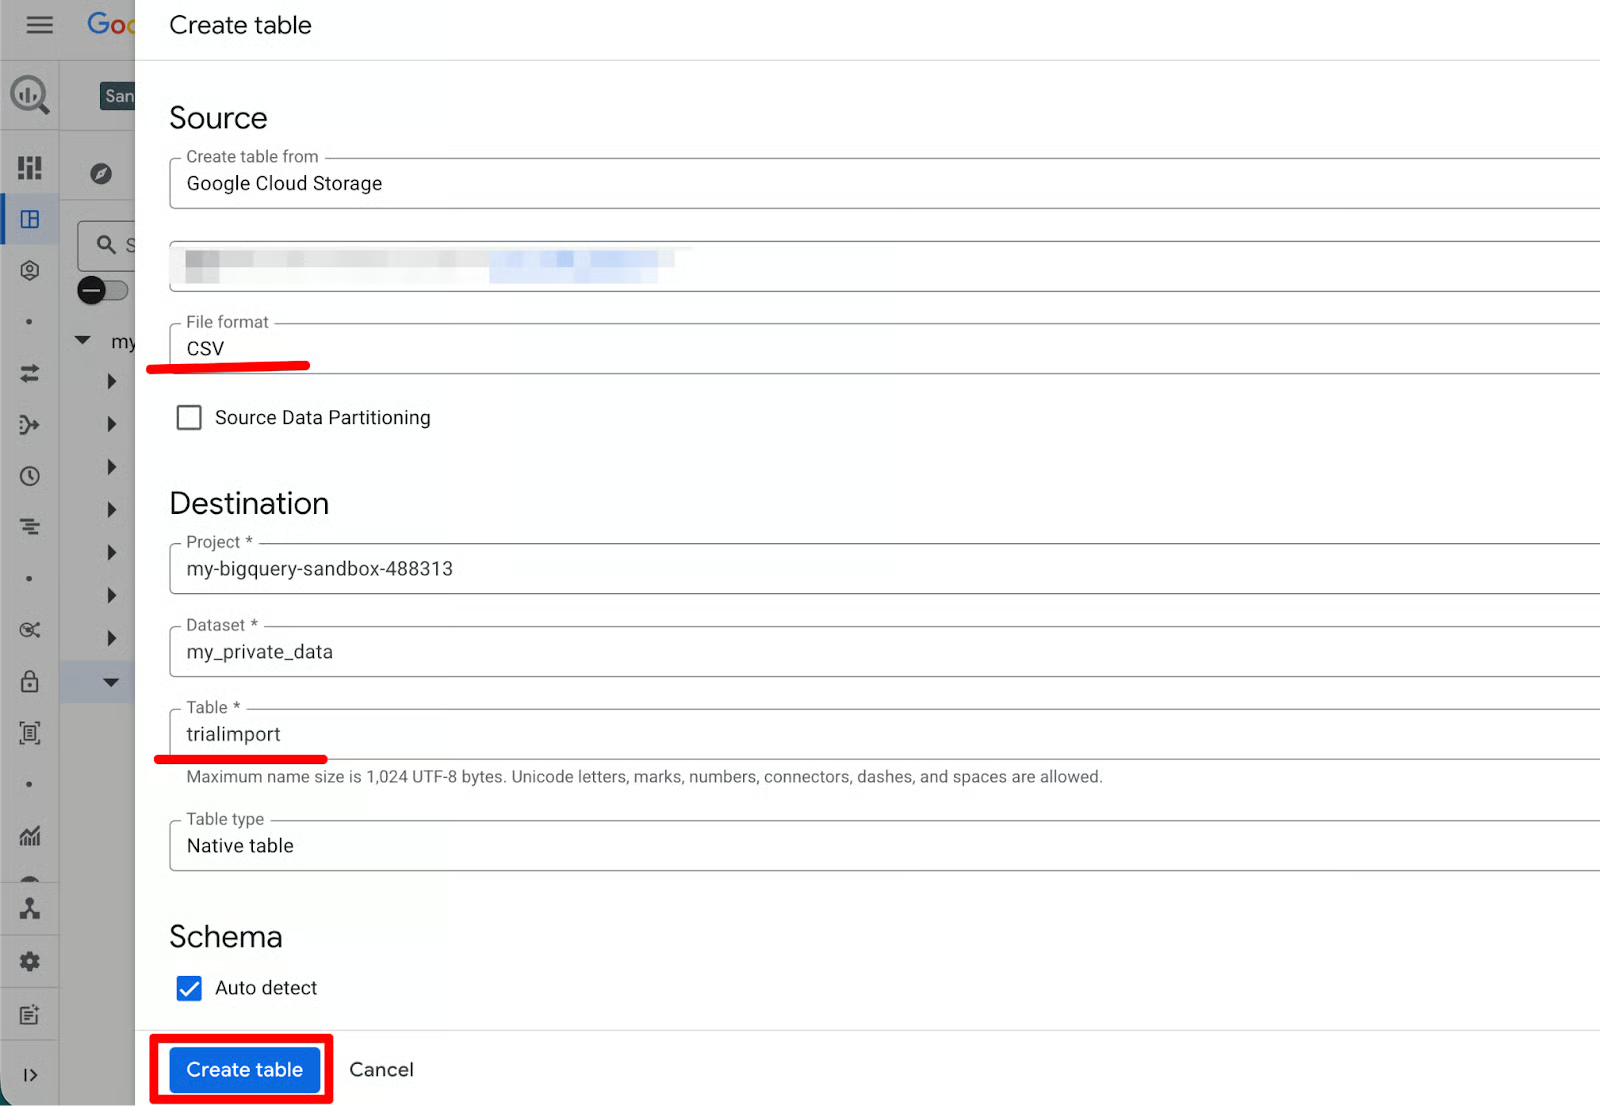
If you have data in GCS (even a free bucket), this is the most scalable option in Sandbox. BigQuery also offers import from Azure Blob Storage or Amazon S3. For a comparison of the 3 major cloud ecosystems, I recommend reading our guide on AWS vs. Azure vs. Google Cloud.
Steps to import from GCS:
BigQuery loads from GCS, creates the table, and you’re good to go. All ingested tables still follow the 60-day expiration rule. That means it's great for testing pipelines, but remember to upgrade if you need permanent storage.
Raw SQL is rarely the final deliverable of a data project. To truly communicate your findings, you need to turn those rows of data into visual stories that stakeholders can understand at a glance.
The BigQuery Sandbox is designed to be a sticky part of the Google ecosystem, meaning it connects to Google’s business intelligence tools with almost zero configuration. I found that the Open in menu in the results pane is the most important feature for a beginner, as it acts as a central hub for moving data into the visual world.
In my experience, this one-click connectivity is the Sandbox’s biggest advantage for a data analyst. It removes the need to manage complex database drivers or local installations that usually plague enterprise data workflows.
The Visualization tab is the fastest way to see charts without leaving the console: it’s literally one click away. Here’s how it works step by step:
Run any query in the Query Editor (e.g., the GitHub top languages example we used earlier).
Once results load in the bottom grid, look at the tabs above the results table, click the Visualization tab (it sits right next to “Results”, “JSON”, “Execution details”, and “Execution graph”).
BigQuery automatically generates a preview chart. Often, it is a bar or scatter plot based on your data (e.g., language on the x-axis, commit_count on the y-axis).
On the right side, the visualization configuration panel opens automatically to give you the chance to edit the graph:
You can hover over points/bars for exact values, or zoom/pan if the chart is too large.
Another way to visualize your results is through the Looker Studio integration. Once your query finishes running in the editor, look for the Open in button on the right side of the results pane and select Looker Studio. 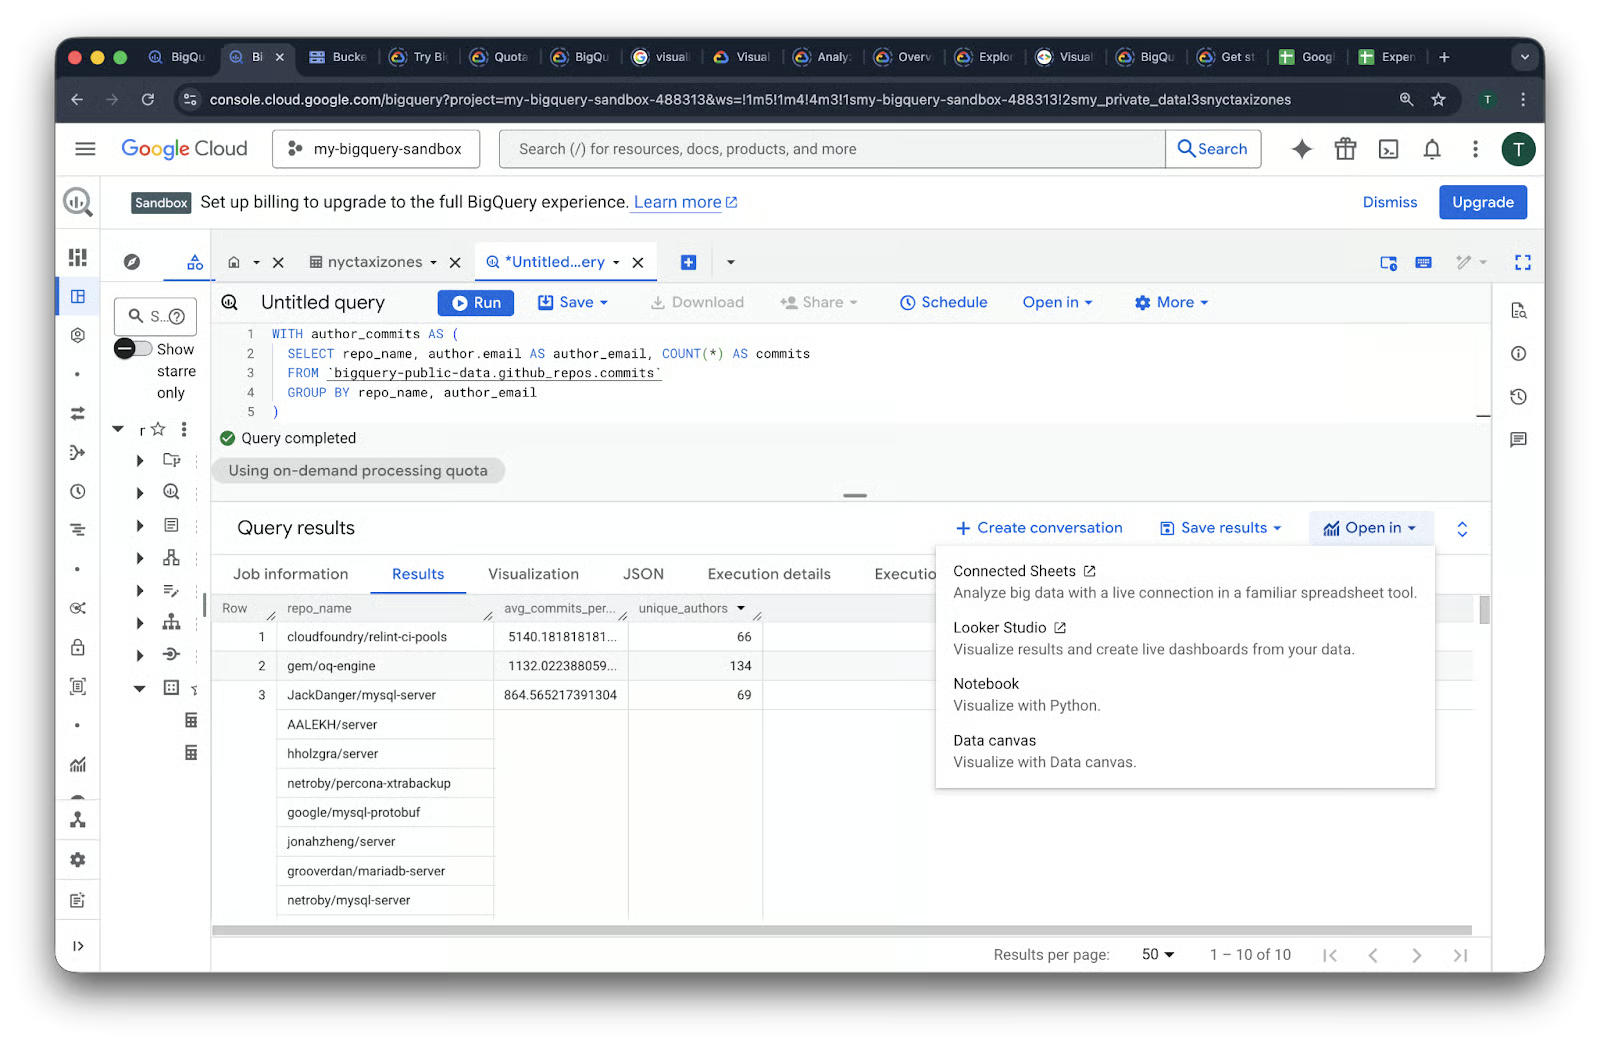
This opens a new tab where you will be prompted to acknowledge data access. Once the access is acknowledged, you see your query results already pre-loaded as a dynamic data source.
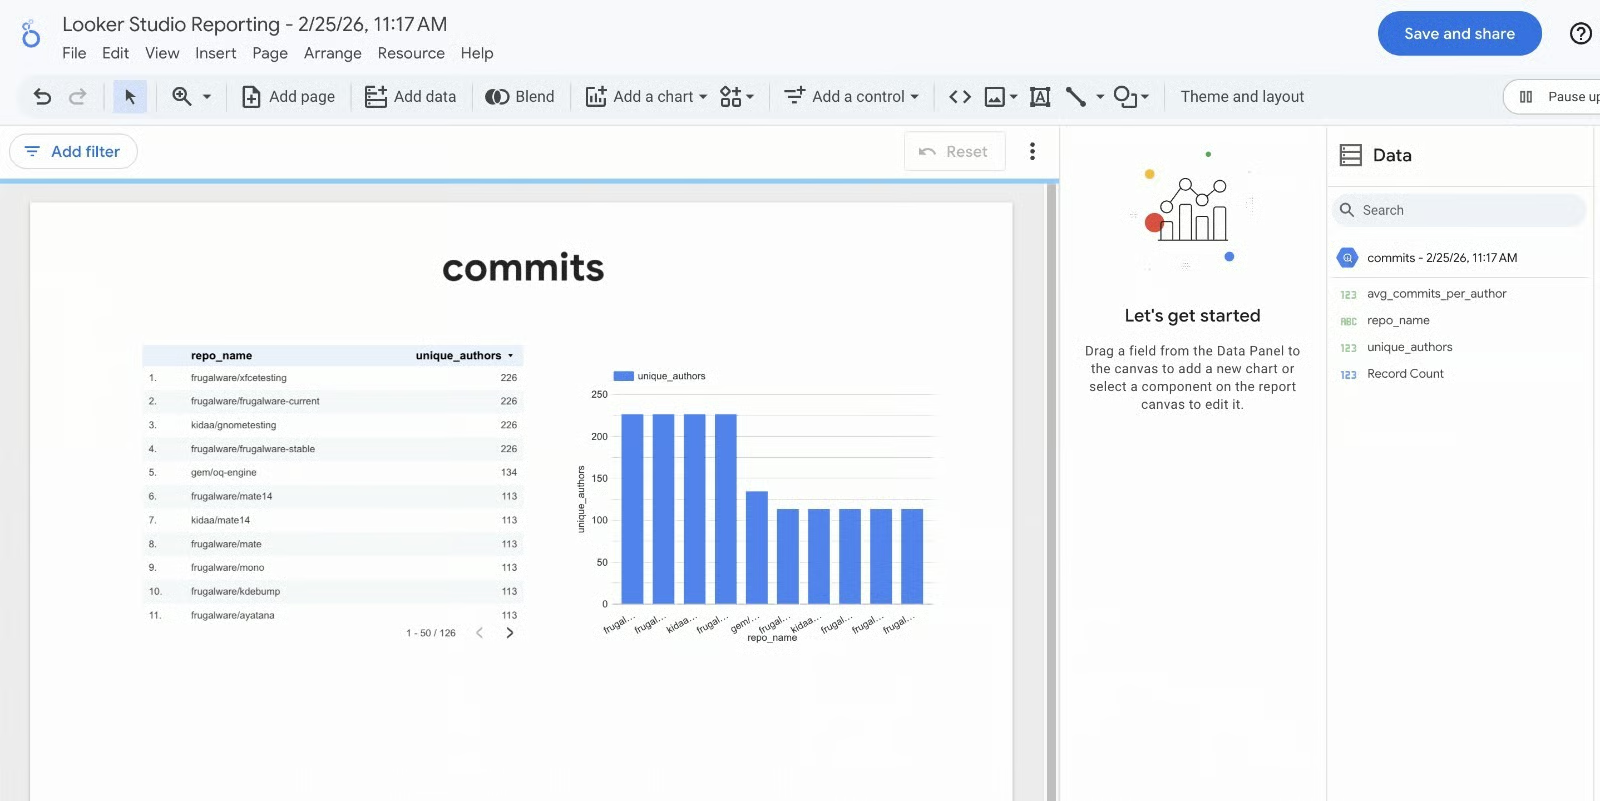
I’ve found this to be the most efficient workflow for creating portfolio projects. You don't have to worry about authentication or data extracts; Google handles the handshake behind the scenes. Within seconds, you can drag and drop dimensions into bar charts to see trends in your GitHub or taxi data that weren't obvious in the raw table.
If you’re interested in how Looker Studio compares to other visualization and BI tools, our articles on Looker Studio vs Power BI and Looker vs Tableau have you covered.
Sometimes a full dashboard is overkill, and you just need to perform a few quick calculations in a familiar spreadsheet environment. In the Open in menu, selecting Connected Sheets creates a live link between BigQuery and a Google Sheet. Unlike a standard copy-paste, this connection allows you to refresh the data directly from the spreadsheet.
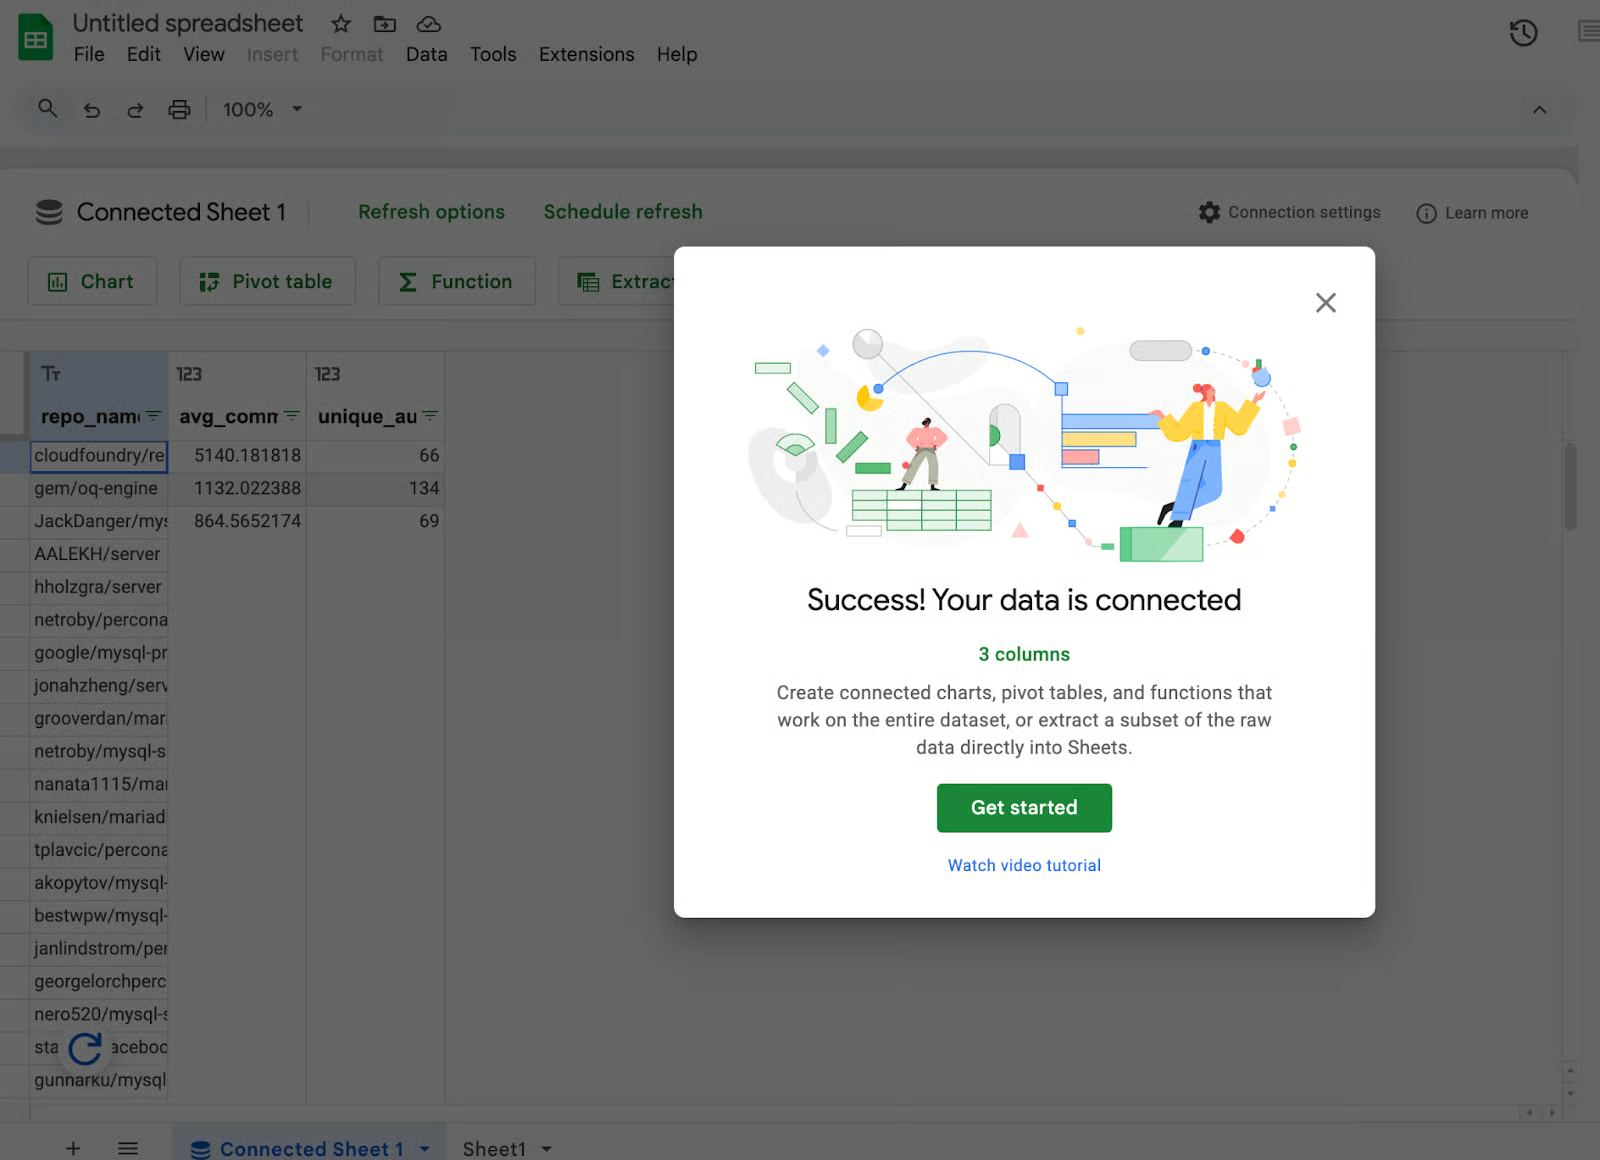
I found this feature to be very useful when I need to share a subset of data with a teammate who isn't comfortable writing SQL. It allows you to use the power of BigQuery to filter through terabytes of data, and then hand off a manageable, clean slice to a spreadsheet for final formatting or pivot table analysis.
For those looking to dive into data science, the Open in menu also offers a Notebook option. This generates a Python notebook (usually in Google Colab) that is already configured to query your Sandbox results using the BigQuery Python client.
Important Note: Unlike the rest of the Sandbox, launching a BigQuery Notebook usually requires an active billing account. This is because notebooks spin up Vertex AI compute resources. While there is a free tier for Vertex AI, Google requires a payment method on file to prevent abuse of the underlying virtual machines.
If you prefer a more visual, no-code exploratory experience, the Data canvas option allows you to see the relationships between your datasets through a graphical interface. By using these integrated tools, you can move from a raw dataset to a shared report or a Python model in under five minutes.
The BigQuery Sandbox is a powerful entry point for data exploration, but it is governed by a strict set of guardrails. It’s important to understand these limitations, so you avoid unexpected data loss.
The most significant constraint within the Sandbox environment is the mandatory 60-day default table expiration. Unlike standard BigQuery projects, where data can persist indefinitely, Sandbox datasets are hard-coded with a 60-day time-to-live for all partitions and tables.
This policy is immutable in the free tier; users cannot update or remove this expiration time in the dataset settings. To keep data alive beyond this two-month window, an upgrade to a paid billing account is required.
Furthermore, the Sandbox limits users to 10GB of active storage. While this might be sufficient for small datasets, long-term projects often accumulate historical data, forcing you to delete older records to make room for new ones once the 10GB threshold is reached.
To maintain the Sandbox as a low-overhead environment, Google restricts several high-velocity and automated features. Most notably, ingestion methods like the Streaming API and the Data Transfer Service (DTS) are unavailable in the Sandbox. This means you cannot pipe in real-time telemetry or automate data imports from third-party SaaS platforms like Google Ads or Salesforce.
Additionally, there are hard restrictions on Data Manipulation Language (DML): Sandbox projects cannot run DML statements, such as INSERT, UPDATE, and DELETE.
Lastly, the lack of background job execution (scheduled queries) means all operations must be triggered manually; you cannot automate your SQL workflows to run on a Cron schedule.
From a compute perspective, Sandbox projects operate on the same shared infrastructure as paid tiers, using a global pool of slots (virtual CPUs). However, they are assigned a lower scheduling priority. During peak global demand, Sandbox queries may experience higher latency as the system prioritizes Flex or Capacity commitments from paying customers.
The hard ceiling for processing is the 1TB per month query cap. This is a scan-based limit; if you run a query against a massive public dataset that scans 500GB, you have consumed half of your monthly allowance in one click.
Users can track this usage by checking the "Bytes Processed" estimate in the top-right corner of the Query Editor before execution, or by monitoring the "Quotas" section of the Google Cloud Console to ensure they don't hit a mid-month lockout.
Understanding the constraints of the Sandbox actually helps define its best use cases. Because you cannot accidentally incur costs, it becomes a powerful laboratory for three specific types of data work.
In my experience, the Sandbox is most effective when used as a staging area for ideas. It allows you to fail fast and iterate without the administrative burden of managing a cloud budget.
The most obvious use case for the Sandbox is practicing SQL syntax and data warehousing concepts. On your road to learning SQL, I recommend practicing in the Sandbox after learning the basics in our SQL Fundamentals skill track, using real enterprise-scale data rather than small, local files.
I’ve found the Sandbox particularly useful for mastering complex window functions like LEAD() and LAG(). Running them on a million rows of taxi trip data helps you understand how distributed SQL engines actually handle partitioning and ordering. It’s about building the muscle memory required for a high-stakes data career.
For developers, the Sandbox is an ideal environment to test schema designs before they hit production. I often upload a representative slice of my own data to see how BigQuery’s auto-detection handles my specific date formats or nested JSON structures.
This workflow is essential for proving value to your team. You can build a mock dashboard in Looker Studio using Sandbox data to show what’s possible. Once you’ve validated the logic and the stakeholders are on board, you can then safely move the project to a paid tier where the data retention is permanent.
The Sandbox is a goldmine for ad-hoc analysis on open datasets. I once used the GitHub public data to tell a story about developer productivity. By querying millions of commits, I wanted to find the exact hour when developers were most active across the globe.
Using the EXTRACT(HOUR FROM ...) function in the Sandbox, I found a massive spike in activity around 10:00 AM UTC. This kind of data storytelling is easy in the Sandbox because you aren't worried about the cost of the scan. You can validate data quality or find hidden trends in weather patterns or crypto transactions before ever building a formal ETL pipeline.
Eventually, you will hit a wall where the Sandbox guardrails start to limit your progress. When you need your data to stay longer than 60 days, or you want to start streaming live data, it’s time to move to the professional tier.
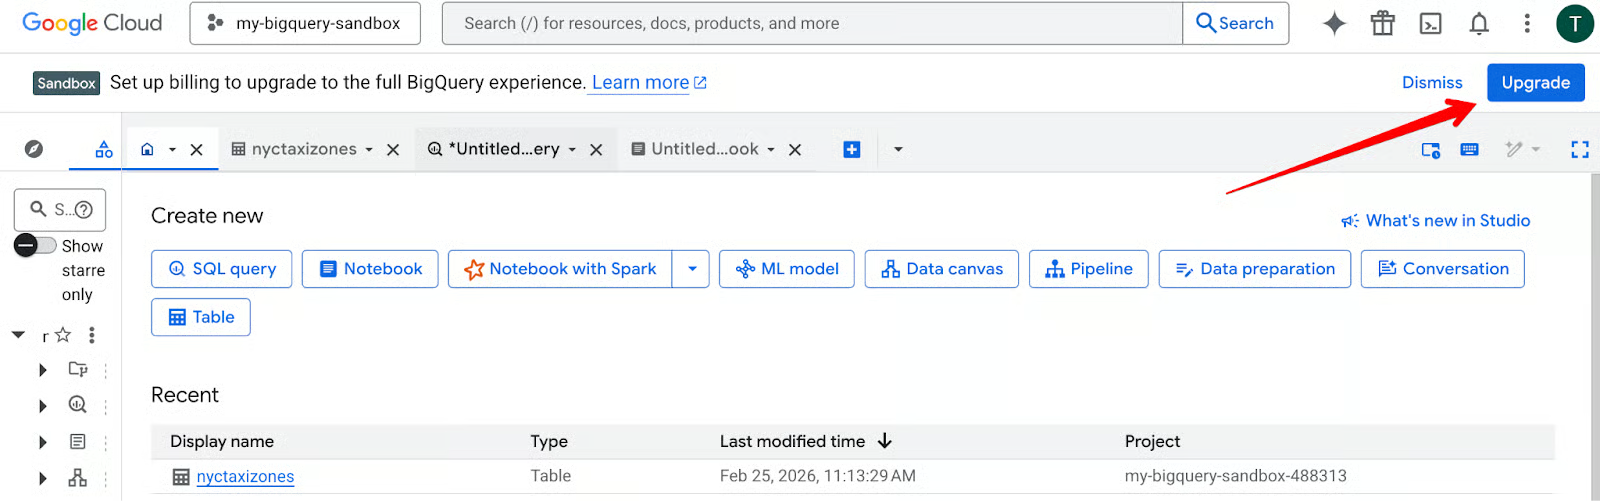
Moving from the Sandbox to production is essentially just turning on the lights. You do this by linking a billing account to your existing project. You’ll see an Upgrade button right in the BigQuery console, or you can handle it through the Billing section of the Google Cloud Console.
On clicking Upgrade, if you have never created a billing account before, you will be prompted to create one. Once created, you link that account to your project.
In my experience, the biggest relief after upgrading is the immediate removal of the table expiration policy. When you attach a billing account, and the project leaves Sandbox, the default 60‑day expiration is no longer enforced, and you can configure or remove table expiration so your data does not automatically disappear after two months.
You also unlock the Streaming API, allowing you to move from batch analysis to real-time data processing.
The second you upgrade, you are on the hook for storage and query costs. My first day one task for any professional project is setting up budget alerts. I set mine at 50%, 80%, and 100% of my intended monthly spend (e.g., $10).
Beyond alerts, I recommend high-quality "Pro" habits:
PARTITION BY and CLUSTER BY. Even on small datasets, these habits ensure that when your data grows to petabytes, your queries remain cheap and fast.If your exploration is complete and you don’t want to move to production, don't just leave the project sitting there. I make it a habit to delete experimental datasets once I’m done with them. It keeps the workspace clean and prevents any confusion later.
If the entire project was just for learning, you can shut it down completely from the project settings. This ensures you have zero residual footprint in the cloud. Developing these cleanup habits now will serve you well when you are managing production-scale resources for a company where "cloud waste" can cost thousands of dollars.
The BigQuery Sandbox is the most friction-free way to master enterprise data skills. It provides a risk-free environment where you can explore terabytes of data and build dashboards without ever providing a credit card.
The 60-day expiration and the 1TB query limit might seem like hurdles, but I view them as helpful guardrails. They force you to be efficient with your SQL and organized with your data. In my experience, the confidence you gain by practicing in the Sandbox is the best preparation for a high-stakes data career.
Ready to put these skills into practice? Start the Data Analyst in SQL career track today and use the BigQuery Sandbox to follow along with the exercises in a real-world environment.
SQL Courses
Track
Track
Course
Tutorial
Eduardo Oliveira
Tutorial
Josep Ferrer
Tutorial
Allan Ouko
Tutorial
Alexis Perrier
Tutorial
Richie Cotton
code-along
Eduardo Oliveira