
Course
Machine Learning for Time Series Data in Python
4 hr
53.2K
Before diving into different feature engineering techniques, let’s first understand the types of features available.
As the name suggests, numerical features represent data in numbers. They are continuous quantitative variables. Examples include height, age, and salary.
A categorical column can contain only discrete features. For example, a person’s gender is a categorical column, as it can only have a few gender types. Birth month is another example because the values must fall between January and December.
Categorical variables are further divided into binary and non-binary types. Binary variables have two possible categories, while non-binary features can have multiple categories.
Textual columns contain only text data. Examples include product reviews or product description columns in a retail dataset.
On the other hand, time-series features represent timely data, such as weekly sales or stock price fluctuations over a year.
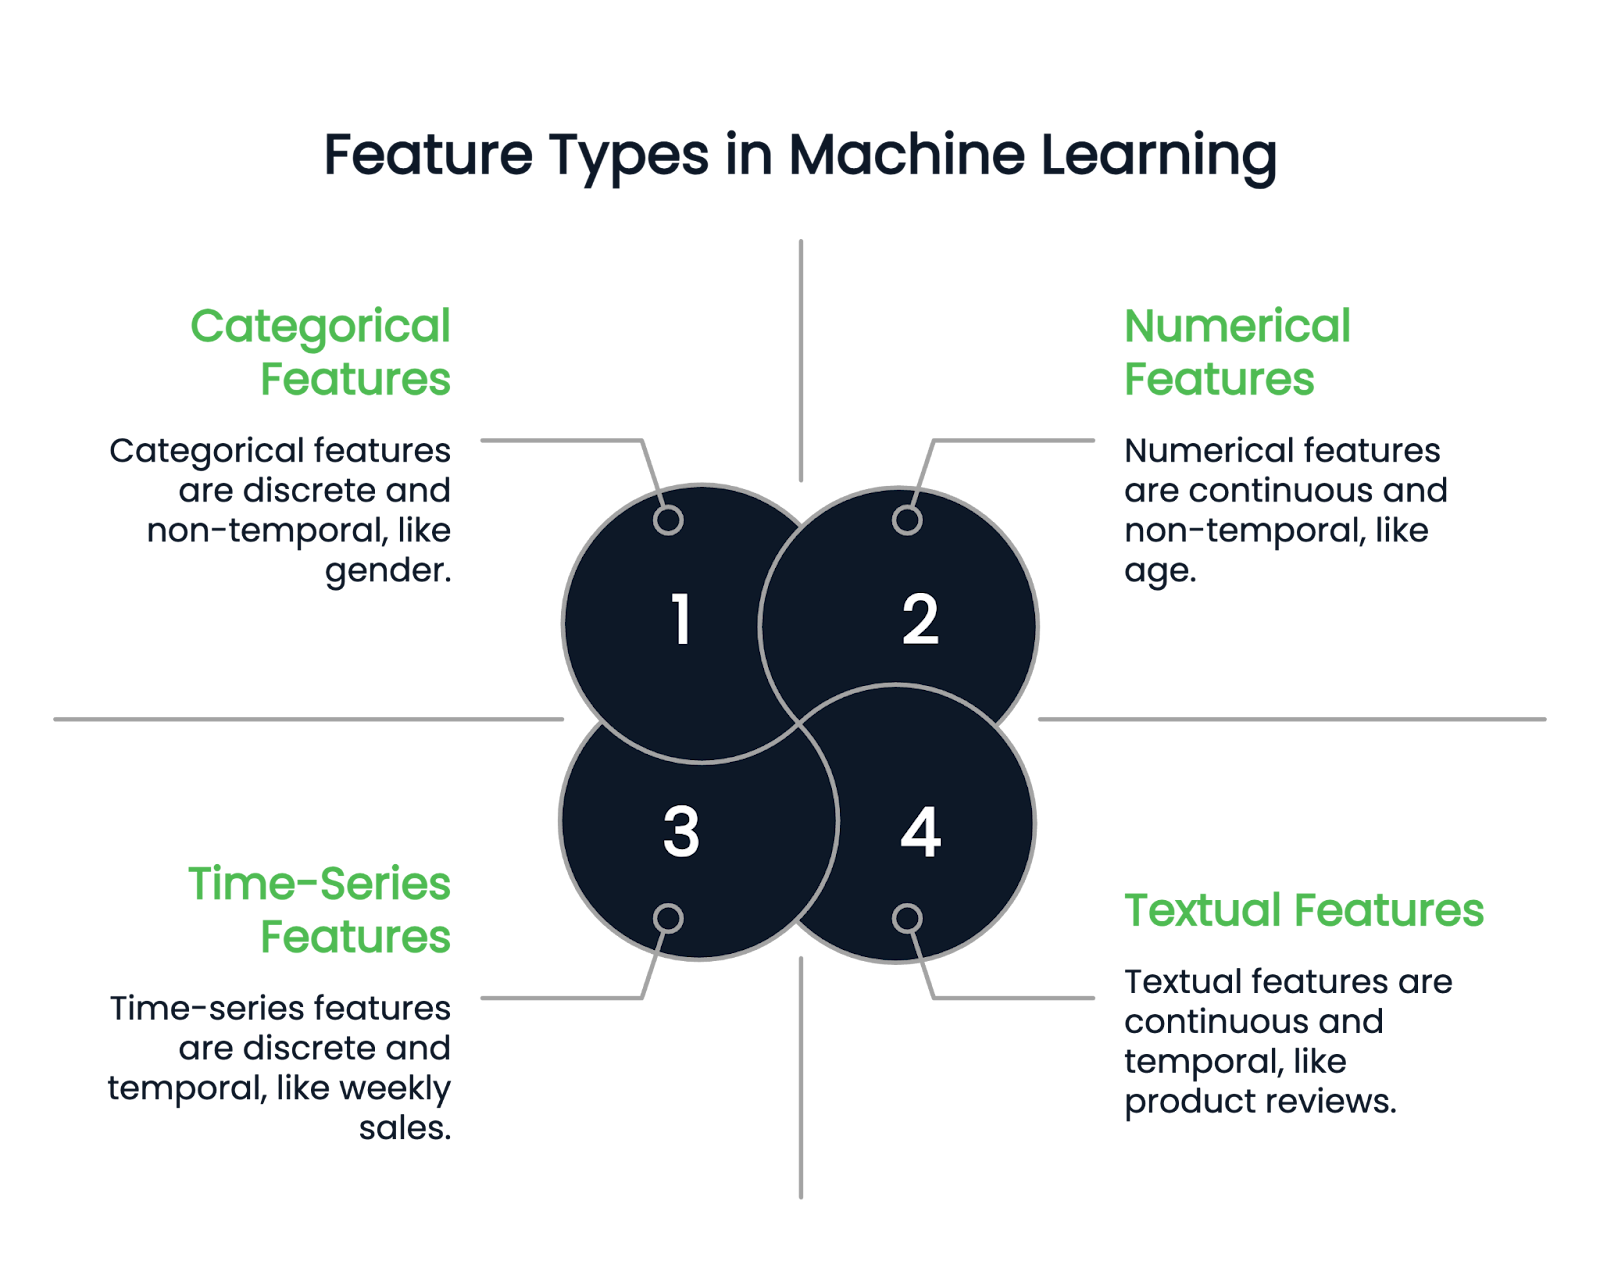
Image by Author
Feature engineering offers various powerful techniques for converting raw columns into desirable features. Here, we discuss some prominent ones.
Missing values can distort model performance, so handling them properly is crucial. There are two main approaches:
For an in-depth guide on handling missing data, read this Techniques to Handle Missing Data Tutorial or explore this Dealing with Missing Data in Python Course.
Outliers are abnormal values significantly different from the rest of the data points. For example, if you have a salary dataset with most observations between $90K and $120k, a salary number like $400K or $10K is an outlier.
Machine learning models cannot directly process categorical variables, so they must be converted into numerical representations. Below, we discuss some popular encoding techniques.
Consider a dataset with the following categorical feature:
|
Name |
Gender |
|
John |
Male |
|
Rachel |
Female |
|
Emma |
Female |
Using one-hot encoding, we create separate columns for each possible category in the Gender feature:
|
Name |
Female |
Male |
|
John |
0 |
1 |
|
Richale |
1 |
0 |
|
Emma |
1 |
0 |
Since John is Male, the "Male" column gets a 1, while the "Female" column remains 0. Likewise, Rachel and Emma are Female, so the "Female" column is 1 and the "Male" column is 0.
For a complete tutorial on one-hot encoding in Python, check out this One-Hot Encoding Tutorial.
Consider a dataset with a Location column containing categorical values:
|
Location |
Encoded value |
|
New York |
1 |
|
California |
2 |
|
Texas |
3 |
|
California |
2 |
|
Texas |
3 |
Each unique location is assigned a distinct numerical value. However, since California (2) is not inherently "between" New York (1) and Texas (3), using label encoding for non-ordinal data can lead to misleading model assumptions. In such cases, one-hot encoding is often preferred to avoid implying an unintended numerical relationship between categories.
Consider an Education level column with the following categories:
|
Education level |
Encoded value |
|
UG (Undergraduate) |
1 |
|
PG (Postgraduate) |
2 |
|
PhD |
3 |
Since a PhD represents a higher level of education than a PG, which in turn is higher than UG, the assigned numerical values reflect this ranking.
Consider a dataset where Location is a categorical feature, and the Target variable represents some numerical outcome:
|
Location |
Target variable |
|
New York |
2 |
|
California |
3 |
|
Texas |
5 |
|
California |
1 |
|
Texas |
4 |
To encode the Location column, we calculate the mean of the Target variable for each unique category:
|
Location |
Encoded value |
|
New York |
2 |
|
California |
2 |
|
Texas |
4.5 |
|
California |
2 |
|
Texas |
4.5 |
If you’re looking for a broader guide on handling categorical data, this Categorical Data Handling Tutorial provides additional insights.
Feature scaling ensures that numerical features lie within a standardized range, preventing some features from dominating the learning process due to their larger values.
Machine learning models that rely on distance-based calculations (e.g., linear regression, k-nearest neighbors, and neural networks) can be affected when features have vastly different scales.
For example, consider an employee dataset with the following features:
Since income has much larger values than age, a model might assign more importance to income simply because of its scale, not because it is actually more relevant.
Here are some common techniques:
Scaled value =( datapoint - min(column))/(max(column) - min(column))
Scaled value =( datapoint - mean(column))/(std(column))
For a detailed comparison of normalization vs. standardization, check out this Normalization vs. Standardization Guide.
Creating new, meaningful features from existing data provides more logical insights into the model.
For instance, in a house price prediction dataset, if you have the length and breadth columns separately, you can derive a new feature: area = length * breath, which may directly relate to the target variable, price. Inputting this area feature to the model simplifies discovering hidden patterns.
Feature selection keeps only relevant features by removing unnecessary columns. Focusing on the most informative data helps prevent overfitting, reduce computational complexity, and improve model performance. Here are some techniques:
Feature engineering is best understood through hands-on implementation.
The “house price prediction” is a huge, real-world dataset with 81 columns. I have selected this for its diverse range of features, which can help you better understand feature engineering techniques practically.
Getting started:
The following code identifies categorical columns in the dataset and replaces their missing values with the most frequent category:
import pandas as pd

# Load dataset (replace 'your_file.csv' with the actual file name)
df = pd.read_csv('your_file.csv')

# Select categorical columns
categorical_cols = df.select_dtypes(include=['object']).columns

# Replace missing values with the most frequent category (mode)
for col in categorical_cols:
    mode = df[col].mode()[0]  # Get the most common value
df[col].fillna(mode, inplace=True) # Fill missing valuesWe handle numerical missing values by replacing them with either mean or median. Mean is a more popular option for statistically distributed data, while median works well when the column has outliers. So, we will check for outliers and decide on the method.
To visualize potential outliers, we can use box plots, which help identify extreme values. Below is a Python implementation for detecting outliers in selected numerical columns:
import pandas as pd
import matplotlib.pyplot as plt
import numpy as np

features = ['LotFrontage', 'MasVnrArea', 'GarageYrBlt']

# Plot box plots
df[features]=np.log(df[features])
df[features].boxplot(figsize=(8, 4))

plt.title('Box Plot for Outlier Detection')
plt.ylabel('Values')
plt.xticks(rotation=45)
plt.show()
Output:
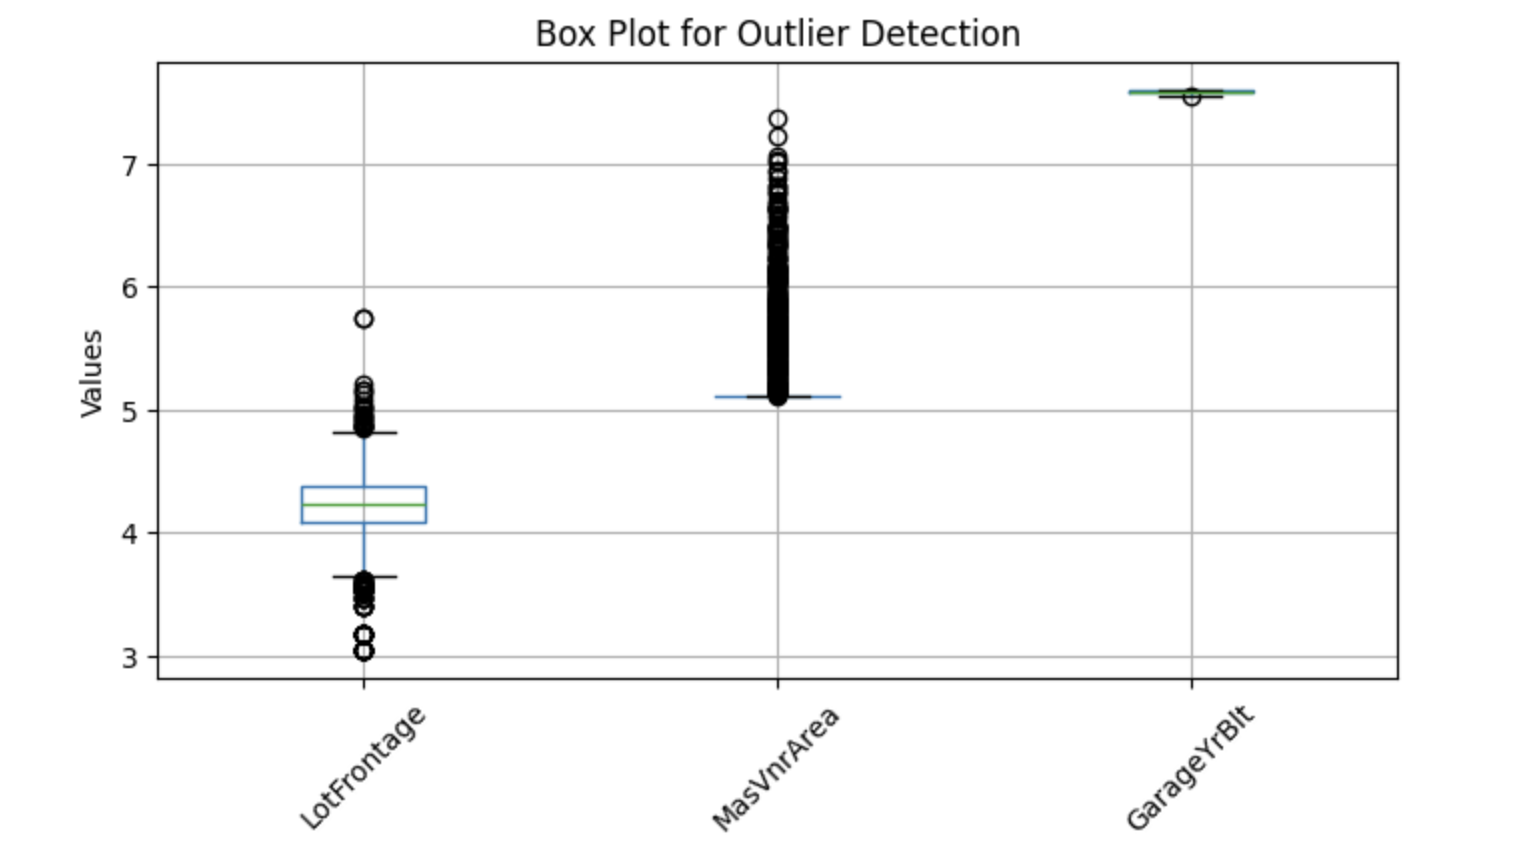
The above boxplots show points outside whiskers—these are called outliers. So, let's replace missing values with the median.
Code to replace nulls with median values:
import pandas as pd
# Select numerical columns
numerical_columns = df.select_dtypes(include=['number']).columns
for col in numerical_columns:
    median = df[col].median()
df[col].fillna(median, inplace=True) # Replace nulls with medianColumns like YearBuilt, YearRemodAdd, GarageYrBlt, and YrSold contain years (e.g., 2001, 1976) that don’t directly influence the target variable. While these absolute year values may not directly impact house prices, we can derive more useful insights by calculating how old the house or renovation is at the time of sale.
For example, instead of using YearBuilt, we can create a new feature: House Age=YrSold−YearBuilt
Code to create these new features:
# Get columns that contain 'Yr' or 'Year'
year_columns = [feature for feature in numerical_columns if 'Yr' in feature or 'Year' in feature]

# Convert year values into age-related features
for col in year_columns:
df[col] = df['YrSold'] - df[col]In machine learning, skewed numerical features can negatively impact model performance, especially for models that assume a normal distribution (e.g., linear regression). To correct this, we apply log transformation.
Before applying a log transformation, we must identify skewed features. However, we exclude columns containing zeros since the logarithm of zero is undefined.
Here’s an implementation in Python to identify skewed columns:
import pandas as pd

# Get numerical columns
numerical_columns = df.select_dtypes(include=['number']).columns

# Identify columns containing zeros
numerical_0s = df.loc[:, (df == 0).any()].select_dtypes(include=['number']).columns

# Remove columns that contain zeros from consideration
numerical_columns = numerical_columns.difference(numerical_0s)

# Calculate skewness for the remaining numerical columns
skewness = df[numerical_columns].skew()

# Set threshold for skewness (e.g., absolute value > 1 indicates high skewness)
skewed_columns = skewness[abs(skewness) > 1]

# Display skewed columns
print("Skewed Columns:")
print(skewed_columns)
Output:
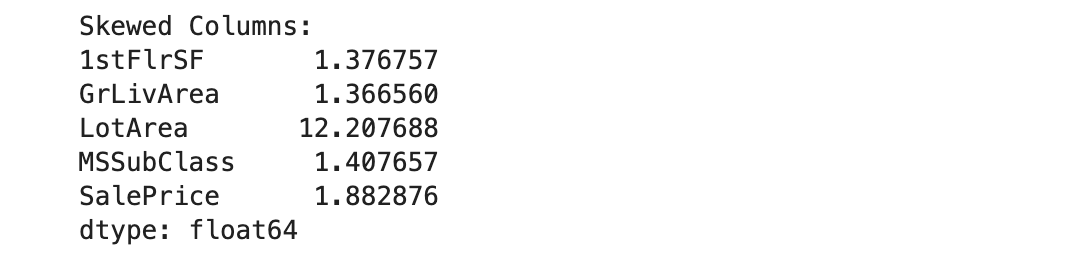
We will use log-normal distribution to convert these five skewed columns into a Gaussian distribution:
import numpy as np

# The list of highly skewed features identified earlier
skew_features = ['LotFrontage', 'LotArea', '1stFlrSF', 'GrLivArea', 'SalePrice']

# Apply log transformation to each skewed feature
for col in skew_features:
df[col] = np.log(df[col])We previously discussed several encoding techniques; in this example, we will apply target encoding.
# Select categorical variables
categorical_columns = df.select_dtypes(include=['object', 'category']).columns

# Apply target encoding
for col in categorical_columns:
    # Compute mean SalePrice for each category
    labels_ordered = df.groupby([col])['SalePrice'].mean().sort_values().index

    # Assign numerical values based on target variable mean
    labels_ordered = {x: i for i, x in enumerate(labels_ordered, 0)}

    # Map encoded values back to the dataframe
    df[col] = df[col].map(labels_ordered)
In the code above, the target variable is SalePrice, so we grouped the data by each categorical column and calculated the mean SalePrice for each group. These mean values were then assigned to the corresponding categorical values in that column.
Our dataset is now ready for machine learning!
If you want to strengthen your understanding of supervised learning concepts and how models utilize engineered features, this Supervised Learning with Scikit-Learn Course is an excellent resource.
In this section, we’ll go through the most used Python libraries and automation tools to implement feature engineering.
Pandas is the most used Python framework for handling structured data. It performs many feature engineering steps, such as transformation, data aggregation, and feature extraction. Pandas also make data cleaning and manipulation easy.
If you're new to pandas, this Data Manipulation with pandas Course is a great starting point.
Scikit-learn is a powerful machine-learning library with various tools for feature engineering. It contains methods like OneHotEncoder and LabelEncoder to convert categorical to numerical variables. It also offers feature scaling methods like StandardScaler and Minmaxscaler.
Feature-engine is an open-source Python library offering a variety of transformers to simplify feature engineering. These transformers are specialized tools for specific tasks, such as missing data imputation, outlier handling, feature selection, and discretization. Fully compatible with scikit-learn, these transformers can be passed as input parameters for hyperparameter tuning.
fit(), the library offers a fit_transform() method that simultaneously performs fit and transforms operations on the input data. Moreover, FeatureSelector and AutoFeatLight models are available for feature selection and scaling.To effectively implement feature engineering, focus on these best practices.
Understanding the meaning and significance of each feature makes it much easier for you to perform techniques like feature selection or extraction. I suggest you research your data and relevant domain knowledge for effective feature engineering.
Utilize Python libraries like Pandas and Matplotlib to conduct comprehensive exploratory data analysis, such as exploring statistical information, visualizations, and correlations for finding patterns and potential relationships within the data.
Creating interaction features involves identifying relationships between existing features and deriving new ones. For instance, in house price prediction, calculating a house's age by subtracting the year it was built from the current year highlights trends, such as house price decreases as time passes.
Different machine learning models require different steps of feature engineering. For instance, models like linear or multiple regression, SVM, and KNN often benefit from feature standardization, but this technique doesn't help tree-based models.
So, deciding on your model ahead of time can help you build an effective feature engineering pipeline for your use case.
Feature engineering is an integral part of building machine learning solutions, allowing you to leverage features in the most efficient way. The process is carried out by data scientists or ML engineers when dealing with any dataset. If you’re a data professional or aiming to become one, mastering all the techniques mentioned in this article will help you advance your career!
To explore these techniques in more detail, check out the DataCamp courses on feature engineering for machine learning and feature engineering for NLP. There’s also a course on feature engineering for R programmers.
Learn more about machine learning with these courses!
Course
Course
Course
blog
Kurtis Pykes
10 min
Tutorial
Rajesh Kumar
Tutorial
Hugo Bowne-Anderson
Tutorial
Sayak Paul
code-along
Colin Priest
code-along
Jorge Zazueta