Course
Understanding Machine Learning
2 hr
307.3K
Have you been in a situation where your machine learning model can predict who'll buy, but can’t tell you why they bought?
Traditional machine learning can spot patterns and predict outcomes. It'll tell you a customer is likely to churn or that sales will decrease next quarter. But if ask it whether your latest marketing campaign actually caused more sales, or whether a treatment genuinely improved patient outcomes, and doesn’t know what to do. Prediction and causation are two different things.
Causal machine learning combines machine learning with causal inference techniques. So, instead of asking "what will happen?", it asks "what happens if we intervene?" - and that's the question behind every business decision or medical treatment.
In this article, I'll walk you through the core concepts behind causal ML, the methods used to estimate cause-and-effect, and how to apply them in Python.
If you’re new to machine learning, enroll in our beginner-friendly Machine Learning Fundamentals in Python track.
Standard ML models learn patterns from data and use them to make predictions. They're good at answering "what will happen?" but they can't tell you what caused it to happen.
Causal machine learning asks a different question. It combines ML with causal inference techniques to estimate cause-and-effect relationships from data. So, instead of predicting an outcome, it estimates what would change if you took a specific action.
That action is called an intervention and represents a deliberate change you make to see its effect. Did the discount actually drive more purchases, or would those customers have bought anyway? Did the new drug improve recovery, or did patients get better on their own?
These are questions predictions can't answer, but causal ML can.
Traditional ML learns correlations. It finds that customers who receive discount emails tend to buy more, and it uses that pattern to predict future purchases. But correlation doesn't tell you whether the email caused the purchase. Maybe those customers were already planning to buy.
Causal ML estimates the causal effect of the email on purchases. It asks what would've happened if you hadn't sent it. The difference between "these things tend to appear together" and "this thing caused that thing" is what separates traditional and causal ML.
Here's a simple way to think about it:
The first helps you predict. The second helps you decide. Both are useful.
Most business and policy decisions are causal by nature. You're not asking "what will happen?" - you're asking "what should we do?"
Here are some concrete examples:
Standard machine learning methods can't answer any of these questions because it treats correlation as a feature. Two variables that move together might share a common cause, or the relationship might be pure coincidence. Causal ML forces you to think about why things are connected - and if changing one will actually change the other.
Before you can estimate cause-and-effect, you need to understand a couple of things every causal analysis relies on.
Every causal question has two parts: a treatment and an outcome.
The treatment is the action or intervention you're studying. It could be a drug given to patients, or a discount offered to customers. The outcome is what you're measuring, such as recovery time, purchase rate, or productivity.
The goal of causal ML is to estimate how the treatment changes the outcome. It doesn’t estimate if the two are correlated, but whether one actually causes the other.
You can observe what happened after a patient took the drug, but you can't observe what would've happened if they hadn't. That unobserved scenario is called a counterfactual.
In other domain, say a customer received a 20% discount and made a purchase. The counterfactual asks: would they have purchased without the discount? You'll never know for certain because you can't rewind time and run both versions on the same person.
Causal ML estimates these counterfactuals using statistical techniques and assumptions. The quality of your causal estimate depends on how well you approximate what you can't directly observe.
A confounder is a variable that affects both the treatment and the outcome, which creates a false impression of causation.
For example, say you're studying whether exercise reduces heart disease. People who exercise more also tend to eat healthier. Diet affects both the likelihood of exercise (treatment) and heart disease (outcome). If you ignore diet, you'll overestimate how much exercise alone matters.
Confounders are the biggest threat to causal analysis. Identifying and accounting for them is what makes a causal estimate reliable, and is something worth spending time on.
If you’re wondering how you figure out which variables are confounders and which aren't, well, you draw a graph.
A directed acyclic graph (DAG) is a diagram that maps out the causal relationships between variables. Each node represents a variable, and each arrow points from a cause to its effect. "Directed" means the arrows have a direction. "Acyclic" means there are no loops - a variable can't cause itself, directly or through a chain.
Take the exercise example from earlier. A simple DAG would have arrows from Diet - Exercise and Diet - Heart Disease, plus an arrow from Exercise - Heart Disease. The graph makes it obvious that Diet is a confounder because it has arrows pointing to both the treatment and the outcome.
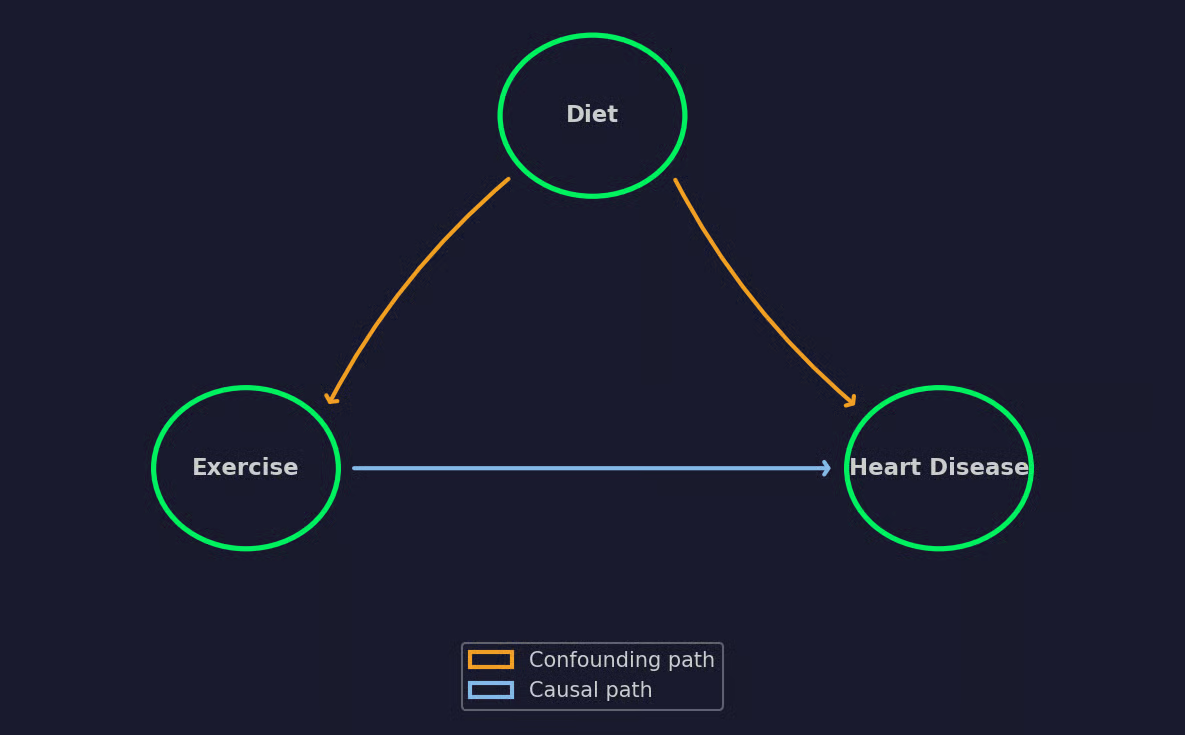
A simple DAG example
DAGs also tell you which variables to control for and which to leave alone. If you control for the wrong variable, you can actually introduce bias instead of removing it. With that in mind, think of a DAG as a roadmap for your entire causal analysis.
The best part?
You don't need math to build a DAG. You just need domain knowledge. The graph encodes your assumptions about how the world works, and the quality of your causal estimates depends on whether those assumptions are correct.
Causal ML borrows a lot from statistics and econometrics, but scales these ideas with machine learning. I'll walk you through the four most common approaches.
In an ideal world, you'd run a randomized experiment to measure a treatment's effect. But in practice, treatment assignments are rarely random. People who receive the treatment often differ from those who don't - and those differences create bias.
Propensity score methods address this by estimating the probability that each individual receives the treatment, based on their observed characteristics. That probability is the propensity score.
Once you have scores, there are two main ways to use them:
Both methods try to simulate what a randomized experiment would've looked like, using observational data.
Sometimes the confounders you need to control for aren't in your data. You can't measure them, so propensity scores won't help. This is where instrumental variables (IV) come in.
An instrument is a variable that affects the treatment but has no direct effect on the outcome. It only influences the outcome through the treatment.
A classic example is studying the effect of education on earnings. Motivation affects both how much education someone gets and how much they earn - but you can't measure motivation directly. Distance to the nearest college works as an instrument because it affects whether someone attends college, but it doesn't directly affect their future salary.
In practice, finding a good instrument is hard. The method is great when you have one, but a weak or invalid instrument will produce misleading results.
Causal forests extend the random forest algorithm to estimate treatment effects instead of predictions. A standard random forest predicts an outcome, while a causal forest estimates how much the treatment changes that outcome for different subgroups.
This is useful when the treatment effect varies across individuals. A drug might work well for younger patients but not for older ones. Likewise, a discount might increase purchases for price-sensitive customers but have no effect on loyal buyers. Causal forests detect these differences by splitting the data on characteristics that produce the biggest variation in treatment effects.
The output is a personalized treatment effect estimate for each individual in your dataset.
Double machine learning (DML) combines ML models with statistical inference to get the best of both worlds.
You use one ML model to predict the outcome and another to predict the treatment assignment. Then you look at the residuals (the parts that neither model could explain), and the relationship between them gives you the causal effect.
If you’re wondering why the extra steps, here’s the answer. ML models are great at capturing patterns, but they introduce bias when used for causal estimation. DML removes that bias through a technique called cross-fitting, where you train and predict on different splits of the data to avoid overfitting.
Once you've picked a method, you need a way to summarize what it found. That's where treatment effect metrics come in.
The Average Treatment Effect (ATE) measures the average causal effect of the treatment across your entire population. If the ATE of a discount campaign is $5, it means that, on average, the discount increased spending by $5 per customer.
ATE gives you the big picture, but it hides individual variation. A $5 average could mean everyone spent $5 more, or it could mean half the customers spent $10 more while the other half saw no change.
The Conditional Average Treatment Effect (CATE) estimates the treatment effect for specific subgroups based on their characteristics. So, instead of one number for everyone, CATE tells you that the discount increased spending by $8 for new customers but only $2 for returning ones.
CATE is what makes causal ML actionable. ATE tells you if an intervention works. CATE tells you for whom it works - and that's the answer you need to make data-driven decisions.
Causal ML shows up anywhere you need to move from "what happened?" to "what should we do?" Here’s a couple of examples.
A hospital wants to know which treatment works best for a specific patient profile. Standard ML can predict who's at risk, but causal ML estimates whether Treatment A or Treatment B will produce a better outcome for that particular patient. This allows for personalized treatment decisions based on estimated effects rather than population averages.
A marketing team runs a promotional campaign and sees a spike in sales. The question is, did the campaign cause the spike, or was it driven by seasonal demand? Causal ML isolates the true campaign impact by accounting for confounders like timing, customer demographics, and previous purchase behavior.
Governments and institutions need to evaluate whether policies produce the intended results. Did a job training program reduce unemployment? Did a tax incentive increase investment? Causal ML provides a framework for policy evaluation when randomized trials aren't practical or even possible.
A product team adds a new feature and engagement goes up. Causal ML helps determine if the feature caused the increase or if it coincided with other changes - like a marketing push or a competitor going down. Understanding the actual impact of a feature separates data-informed decisions from a random guess.
The common thread is that decisions depend on knowing why something happened, not just that it happened.
There are three libraries that cover most causal ML use cases in Python. I'll walk you through what each one does and show you a typical workflow.
Before diving into the code, here’s a full code snippet that covers all the imports and dataset creation. You can install any missing dependencies with pip or uv.
import numpy as np
import pandas as pd
from dowhy import CausalModel
from econml.dml import DML
from sklearn.ensemble import RandomForestRegressor, RandomForestClassifier
from sklearn.linear_model import LinearRegression
from causalml.inference.meta import LRSRegressor

np.random.seed(42)

# Generate synthetic data
n = 1000
customer_age = np.random.normal(35, 10, n)
prior_purchases = np.random.poisson(5, n)

# Treatment: whether the customer received a discount email
# Older customers with more purchases were more likely to get one
propensity = 1 / (1 + np.exp(-(0.03 * customer_age + 0.1 * prior_purchases - 2)))
discount = np.random.binomial(1, propensity)

# Outcome: purchase amount in dollars
# True causal effect of the discount is $5
purchase_amount = (
    50
    + 5 * discount
    + 0.5 * customer_age
    + 2 * prior_purchases
    + np.random.normal(0, 10, n)
)

df = pd.DataFrame({
    "customer_age": customer_age,
    "prior_purchases": prior_purchases,
    "discount": discount,
    "purchase_amount": purchase_amount
})

features = df[["customer_age", "prior_purchases"]].values
treatment = df["discount"].values
outcome = df["purchase_amount"].values
The dataset defines 1000 customers in an e-commerce store, and I’m trying to estimate the causal effect of a discount email in dollars. The true causal effect of the discount is $5, but as you can see from the output, a naive comparison overestimates the true effect because customers who received discounts already had more prior purchases:
naive_ate = (
    df[df["discount"] == 1]["purchase_amount"].mean()
    - df[df["discount"] == 0]["purchase_amount"].mean()
)
print("Naive Comparison")
print(f"Difference in means: ${naive_ate:.2f}")
Naive comparison
DoWhy is a framework built by Microsoft for end-to-end causal inference. It follows a four-step process: model the problem as a causal graph, identify the causal effect, estimate it, and then test whether the estimate holds up under different assumptions.
What makes DoWhy stand out is its focus on validation. After producing an estimate, it runs refutation tests that challenge your result. If the estimate survives those tests, you can trust it more. If it doesn't, you know your assumptions need work.
model = CausalModel(
    data=df,
    treatment="discount",
    outcome="purchase_amount",
    common_causes=["customer_age", "prior_purchases"]
)

identified_estimand = model.identify_effect()
estimate = model.estimate_effect(
    identified_estimand,
    method_name="backdoor.linear_regression"
)

refutation = model.refute_estimate(
    identified_estimand,
    estimate,
    method_name="random_common_cause"
)

print(f"Estimated ATE: ${estimate.value:.2f}")
print(f"After adding a random confounder: ${refutation.new_effect:.2f}")
DoWhy output
On average, the discount increased the purchase amount by $6.60 per customer. The refutation test added a random variable to the model, and the estimate hasn’t changed at all, which means the result isn't driven by spurious correlations. If the estimate had shifted a lot, it would've been a red flag that the causal assumptions were off.
EconML, also from Microsoft, focuses on estimating heterogeneous treatment effects. Or in plain English, how the effct varies across different subgroups. It implements methods like Double ML and Causal Forests that I covered earlier.
EconML follows a familiar scikit-learn-style API with .fit() and .effect() methods.
dml = DML(
    model_y=RandomForestRegressor(n_estimators=100, random_state=42),
    model_t=RandomForestClassifier(n_estimators=100, random_state=42),
    model_final=LinearRegression(),
    discrete_treatment=True
)

dml.fit(Y=outcome, T=treatment, X=features, W=None)
individual_effects = dml.effect(X=features)
df["estimated_effect"] = individual_effects

young = df[df["customer_age"] < 30]
middle = df[(df["customer_age"] >= 30) & (df["customer_age"] < 40)]
older = df[df["customer_age"] >= 40]

print(f"Average treatment effect: ${individual_effects.mean():.2f}")
print(f"Effect on young customers (<30):  ${young['estimated_effect'].mean():.2f}")
print(f"Effect on mid-age customers (30-40): ${middle['estimated_effect'].mean():.2f}")
print(f"Effect on older customers (>40):  ${older['estimated_effect'].mean():.2f}\\n")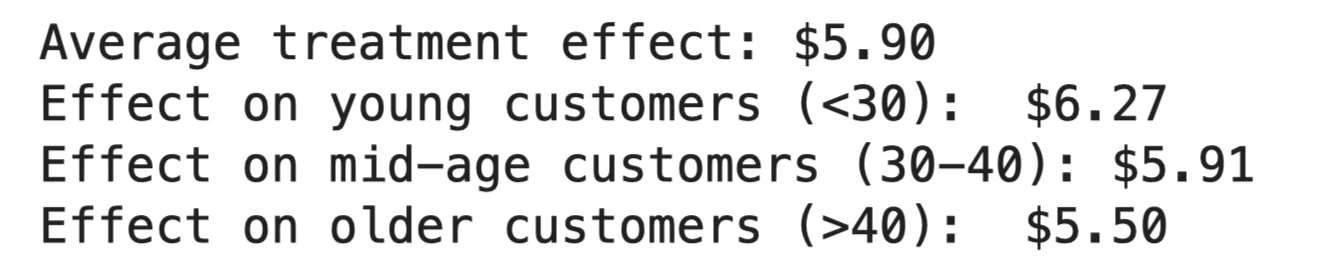
EconML output
The discount increased purchase amounts by $5.90 on average, but the effect wasn't uniform. Younger customers responded the most ($6.27), while older customers saw the smallest bump ($5.50). If your budget is limited, this tells you where to point the campaign first.
CausalML, built by Uber, is designed for uplift modeling - predicting which individuals will respond most to a treatment. It's especially popular in marketing, where the goal is to target customers who'll change their behavior because of a campaign, not those who would've converted anyway.
learner = LRSRegressor()
cate_estimates = learner.fit_predict(
    X=features,
    treatment=treatment,
    y=outcome
)

df["uplift"] = cate_estimates.flatten()

# Split into targeting tiers
df["tier"] = pd.cut(df["uplift"], bins=3, labels=["Low", "Medium", "High"])

tier_summary = df.groupby("tier").agg(
    avg_uplift=("uplift", "mean"),
    avg_age=("customer_age", "mean"),
    avg_prior_purchases=("prior_purchases", "mean"),
    count=("uplift", "size")
).round(2)

print(tier_summary.to_string())
CausalML output
The uplift scores are nearly identical across all customers, which means the discount had roughly the same effect on everyone - about $6.60 per person. This makes sense for our synthetic dataset, where I built in a flat $5 treatment effect with no variation by subgroup. In real-world data, you'd typically see more spread, and that's where targeting tiers become useful.
Each library has an ideal use case. Use:
All three work well together. A common pattern is to define your causal graph in DoWhy, estimate effects with EconML, and use CausalML to interpret the results.
Causal ML is sometimes easy to misuse. Here are the mistakes that confuse people most often.
This one is a classic. Customers who use a feature more also spend more, so you conclude the feature drives spending. But maybe high-spending customers are just more engaged across the board. Without a causal framework, you're guessing at the direction of the relationship.
Every causal analysis starts with a question: is this a pattern, or is this a cause? If you skip that question, no amount of modeling will help you.
A confounder affects both the treatment and the outcome.
Say you're measuring the effect of a training program on employee performance. Employees who sign up for training tend to be more motivated. Motivation drives both enrollment (treatment) and performance (outcome). If you don't account for it, you'll attribute the motivation effect to the training program.
The fix is more structural than statistical. Draw your DAG, map out every variable that could influence both sides, and decide how to handle each one before you fit a single model.
An ATE of $5 doesn't mean every customer gained $5. It's an average, and averages hide a lot. Some customers might have gained $15 while others lost $5.
The reverse is also dangerous. A CATE estimate for a subgroup doesn't mean every individual in that group will respond the same way. Treatment effects are estimates with uncertainty, not guarantees. Always check confidence intervals and don't make targeting decisions based on point estimates alone.
The number EconML or DoWhy give you is only as good as the assumptions behind it. A model can’t answer questions like these:
They require someone who understands the problem. A causal forest will happily produce treatment effect estimates from a badly specified model - it just won't tell you they're wrong.
The best causal analyses combine ML's ability to handle complex data with a human who knows which variables matter and why.
Causal ML changes the question from "what will happen?" to "what caused it to happen?"
That shift changes how you make decisions. It makes you go from reacting to patterns to understanding the mechanics behind them. Some would even say it’s the only way to make actual data-driven decisions.
But the tools only work as well as the assumptions you give them. A wrong causal graph or a misread treatment effect can lead you to conclusions that feel “scientific” and data-driven but are wrong. The model won't raise its hand and tell you.
The best results come from combining ML's ability to handle complex data with someone who understands the problem well enough to ask the right causal questions. Start with the domain knowledge, then let the model do the heavy lifting. Nothing more to it.
The first part is easy, especially with our Supervised Learning with scikit-learn course. Enroll today to grow your machine learning skills with a must-know Python library.
Learn with DataCamp
Course
Course
Course
blog
Andrea Valenzuela
11 min
blog
Zoumana Keita
10 min
blog
Matt Crabtree
14 min
blog
Abid Ali Awan
10 min
Tutorial
Joanne Xiong
11 min
Tutorial
Nishant Singh
4 min