
Power BI Roadmap: A 12-Month Learning Plan

Follow this structured, month-by-month Power BI roadmap to master foundational concepts, advanced analytics techniques, and practical skills for real-world projects.
Jun 3, 2025  · 10 min read

Learning Power BI effectively takes more than keeping track of the latest features. It requires a clear, structured plan. Microsoft’s move to integrate Power BI into the Fabric platform means there’s a lot to absorb, from unified analytics to real-time reporting and new AI capabilities. I’ve created this Power BI roadmap helps you tackle it all step-by-step, giving you the confidence to use the many features of this tool successfully and grow your career along the way.

If you’re responsible for building business intelligence solutions, leading analytics teams, or aligning technology with company objectives, understanding where Power BI is critical. This 12-month learning journey will help you build foundational skills, master advanced tools, and develop the mindset needed to drive impactful data initiatives.

TL;DR: Power BI Roadmap Milestones

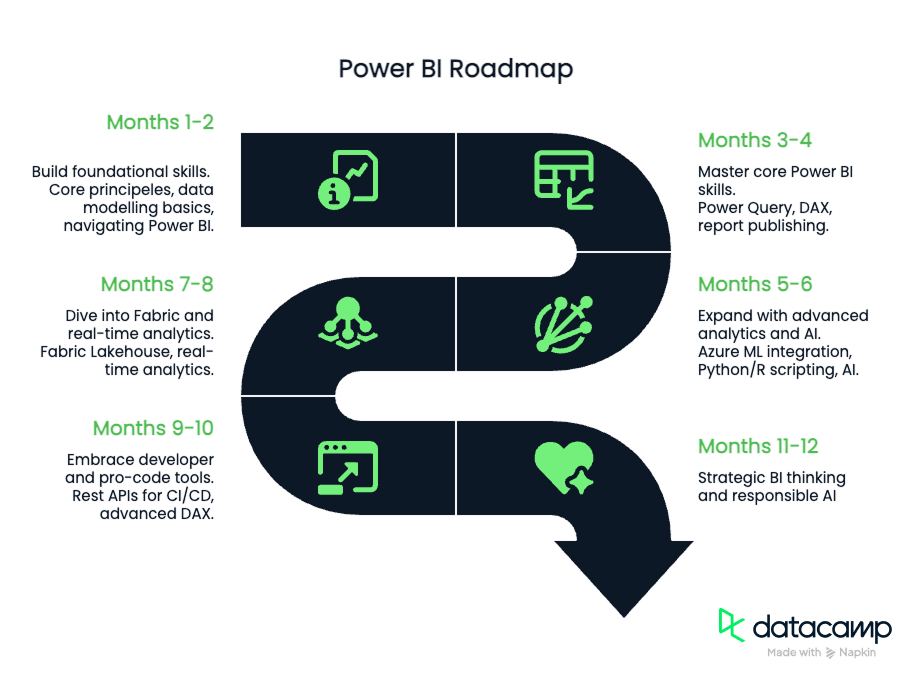
If you’re looking for a quick summary of the ground we’ll cover in this guide, check out the steps below and the infographic. Both can help you stay on track as you learn. If you want a fully detailed guide, be sure to read our How to Learn Power BI article.

  • Months 1-2: Build business intelligence and data modeling fundamentals.
  • Months 3-4: Master Power Query, DAX, and report sharing.
  • Months 5-6: Integrate advanced analytics, Python, R, and Power BI Copilot.
  • Months 7-8: Explore Fabric’s lakehouse architecture and real-time analytics.
  • Months 9–10: Explore pro-code tools, REST APIs, and custom visuals.
  • Months 11–12: Understand BI strategy basics and responsible AI practices.

Power BI Roadmap

Understanding the Power BI and Fabric Evolution

Before you set out on your learning journey, it helps to know how Power BI has evolved in recent years, and why keeping up with its roadmap is a smart investment.

The shift to unified analytics

Traditionally, Power BI updates were incremental and standalone. This changed in 2023, when Microsoft launched Fabric, its unified analytics platform that merges data engineering, warehousing, and real-time intelligence. 

Fabric positions Power BI as the visualization layer on top of OneLake, a cloud-first data architecture designed for seamless data integration. You can read more in our article, What is Microsoft Fabric? 

Microsoft’s focus on community feedback means that the platform continuously adapts to real-world needs, with regular updates guided by user requests.

Why staying up to date matters

Keeping pace with the Power BI roadmap ensures you:

  • Take advantage of cutting-edge features like Copilot and real-time analytics.
  • Align analytics projects with broader data engineering and cloud strategies.
  • Maintain a competitive edge in efficiency, insight generation, and compliance.

In short, being proactive about new capabilities prepares you to future-proof your skills and deliver meaningful business results.

12-Month Power BI Learning Roadmap

This roadmap is grouped into key skill areas, each building on the last. Every two-month segment focuses on a core theme, helping you progress and master new skills.

Months 1–2: Build foundational skills

Start by grounding yourself in essential BI concepts and Power BI basics. Strong foundations set the stage for more advanced skills later.

What to focus on

  • Core business intelligence principles: What is BI, and how does it drive value?
  • Data modeling basics: Star vs. snowflake schemas and when to use each.
  • Navigating Power BI: Interface, dashboards, and report building fundamentals.

Objectives

  • Understand the purpose and impact of BI
  • Create simple data models in Power BI
  • Build basic visualizations and navigate the workspace

Top resources

Months 3–4: Master core Power BI skills

With the basics in place, deepen your expertise in the tools that differentiate Power BI, particularly data transformation and analytics.

What to focus on

  • Power Query: Loading, cleaning, and transforming data from multiple sources
  • DAX (Data Analysis Expressions): Writing measures and calculated columns for richer analysis
  • Report publishing and sharing: Publishing reports, refreshing datasets, and setting permissions

Objectives

  • Prepare data for analysis with Power Query
  • Build dynamic calculations and key metrics using DAX
  • Confidently publish and securely share reports with stakeholders

Top resources

Months 5–6: Expand with advanced analytics and AI

Now, you can start leveraging advanced analytics and AI to unlock deeper insights from your data.

What to focus on

  • Integrating Azure Machine Learning: Bringing predictive models into your BI reports
  • Using Python and R scripts: Performing advanced data prep and custom calculations
  • AI-driven features: Exploring Power BI Copilot for natural language queries and automated reporting

Objectives

  • Embed machine learning predictions in dashboards
  • Enhance analytics with Python or R scripting
  • Use Copilot to explore data and generate insights more efficiently

Top resources

Months 7–8: Dive into Fabric and real-time analytics

Fabric takes Power BI from a standalone tool to a fully integrated part of your organization’s data ecosystem.

What to focus on

  • Fabric’s lakehouse architecture: Understanding OneLake, data governance, and unified data storage
  • Spark job orchestration: Managing large-scale data processing behind the scenes
  • Real-time analytics: Setting up streaming datasets, IoT integrations, and using Kusto Query Language (KQL)

Objectives

  • Design scalable data models that work across Fabric
  • Build reports that update with real-time data changes
  • Understand the end-to-end data journey from ingestion to visualization

Top resources

Months 9–10: Embrace developer and pro-code tools

At this stage, you’ll move beyond Power BI’s visual interface and start exploring its more technical features; tools that allow for greater automation, customization, and integration with development workflows. You don’t need to become a full-stack developer, but having a working understanding of these capabilities can help you collaborate more effectively and extend what Power BI can do.

What to focus on

  • Power BI REST APIs: Learn how Power BI REST APIs are used for tasks like report deployment, dataset refresh, and integration into CI/CD pipelines.
  • Advanced DAX and conditional formatting: Expand your ability to create dynamic, responsive reports using advanced measures and rule-based visuals.
  • Intro to custom visuals: Understand how custom visuals work in Power BI, and explore the Fabric SDK if you want to go deeper into building tailored visual components.

Objectives

  • Automate and streamline parts of the analytics workflow using code or scripting.
  • Build more interactive, personalized reporting experiences with DAX and formatting.
  • Gain awareness of development tools that support enterprise-scale Power BI solutions.

Top resources

Months 11–12: Strategic BI thinking and responsible AI

This phase introduces you to strategic thinking in business intelligence, showing how your skills fit into broader organizational objectives and responsible AI practices.

What to focus on

  • Strategic Alignment: Learn how BI analytics support business objectives and stakeholder decision-making.
  • Deployment Pipelines: Understand workspace management, content lifecycle, and certified datasets in Power BI.
  • Responsible AI Fundamentals: Gain foundational knowledge in ethical AI considerations, bias mitigation, and compliance basics.

Objectives

  • Understand how BI strategies support business outcomes.
  • Get familiar with best practices for secure and compliant Power BI environments.
  • Learn fundamental concepts of ethical and responsible AI practices.

Top resources

Conclusion

With Microsoft now tying Power BI more closely to Fabric, it’s even more important to have a structured learning plan. Over these 12 months, I've organized key topics and resources to help you go from understanding the basics to using Power BI strategically in your organization.

But mastering Power BI isn't just about keeping up with new features, it's about approaching data thoughtfully, aligning it with real business objectives, and continually refining your skills. Stay connected to the community, dive into the resources I've recommended, and keep challenging yourself to get better. If you’re ready to jump in, our Power BI Fundamentals skill track is the best place to start.


Matt Crabtree's photo
Author
Matt Crabtree
LinkedIn

A senior editor in the AI and edtech space. Committed to exploring data and AI trends.  

Topics

Top Power BI Courses

Track

Data Analyst in Power BI

0 min
Co-created with Microsoft—gain the Power BI skills you need to prepare, model, and visualize data for the PL-300 Data Analyst certification.
See DetailsRight Arrow
Start Course
See MoreRight Arrow
Related

blog

Data Analyst Roadmap: A 12-Month Step-by-Step Learning Plan

Follow this practical 12-month data analyst roadmap to build essential skills, master analytics tools, complete real-world projects, and launch your data analysis career with confidence.
Matt Crabtree's photo

Matt Crabtree

9 min

blog

SQL Roadmap: A 12-Month Learning Path to Master SQL

This SQL roadmap guides you step by step for 12 months, from basics to advanced SQL, with hands-on projects, tools, and career-focused learning.
Matt Crabtree's photo

Matt Crabtree

12 min

blog

An 8-Step Guide to Becoming a Power BI Developer in 2025

Become a Power BI developer in 2025 with this complete roadmap.
Joleen Bothma's photo

Joleen Bothma

12 min

blog

Python Roadmap: A 12-Month Learning Path

Follow this structured 12-month Python roadmap to master foundational concepts, specialize in specific areas, and build practical, job-ready skills.
Matt Crabtree's photo

Matt Crabtree

15 min

Tutorial

Power BI Matrix: A Comprehensive Guide

Enhance your data analysis skills by learning how to customize a Power BI matrix.
Joleen Bothma's photo

Joleen Bothma

10 min

Tutorial

Power BI Tutorial for Beginners

Learn the basics of Power BI and how to create a basic report with this step-by-step tutorial.
DataCamp Team's photo

DataCamp Team

13 min

See MoreSee More